Fine-Grained Prediction of Political Leaning on Social Media with Unsupervised Deep Learning
←
→
Page content transcription
If your browser does not render page correctly, please read the page content below
Journal of Artificial Intelligence Research 73 (2022) 633-672       Submitted 06/2021; published 02/2022

 Fine-Grained Prediction of Political Leaning on Social Media
              with Unsupervised Deep Learning

Tiziano Fagni                                                             tiziano.fagni@iit.cnr.it
Stefano Cresci                                                          stefano.cresci@iit.cnr.it
Institute of Informatics and Telematics (IIT)
National Research Council (CNR)
via G. Moruzzi 1, 56124 Pisa, Italy

                                                    Abstract
         Predicting the political leaning of social media users is an increasingly popular task,
     given its usefulness for electoral forecasts, opinion dynamics models and for studying the
     political dimension of polarization and disinformation.
         Here, we propose a novel unsupervised technique for learning fine-grained political
     leaning from the textual content of social media posts. Our technique leverages a deep
     neural network for learning latent political ideologies in a representation learning task.
     Then, users are projected in a low-dimensional ideology space where they are subsequently
     clustered. The political leaning of a user is automatically derived from the cluster to which
     the user is assigned. We evaluated our technique in two challenging classification tasks and
     we compared it to baselines and other state-of-the-art approaches. Our technique obtains
     the best results among all unsupervised techniques, with micro F1 = 0.426 in the 8-class
     task and micro F1 = 0.772 in the 3-class task. Other than being interesting on their
     own, our results also pave the way for the development of new and better unsupervised
     approaches for the detection of fine-grained political leaning.

1. Introduction
Since the advent of Facebook and Twitter, politicians have had an increasing online pres-
ence in order to reach out to as many potential electors as possible. As of today, digital
campaigning (including social media) has become mandatory, as people are massively con-
suming political content from social platforms1 . Recently, 20% of interviewed social media
users admitted to have changed their minds about a political issue because of something
they read on social media2 . Political activity on social media is also positively correlated
to offline political activism (e.g., attending offline political events) (Vaccari et al., 2015).
Politically-interested users are keen to know the stance of their friends, to read about candi-
dates and campaigns, and to discuss pressing issues and election results (Grčar et al., 2017;
Tucker et al., 2018). In spite of the relatively small readership of online platforms compared
to that of traditional media (e.g., TVs, newspapers, and radio channels), the sociopolitical
relevance of social media is still massive. In fact, second-order effects – typical of complex
systems – allow for significant portions of the political social media content to be discussed
also on traditional media, thus somehow still making it into the minds of people who don’t
even use social media at all (Benkler et al., 2017).

 1. www.journalism.org/2018/09/10/news-use-across-social-media-platforms-2018/
 2. www.pewinternet.org/2016/10/25/the-political-environment-on-social-media/

©2022 AI Access Foundation. All rights reserved.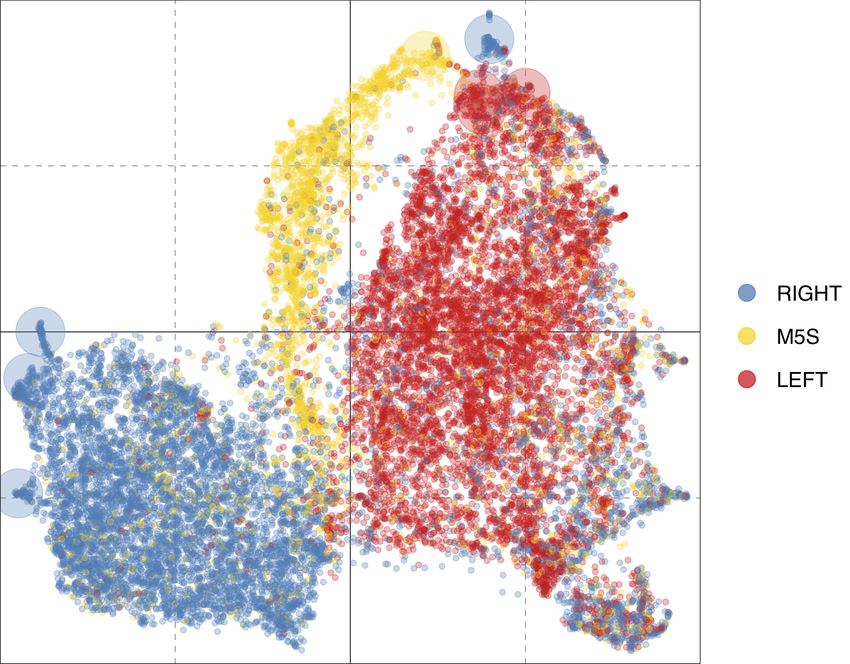
Fagni & Cresci

    Given this picture, it comes with little surprise that the task of learning the political
leaning of social media users recently received a surge of attention. In literature, this task
is also referred to as political stance, ideology, polarity or alignment prediction. Firstly, it
represents a natural extension to the early efforts by social and political scientists at this task.
In fact, ideology lies at the core of many theories in political science and has long been used
to investigate individual behavior and preferences, governmental relations, and links between
them (Bond & Messing, 2015). Traditional estimates are based on explicit preferences, such
as roll-call votes, co-sponsorship records, and records of financial contributions to political
campaigns. However, these data are typically available only for a few political figures (e.g.,
roll-call votes) or for a limited number of ordinary individuals, they are hard to acquire,
and they are made available or updated infrequently. These limitations make fine-grained,
continuous, large-scale analyses of political preferences challenging, if not outright infeasible.
Conversely, social media represent a trove of both explicit and structured (e.g., likes and
social relationships), as well as implicit and unstructured (e.g., text), data about the habits
and preferences, including political ones, of millions of users. As such, many social and
political scientists recently turned their attention to political analyses on social media – e.g.,
by estimating political leaning from social media data and by comparing such estimates with
more traditional ones (Tucker et al., 2018). Meanwhile, also computer scientists found value
in learning users political leaning, for a myriads of goals, such as: to forecast the outcome of
elections (Tumasjan et al., 2010; Ahmed et al., 2016); to estimate accurate priors for models
of opinion diffusion (Dandekar et al., 2013; Mäs & Flache, 2013); to measure and mitigate
online polarization (Wong et al., 2016; Garimella et al., 2017; Nizzoli et al., 2021); to measure
the effects of information operations, disinformation campaigns and propaganda (Nikolov
et al., 2021; Tardelli et al., 2022; Cinelli et al., 2020; Ferrara et al., 2020); to explore the
political dimension of bad actors, such as social bots and trolls (Hegelich & Janetzko, 2016;
Rizoiu et al., 2018; Luceri et al., 2019; Yan et al., 2021; Cresci, 2020).

    Existing approaches to the prediction of political leaning mainly focus on analyzing only
the social or interaction networks (Garimella et al., 2016; Wong et al., 2016), or only the
content of shared messages (Pla & Hurtado, 2014; Di Giovanni et al., 2018; Yan et al., 2019;
Preoţiuc-Pietro et al., 2017), with few exceptions where content and networks are simulta-
neously considered (Lahoti et al., 2018; Aldayel & Magdy, 2019). Network-based approaches
are grounded on the assumption that ideologically-similar users are likely to interact with,
or to follow, each other. A first limitation arises when this assumption is violated – namely,
in all those cases where like-minded users never interact, or in those equally-frequent cases
where opposing users interact (e.g., to argue or to convince each other). There also exist
users that do not follow others, or that follow a very limited number of accounts, which in-
evitably complicates network-based approaches. Notable examples of this kind are @POTUS
in the US and media outlets/journalists that do not follow other accounts, for neutrality
reasons, but that represent interesting subjects of political leaning analyses. Another limita-
tion involves the large amounts of data needed for the analysis (e.g., the social or interaction
graph), which are seldom promptly available. Content-based approaches are instead mainly
limited by the intrinsic difficulty of processing natural language, and by the need for large
corpora of manually-annotated messages and language-specific resources. Moreover, the
majority of existing solutions adopt supervised approaches, which have been shown to lack

                                                634
Fine-Grained Prediction of Political Leaning on Social Media

generalizability and to suffer from the limited availability of comprehensive and reliable
ground-truth datasets (Cohen & Ruths, 2013).

1.1 Our Approach
Our goal in this work is that of developing an unsupervised content-based technique for
predicting the political leaning of social media users. We will focus on two different tasks: (i)
the prediction of the preferred political party of a user (fine-grained task), which in political
science literature is typically referred to as party identification; and (ii) the prediction of its
political pole (coarse-grained task). For bipolar systems, the latter task simply involves the
prediction of left-right ideology, which for US data is typically measured in a continuous,
one-dimensional space, with techniques such as the well-known DW-NOMINATE (Poole &
Rosenthal, 1985). Notably, labels obtained for the two tasks represent different user traits
and should not be equated or used interchangeably. For instance, the difference between the
preferred party and the ideological position of a user in the left-right scale is straightforward
when considering the shifts that parties exhibit between different elections (Busch, 2016).
This is particularly true for the application and evaluation scenario of our work: the tripolar
Italian political system (Pasquino, 2019). Nonetheless, we are interested in evaluating the
efficacy of our proposed method in solving each of the two tasks separately.
     In contrast with previous work, where political ideology and leaning were considered as
synonyms, here we make an important distinction. By drawing upon definitions from the
Oxford English Dictionary, we define ideology 3 as a latent set of concepts that forms the
basis of a user’s political preferences. Instead, we define leaning 4 as the practical political
preferences of a user (e.g., its preferred party). Our approach for predicting political leaning,
independently on the task (i.e., the desired fine or coarse prediction granularity), directly
stems from the previous definitions. In fact, we first adopt an unsupervised approach to
learn informative political representations of social media users. We then project users into
a lower-dimensional space derived from their latent representations, which corresponds to
the political ideology space. Finally, we leverage the topology of the political ideology space
to infer the political leaning of each user. As such, our predicted leanings strictly depend
on the latent ideologies learned for every user.

1.2 Contributions
Operationally, we propose a novel unsupervised solution for estimating the political leaning
of social media users that is able to overcome the main limitations of previous approaches.
Our method follows the scheme shown in Figure 1. Our solution initially leverages a deep
neural network for learning latent users representations. Then, we feed these representations
to a UMAP model in order to project and position users in a latent political ideology space.
Finally, we leverage properties of the ideology space to infer the political leaning of every
user, via clustering. We evaluate our proposed method and those used for comparisons on
two challenging tasks. Specifically, we learn both fine-grained (i.e., party-level) and coarse-
grained (i.e., pole-level) political leaning of Twitter users. Our solution achieves state-of-
the-art results in both tasks, compared to existing unsupervised techniques. Specifically,
3. https://www.lexico.com/en/definition/ideology
4. https://www.lexico.com/en/definition/leaning

                                               635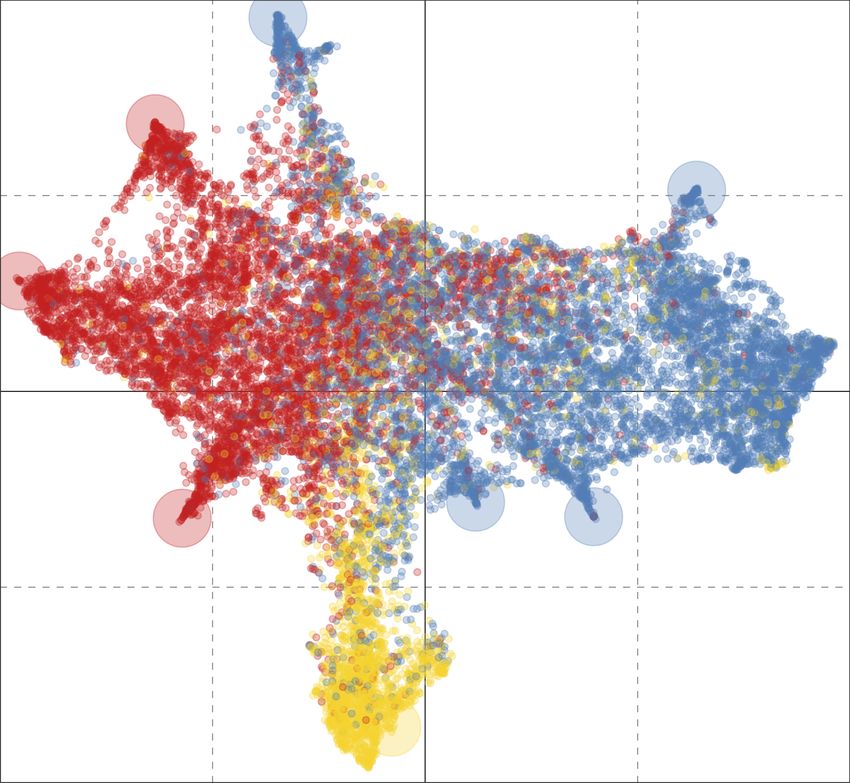
Fagni & Cresci

   Twitter
   data for                                Representation                             Clustering of
   political                                learning step:                              users and
   parties                                                       Projection of
                                               use tweet                             parties: each
                  Build tweet                                  users and parties
                                              classifier to                          cluster found
                 classifier for                                  into a latent
                                          extract high level                           identifies a
                political parties                              political ideology
                                          political features                        specific political
                                                                      space
                                            for users and                             party in the
   Twitter                                      parties                             ideology space
   data for
   generic
    users

                                    Figure 1: Outline of our proposal.

it achieves F 1 = 0.43 and F 1 = 0.77 when predicting fine- and coarse-grained leanings,
whereas other unsupervised techniques and baselines achieve F 1 ≤ 0.35 and F 1 ≤ 0.71,
respectively. Our technique is exclusively based on the textual content of user-generated
social media posts. However, despite exploiting solely this noisy data source, it achieves
performances that are comparable or even better than techniques that leverage cleaner
signals (e.g., social relationships and interactions such as retweets and likes). This makes
our technique particularly valuable since it obtains state-of-the-art performance without
the need for gathering explicit user preferences or data-demanding network representations.
In addition, by adopting an unsupervised deep learning approach, we are also language-
independent, we avoid the need for manually-annotated corpora and linguistic resources,
and we improve the generalizability of our results with respect to the traditional supervised
approaches that are intrinsically limited by the availability of accurate and extensive ground-
truth datasets (Cohen & Ruths, 2013; Cresci, 2020).
    Our main contributions can be summarized as in the following:

   • We provide a state-of-the-art unsupervised method for learning both fine-grained and
     coarse-grained political leaning of social media users.

   • Our nuanced solution disentangles the sub-tasks of learning latent political ideologies
     from that of inferring political leanings, which were mixed and overlapping in previous
     works.

   • We demonstrate the usefulness of unsupervised deep learning and projection with
     UMAP, to accurately position users within a latent ideology space.

   • We show the profitability of leveraging the topology of the learned ideology space to
     infer political leaning via clustering.

1.3 Reproducibility
Our data are publicly available for scientific purposes5 .
5. https://doi.org/10.5281/zenodo.5793346

                                                      636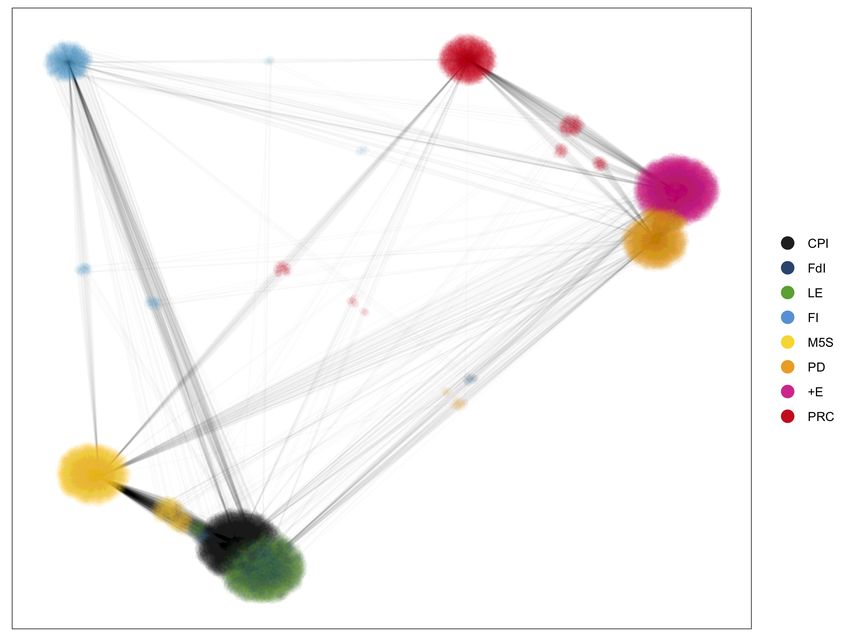
Fine-Grained Prediction of Political Leaning on Social Media

1.4 Roadmap
The remainder of the paper is organized as follows. In Section 2 we discuss previous works on
the prediction of political leaning from social media. Then, before presenting our solution,
in Section 3 we outline the political context in which our study is positioned and we provide
details about our dataset. Section 4 describes our deep learning approach for learning
latent political ideologies of social media users. In Section 5 we discuss our approach for
positioning users in a latent political ideology space, and for inferring their political leaning.
Experiments6 and results are presented in Section 6, while Section 7 draws conclusions and
highlights promising directions for future work.

2. Related Work
In this section we briefly survey extant literature for the prediction of political leaning. We
split previous works based on the information used to make predictions.

2.1 Content-Based Approaches
Among the first approaches at this task are those solely based on the analysis of the textual
content of messages. Pla and Hurtado (2014) investigated the use of sentiment analysis
features. They trained a supervised classification model capable of labeling users based on
their coarse-grained leaning – namely, as either left-leaning, right-leaning, center-leaning or
undefined. Similarly, Di Giovanni et al. (2018) leveraged a set of linguistic syntactic features
in a supervised classification task. The goal of their system was that of learning the political
preference of Twitter accounts towards the 4 main parties in Italy. Despite focusing on
fine-grained (i.e., party-level) predictions, Di Giovanni et al. worked with only 4 parties,
instead of the 8 considered in our present work.
     The previous works are representatives of a rather large body of work based on supervised
content classification. Results obtained by these systems are however disputed by Cohen
and Ruths (2013), since they tend to overestimate performances by focusing on politically
active users (instead of normal or politically inactive users) and since their classification
performances rapidly plummet when applied outside of the narrow range of examples used
for training the systems. Similar results were also recently obtained by Yan et al. (2019),
who evaluated the generalizability of text-based supervised systems for classifying partisan-
ship and political ideology. Specifically, the authors built 3 datasets derived from the US
Congressional Record, polarized media websites, and political wikis. Then, they trained a
set of supervised classifiers on a dataset and they evaluated their performance in classifying
texts from the other datasets. Among the supervised algorithms used for text classification
are logistic regression as well as deep learning-based classifiers such as Marginalized Stacked
Denoising Autoencoders and Semi-Supervised Recursive Autoencoders. Results show the
difficulty of supervised and semi-supervised systems in generalizing from one dataset to
another, thus motivating research and experimentation with unsupervised approaches.

6. Throughout the manuscript we use the term “experiment” with its conventional meaning in computer
   science – that is, an analysis, measurement, or evaluation campaign. This is different from its mean-
   ing in other disciplines (i.e., the social sciences) where experimental approaches involve treatments or
   interventions and are opposed to observational ones.

                                                   637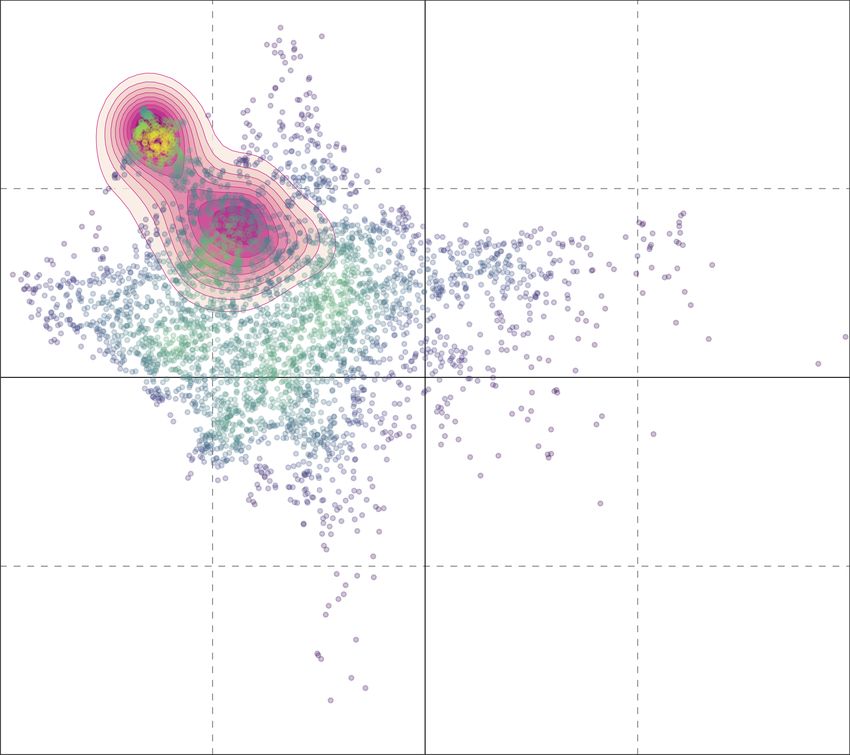
Fagni & Cresci

    Another major drawback of supervised classification is that political leaning is typically
provided as a discrete (e.g., binary) variable. A first improvement over these works was done
by Preoţiuc-Pietro et al. (2017), who predicted the political orientation of Twitter users
on a 7 point scale ranging from “very conservative” to “very liberal”, with several points
reserved for moderate users. They leveraged several features extracted from the tweets
posted by the analyzed users, including features derived from LIWC, sentiment, topics,
named entities and word2vec, and the prediction was performed with simple supervised
classification algorithms (e.g., logistic regression). Conversely, more recent works moved
towards unsupervised approaches. Kulshrestha et al. (2017) proposed a system where the
leaning is obtained by measuring the similarity between the topic vectors of users, with
those of known seed democrats and seed republicans. The political leaning was provided for
each user in the [0, 1] continuous range. This system is unsupervised, however it requires
known sets of seed users, raising the question as to how to obtain such sets. Moreover, an
additional challenge to face when developing systems for predicting continuous (rather than
binary or crisp) leanings, is the lack of ground-truth values for training or evaluating the
system.

2.2 Network-Based Approaches

Approaches purely focused on network characteristics currently represent only a minority
of existing works. Barberá (2015) built a Bayesian spatial model of the Twitter social
network that is based on homophilic network properties. The political leaning of each user
is determined via Ideal Point Estimation. Similarly, Bond and Messing (2015) exploited user
likes to Facebook pages to obtain estimates of political ideology for both parties, politicians,
and ordinary users. Estimates are computed via Singular Value Decomposition (SVD) of an
agreement matrix, which corresponds to a normalized adjacency matrix derived by projecting
the bipartite matrix of user likes to parties onto the set of parties. Instead, Wong et al. (2016)
computed political leaning by solving a convex optimization problem. By leveraging Twitter
data, the objective function embeds signals derived from both the analysis of retweeting
behaviors and features of the retweet networks. These previous works are unsupervised
and provide leaning estimates in the [0, 1] continuous range. Notably, these works, as well
as all others that output one-dimensional scores, can only be applied to bipolar systems
(e.g., to binary prediction tasks). This means that they are not suitable for application
to the detection of fine-grained political leaning, a task that demands the prediction of
multiple classes (i.e., the possible political parties), nor to the detection of coarse-grained
political leaning in those systems that have more than two poles. An example of the latter
is the current Italian political system (Pasquino, 2019), to which we apply our proposed
methodology. The usefulness of the so-called left-right scale, operationalized as the [−1, 1]
or [0, 1] continuous range, is also questioned by Bauer et al. (2017), who found that different
individuals assign different meanings to the “left” and “right” concepts. As such, estimates
based on a unique left-right scale for all individuals risk being biased and inaccurate. More
broadly, Bauer et al. also raised the issue of self-reports, such as those obtained from survey
respondents, as a ground-truth for training automated systems. In fact, many recent studies
uncovered severe biases in self-reports, which motivates research on alternative means of
obtaining ground-truth measurements (Bastick, 2021; Verbeij et al., 2021).

                                               638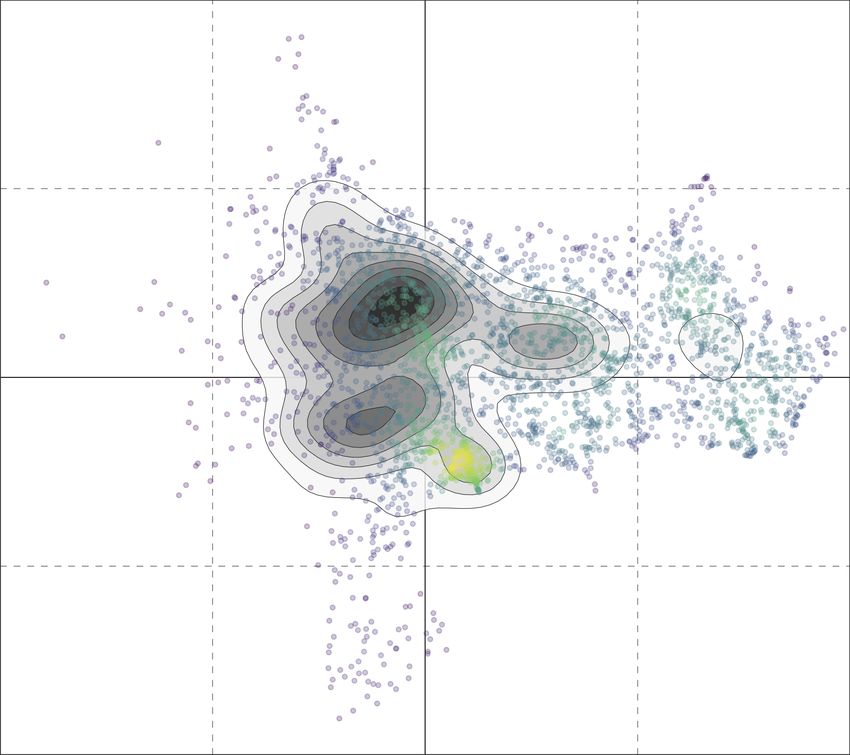
Fine-Grained Prediction of Political Leaning on Social Media

    A recent interactions-based state-of-the-art unsupervised approach is presented by Dar-
wish et al. (2020). Authors built user representations based on the users they retweeted.
Then, they experimented with several projection and dimensionality reduction techniques,
such as t-SNE and UMAP. Finally, they clustered projected users and labelled clusters via
manual inspection. As a result of this process, each user is assigned to the label of the clus-
ter to which it belongs. The system presented by Darwish et al. (2020) has been employed
also for predicting the political bias of media outlets and famous public characters (Ste-
fanov et al., 2019), and to estimate the polarization of Twitter users with respect to certain
debated topics and political issues (Darwish, 2018).
    The aforementioned work is the most similar existing solution with respect to our present
contribution. However, contrarily to (Darwish et al., 2020), we do not explicitly exploit
retweets between users, but we rather leverage the noisy textual content of their tweets.
Consequently, a crucial component in our solution is the deep learning network used to learn
latent user representations from tweets. In addition, we make different choices with respect
to the techniques used for dimensionality reduction, projection and clustering. Finally, we
automatically label clusters based on the labels of the pivots contained in each cluster, rather
then with manual intervention. In our work, we also evaluate systems on a more challenging
task than that tackled by Darwish et al. (2020) (e.g., binary classification), demonstrating
and discussing the advantages of our solution.

2.3 Mixed Approaches
Another large body of work is based on a combination of content and network analysis. The
advantage of simultaneously exploiting both textual content and network representations,
such as those resulting from user interactions, was recently motivated and quantified by Al-
dayel and Magdy (2019). Specifically, they found that several different dimensions of online
profiles and activities can provide useful signals to predict stance and leaning. Among them,
some of the most informative signals can be extracted from user posts, user interactions with
other users, websites visited, and user likes to other content on the platform.
    Among the first works to jointly exploit content and interaction networks is (Conover
et al., 2011). Authors exploited features derived from hashtags and from the retweet net-
work, in a supervised binary classification task. Similarly, also Pennacchiotti and Popescu
(2011) focused on supervised binary political classification. Their system is fed with fea-
tures encompassing profile, tweeting behavior, linguistic, social, and interaction network
information. Being based on supervised classification, both previous works still suffer from
the limitations outlined by Cohen and Ruths (2013) and can only provide a dichotomic
estimate of polarity. The work by Lahoti et al. (2018) instead provided interesting advances
on this task. It is a state-of-the-art unsupervised framework based on non-negative matrix
factorization, which learns a shared latent space between users and content. Similarly to
other already-surveyed works, political leaning is considered as a one-dimensional continuous
variable in the [0, 1] range. However, the framework can be used to model more than one
variable at a time (e.g., ideology, popularity), which represents an interesting improvement
over previous works.
    One of the limitations of network-based and mixed approaches is the need for explicit so-
cial relationships or user preferences (e.g., likes, retweets). In fact, it has been demonstrated

                                              639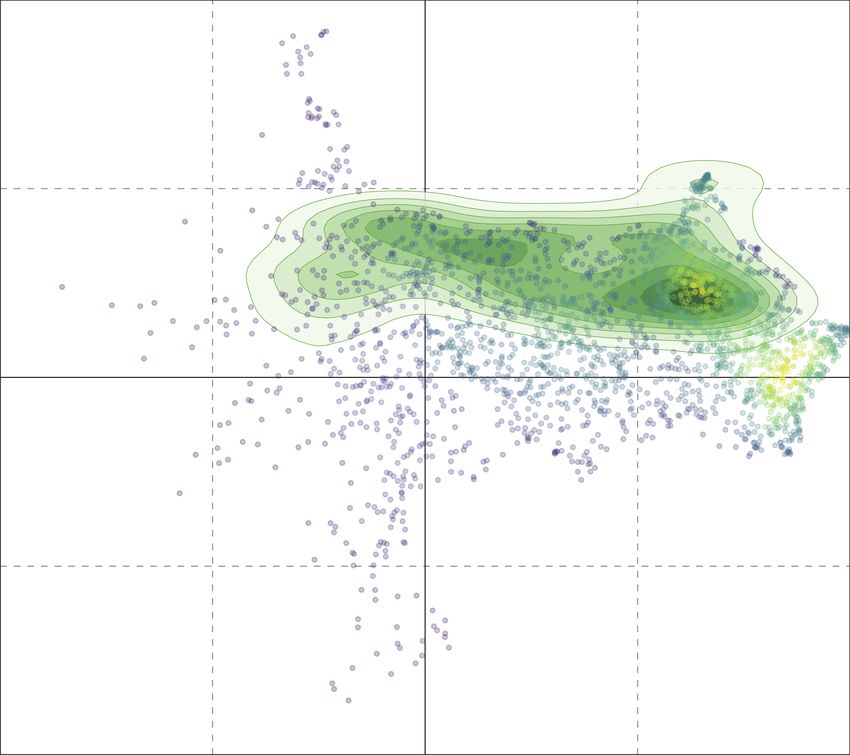
Fagni & Cresci

that extracting these information is a data- and time-demanding task and that such infor-
mation is not always available (e.g., due to platform data-access restrictions) (Cresci et al.,
2015). In turn, this decreases the applicability of such techniques and hinders large-scale
social media analyses. Contrarily, our proposed technique achieves comparable or better
performances while only exploiting the textual content of user posts, which are readily
available.

3. Preliminaries and Data
This section provides preliminary information on the political landscape in which our anal-
yses take place. Furthermore, it provides details on our dataset and its labeling.

3.1 The Italian Political Landscape
We focus our study on politically-active Italian Twitter users. Thus, our aim for this work is
predicting the leaning of Italian Twitter users, within the current Italian political spectrum.
Before delving into the details of our methodology, we first outline the Italian political
landscape as of November 2020.
    The last Italian general elections were held in March 2018, and resulted in the populist
party Five-star Movement (M5S) winning the election with 32.7% votes, followed by the
center-left Democratic Party (PD) with 18.7% votes and the far-right League (LE) party that
obtained 17.4% votes. Despite receiving slightly more votes than LE, PD is considered one of
the losers of the election, since it dropped from 40.8% votes received at the 2014 European
elections, to 18.7% in 2018. The last major Italian party is the center-right Forward Italy
(FI) that obtained 14.0% votes. Based on this outcome, a coalition government was formed
in May 2018 by M5S and LE. This lasted until August 2019, when a government crisis
initiated by LE led to the formation of a new coalition government in early September. This
government, which is still in charge at the time of writing, is led by M5S and PD, together
with other minor parties7 . The peculiarity of the current Italian political landscape is
represented by the populist and anti-establishment M5S, whose members refuse to position
in the traditional left-right bipolar paradigm since they regard M5S as a non-party 8 . As a
consequence, the coarse-grained Italian political landscape is a tripolar system consisting of
right-leaning parties, left-leaning parties, and the M5S (Pasquino, 2019). Notably, carrying
out predictions of political leaning in a tripolar system has implications on the techniques
used for the analysis, since some of the existing ones have been specifically designed for
bipolar systems (e.g., left vs right, liberals vs conservatives, in favor vs against a given
topic).
    In addition to the aforementioned parties, in this study we also consider 4 minor parties
that together accounted for 8% votes in the 2018 general elections, thus covering the whole
extent of the Italian political spectrum and including both major and minor parties. Table 1
summarizes the main information, name and color conventions for all considered parties and
their leaders. Henceforth, we refer to the party Twitter accounts as our pivots, since they

7. https://en.wikipedia.org/wiki/Conte_II_Cabinet
8. https://en.wikipedia.org/wiki/Five_Star_Movement

                                             640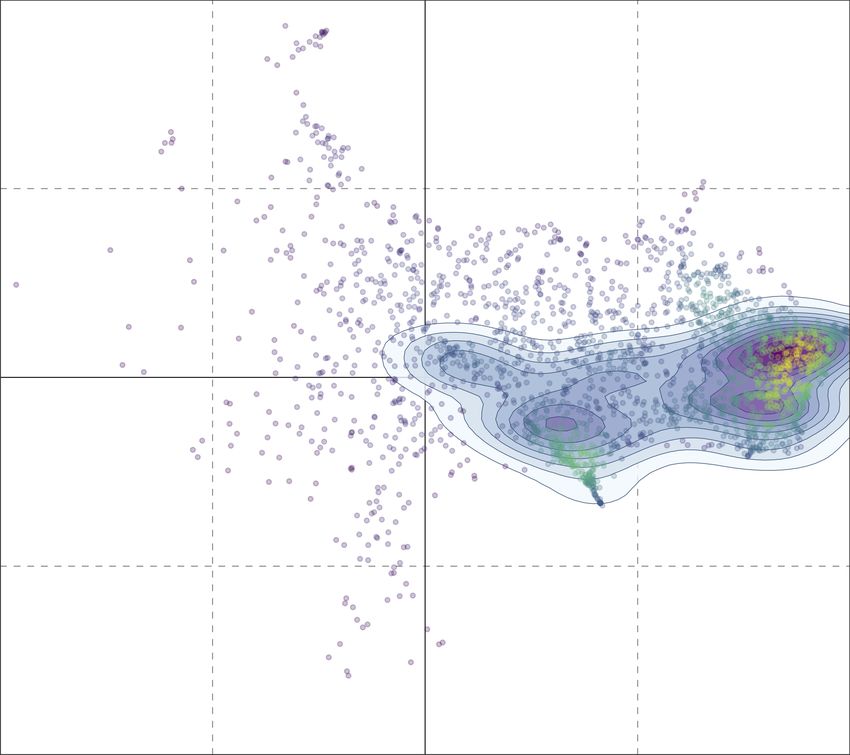
Fine-Grained Prediction of Political Leaning on Social Media

 leaning      party name          party handle         leader handle     label   color   #users
           CasaPound Italy      @casapounditalia      @distefanoTW       CPI               2,997
           Brothers of Italy    @FratellidItaIia      @GiorgiaMeloni     FdI               2,507
 RIGHT
           League               @legasalvini          @matteosalvinimi   LE                2,705
           Forward Italy        @forza_italia         @berlusconi        FI                  746
   M5S     Five-star Movement   @Mov5Stelle           @luigidimaio       M5S               3,206
           Democratic Party     @pdnetwork            @nzingaretti       PD                2,377
           +Europe              @piu_europa           @bendellavedova    +E                4,335
  LEFT
           Communist Ref.       @direzioneprc         @maurizioacerbo    PRC               1,326

Table 1: Information about the 8 Italian parties, and their leaders, considered in this study.
Rows are grouped according to the coarse-grained political leaning, representing the tripolar
Italian political system.

play an important role in the estimation of political leaning. Notably, the only preliminary
data needed by our framework are (i) the pivots, and (ii) their coarse-grained leaning.

3.2 Twitter Dataset

Our aim for this work is to develop a framework for estimating political leaning in an un-
supervised fashion (i.e., with no manual labeling involved). To combine the strengths of
labeled datasets (e.g., rich, high-quality data) with those of unsupervised approaches (e.g.,
generalizability, no bias or errors due to manual labeling), our desiderata is to acquire a
dataset that is implicitly labeled, with respect to political alignment. We met our desider-
ata by leveraging favorited (i.e., liked) tweets, and by considering political likes as proxies
for political leaning. Other options, also adopted in some previous works, could have in-
volved the exploitation of retweets or follower relationships to political parties. However, we
consider likes to be stronger indicators of political preference (Aldayel & Magdy, 2019).

    Operationally, we first crawled the Twitter timelines of our pivots. Then, for each col-
lected tweet, we obtained a list of users that liked that tweet. At the end of this process
we obtained a bipartite graph linking 20,199 users to our 8 considered parties, based on
explicit user likes to party tweets. The number of users that liked at least one party tweet
is reported in the last column of Table 1, for every party. We completed our data collection
by crawling the most recent 200 tweets from the timelines of all 20,199 users, which resulted
in more than 3.6M tweets, in total. When building the dataset, we only included users
whose timeline contained at least 25 tweets. For each user, we collected at most up to 200
tweets. This data collection process roughly covered the months of August to early October
2019. On average, user timelines include 179.3 tweets, evenly distributed during our data
collection period. Finally, we performed a stratified sampling to split our dataset into a
training (90% – 18,169 users), a validation (3% – 604 users) and a test (7% – 1,426 users)
partition. As a result of our splitting strategy, the distributions of parties and poles across
the 3 data partitions are comparable.

                                                641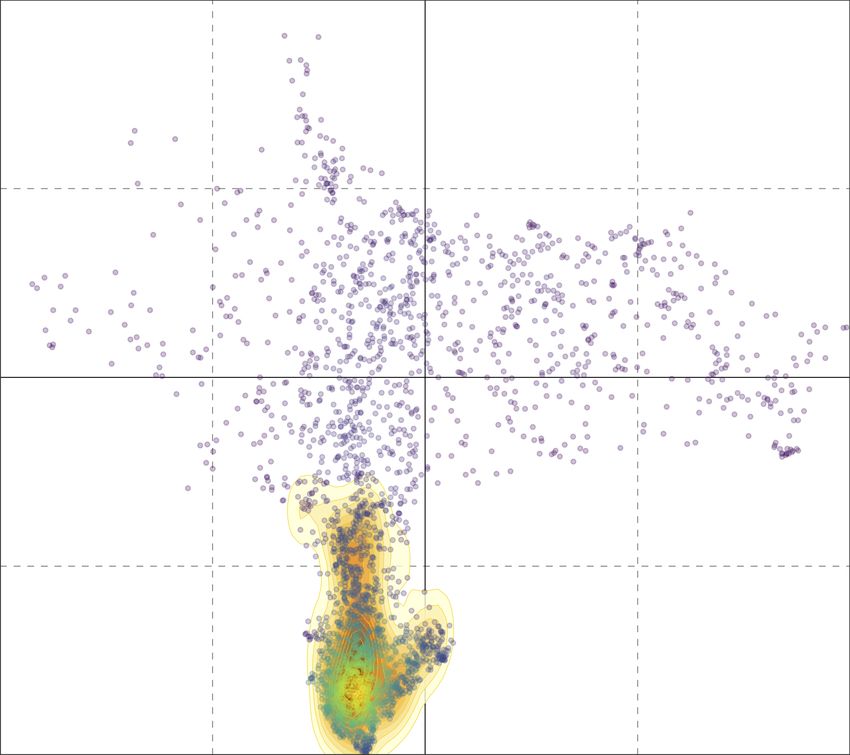
Fagni & Cresci

Figure 2: Louvain clustering of the weighted user-similarity network. Edge weights are
based on user likes to party tweets. Clusters are color-coded and each cluster is associated
to a political party. User labels resulting from this clustering are used as ground-truth for
evaluating predictions of user political leaning.

3.3 Ground-Truth Labeling

Since we do not know the preferred party of the users in our dataset, we obtain a ground
truth for our task by leveraging user likes to party tweets. Specifically, we first build the
bipartite graph of users and party tweets, where links between nodes represent user likes to
party tweets. Next, we project the bipartite graph onto the subset of user nodes, obtaining
a weighted, undirected user-similarity network. Links in this network represent similarity
between users. In order to build this network and to compute the similarity between users,
we adopt a simple weighting scheme based on the frequency of common associations in the
bipartite graph. In other words, the similarity between two users is measured as the number
of tweets liked by both users. Finally, we cluster users in this network with the Louvain
community detection algorithm (Blondel et al., 2008). Each user is then labeled with the
political party corresponding to the cluster it belongs to. Figure 2 shows the clustered
user-similarity network derived from our dataset. Clusters are color-coded and determine
the ground-truth label for each user. As shown, in this representation user clusters are
sharply defined. The vast majority of users only has edges connecting to other users of the
same cluster, with only a few edges connecting users across different clusters. In turn, this
implies that user likes to party tweets are a very strong signal of political alignment. In
the following, we describe our approach for the challenging task of inferring user political
leaning from tweets, which represent a much more noisy signal than likes.

                                            642
Fine-Grained Prediction of Political Leaning on Social Media
4. Learning Latent Political Ideologies
Determining users political leaning from the analysis of the content posted on social media
is a challenging task. One challenge stems from the need to find a clever way to focus the
analysis on politically-relevant content only. Indeed, a typical user’s timeline is filled with
posts related to several different topics (e.g. sport, spare time, work, politics) that embrace
all aspects of the user’s life. The first difficult step is therefore related to splitting the
relevant contents (i.e., those related to politics) from the rest of the messages that, within
this context, simply represent noisy and unhelpful data for inferring users political leaning.
A second critical aspect, given a post covering political topics, is to properly measure how
such message is politically close to the typical ideology of a specific party or pole. This
measure can predict how much the post is in agreement toward a specific ideology, so having
access to enough messages in a user’s timeline that convey this information can contribute
to accurately estimate its final political leaning.
We sorted out both these critical issues by proposing a novel unsupervised process or-
ganized in seven high-level steps, shown in Figure 3. In step 1 we build an automatic tweet
classifier for assessing if a tweet has been produced by a certain political party. Details on
how the classifier is trained are given in Section 4.1. In steps 2, 3, and 4 we leverage the
classifier to compute vector representations for users and parties. We exploit representa-
tions of users and parties to identify a subset of users that are particularly similar to the
considered parties. These steps of our methodology are described in Section 4.2. In step
5 we automatically analyze the tweets from the subset of users whose representations are
similar to those of the parties. In particular, for each of such users we select a subset of
his/her tweets that conveys explicit political opinions. In step 6 we use these user-generated
tweets as additional training examples in a second training phase of our tweet classifier,
since they represent political tweets with different characteristics than those already seen by
the classifier (i.e., those obtained from the official party accounts rather than from ordinary
users). The final classifier is used in step 7 to compute the final vectors of users and parties.
Each computed vector corresponds to the latent representation of a user. In other words,
learned vectors allow to position users in a shared latent political ideology space. Steps 5,
6, and 7 are described in Section 4.3. Finally, in Section 5 we describe how we leverage the
relative positions of users in the latent political ideology space to infer the preferred party
for each user.
4.1 Predicting the Political Relevance of a Tweet
In this step we are interested in measuring the degree of agreement of a relevant political
tweet with the typical political ideology of each party involved in this study. Before describ-
ing how this step works, it is helpful to define what a relevant tweet is. We deem a tweet to
be politically relevant if it expresses a subjective opinion in favour or against a specific party,
a party leader, a specific person, or a political position ideologically known to be near to a
certain party. In this context, possible examples of relevant tweets are unquoted retweets of
tweets posted by political parties or leaders, unquoted retweets of messages of other users
where they express a political opinion on something, tweets replaying to political leaders
where a user shows its appreciation or a negative attitude toward the author of message.
643Fagni & Cresci
HighLevelOverviewLearningPoliticalIdeology.drawio 16/06/21, 12:28
Step Step
1 4
Party vectors
(pivots)
Compute most similar
Train users to political parties
Tweets from Party classifier Most similar users
party classifier and automatically label
political
parties them
User vectors
Step Step
Party classifier 2 5
Party classifier
Generate party Party vectors Identify tweets with high
vectors (pivots) relevance to political
contents and annotate Enrichment
them with corresponding tweets
user's label
Tweets from
Tweets from most similar
political users
parties
Step
Step Tweets from 6
Party classifier 3 political
parties
Generate user Train "enriched" party Enriched party
User vectors
vectors classifier classifier
Enrichment
Tweets from tweets
generic users
Enriched party
classifier Step
7
Vectors (users and parties)
Tweets from Generate final user
to be mapped directly to
political and party vectors
ideology space
parties
Tweets from
generic users
Figure 3: High-level overview of the proposed unsupervised strategy to map users to a latent
political ideology space.
Given a tweet, it is possible to quickly determine if the text is politically relevant by
leveraging an automatic multiclass classifier which has learned, from examples of political
tweets, to predict if a tweet has been produced by a specific political party. Indeed, such
classifier should be able to assign not only proper labels (i.e., the most probable party that
could have produced that tweet) but also to estimate a confidence in its decision which can
be seen as a “relevance level” of the tweet with respect to political topics9 . Such type of
solution normally requires a manual annotated dataset. Here, we obtained the same result in
9. The higher is the confidence score of the classifier, the higher is the probability that the tweet content is
expressing something which is politically relevant.
https://app.diagrams.net/ Pagina 1 di 1
644Fine-Grained Prediction of Political Leaning on Social Media
Input Embeddings Temporal Features
tweet mapping features compression
Transformer (heads = 2, filters = 256)
@
Global Max Pooling + dropout (0.2)
2
CNN 1D (256 filters, window = 3)
embeddings size = 32
PRC
@user #today is a great day!
FI
0.19, 0.41, ..., 0.63
0.41, 0.39, ..., 0.22
0.67, 0.05, ..., 0.09
0.23, 0.45, ..., 0.43
0.22, 0.44, ..., 0.49
0.23, 0.22, ..., 0.01
0.23, 0.13, ..., 0.23
0.11, 0.12, ..., 0.15
u
3
Dense (size = 32)
+E
LE
...
...
PD
FdI
Rows activated into
embeddings matrix are
passed to next layer
45
y
M5S
CPI
46
!
Embeddings
table
Tweet Informative
Spatial Final party
character feature
features classification
encoding selection
Figure 4: Neural network architecture of our party classifier.
an unsupervised way by exploiting the implicit relationship between tweets and the Twitter
accounts that have produced them. In particular, we focus on the official accounts of the
8 considered parties and we use their timelines to automatically build a labeled dataset.
In this way, each tweet posted by party account P is labeled as generated by political
party P and the problem we solve is the prediction of the party that produced a tweet
only based on the textual content of the tweet itself. Our approach thus resembles labeling
schemes by distant supervision (Marchetti-Bowick & Chambers, 2012). Building our dataset
by focusing on party accounts also has two important practical implications that simplify
solving our task. The first implication is that we are certain that the labels assigned to
tweets are correct. This allows us to train a classifier on a real gold-standard thus avoiding
sub-optimal solutions caused by biases and labeling errors introduced during error-prone
manual labeling operations (Misra et al., 2016; Pandey et al., 2019). The second and most
important implication is that each considered timeline is “clean” (i.e., not noisy) and contains
only politically-relevant tweets10 . Such politically-relevant tweets are typically in favour of
the party, of its leader, or of some action proposed, and only seldom against another political
competitor.
By following the strategy described above, we built a dataset composed by all the tweets
(in the form of original contents or retweets) posted in the timeline of the considered 8
political parties. For each party we selected the most recent 3,000 tweets. At the end of
this process we obtained an almost balanced dataset composed of 23,791 labeled tweets. By
leveraging these data, we built the political party classifier using the neural network archi-
tecture shown in Figure 4. We used a character-based encoding to obtain an initial vector
for each tweet. Our method uses an embeddings character table which is learned during the
10. It is extremely rare that an official account of a political party posts something which is not related to
politics.
645Fagni & Cresci
training phase. Each tweet vector is thus mapped into a new vector using the embeddings
table and next passed to a CNN layer (LeCun et al., 1998) with the aim of extracting spatial
features – i.e., those that are invariant to the locations where they occur. This set of fea-
tures is then processed by a transformer layer (Vaswani et al., 2017) that extracts the most
informative temporal recurrent patterns from the data. The gathered information are thus
filtered and compressed before being used to produce the final classification of the tweet.
4.2 Extracting a Politically Relevant User Vector
The party classifier built in the previous section can be employed to extract high level
features that express the political attitude of a user with respect to all parties. In partic-
ular, by processing the entire timeline of a user with such classifier we can identify which
tweets are politically relevant (i.e., tweets classified with medium/high confidence scores)
and which
U political parties the user’s opinion aligns with. More formally, let us define
TU = ti | i = 1, ..., min (200, |TU |) as the timeline of user U where ti is its i-th most
recent tweet and |TU | is the number of tweets available in the whole timeline of U . Let us
also declare P = {PRC, +E, PD, M5S, FI, LE, FdI, CPI} as the set of the 8 considered parties
such that P1 = PRC, P2 = +E, and so on. We define the party classifier as the function C
mapping a tweet t to a score vector as in the following:
C : t ∈ R280 → [sP1 , sP2 , . . . , sP8 ] ∈ R8 (1)
where sPi ∈ [0, 1] is the score assigned by classifier C to the tweet t for party Pi . Given
the timeline of user U , we can compute SU,i,k as the set of the best k scores obtained for a
specific party Pi , as in the following:
SU,i,k = {maxk {C (t)i } | t ∈ TU } ∈ Rk (2)
Given the previous definitions, we can finally define how to extract a politically relevant
user vector:
VUk = [SU,1,k , SU,2,k , . . . , SU,8,k ] ∈ R8k (3)
The vector VUk is a concatenation of the best tweet scores measured on the relevance to
each party, which is indicative of the interests and the leaning shown by the user toward
a specific political ideology. In this work, we fixed k = 5 in Equation (3) based on early
experimentation demonstrating this value to yield reliable measures of the degree of interest
shown by a user for a specific political party. Indeed on the one hand, a larger k would
require the user to post a lot of political content in order not to penalize excessively the
weight of a specific political stance. On the other hand, a smaller k would require to have
an extremely accurate party classifier.
4.3 Unsupervised Data Enrichment to Improve Tweet Party Classification
As for all supervised classifiers, the party classifier built in Section 4.1 works well when
analyzing tweets whose writing style is similar to that of tweets used in the training dataset.
In particular, using party accounts as positive seeds in the dataset construction phase, poses
some limitations to the learned classifier for correctly handling the true tweet distribution.
646Fine-Grained Prediction of Political Leaning on Social Media
Indeed, official party tweets are typically written in a clean, formal and institutional lan-
guage. In addition and as previously anticipated, they also typically provide facts in support
of the work of the party or of its political leader. On the contrary, political tweets from aver-
age users have different linguistic characteristics. Their writing style is informal and tweets
contain abbreviations, slang, and jargon expressions. Regarding the opinions conveyed in a
typical user tweet, sometimes users support a political party or leader. However, oftentimes
users also express strong disagreement toward an opposing political opinion or politician. In
particular, a considerable set of users tend to provide more destructive opinions (e.g., harsh
comments against someone or something) than constructive ones (Nizzoli et al., 2021). In a
few edge cases, the political opinions expressed in a user’s timeline are exclusively against
something or someone. Because of this, it is important to transfer such nuances to the party
tweet classifier during its training phase, in order to be able to infer accurate user political
ideologies.
Given these motivations, here we propose an unsupervised strategy to enrich original
training data with labeled tweet examples coming from all types of users. This enrichment
process is aimed at providing also negative tweet examples to the tweet party classifier,
in addition to the positive tweets from the official parties, and can be summarized in the
following steps:
1. Obtain the vector representations for the pivot (i.e., party) accounts. This can be
achieved with Equation (3).
2. Select those training-set users that are most similar to each party account.
2.1. For each training-set user, we obtain its vector representation with Equation (3)
and we compute its cosine similarity with respect to the vector of each party.
2.2. For each party, we sort users based on their similarity and we select users laying
above the 99-th percentile of the similarity distribution (i.e., the most similar
ones). We automatically assign the label of the party to each user matching this
condition.
3. Select tweets to be used as an enrichment for training the tweet party classifier. To
reach this goal, we analyze the timelines of the users selected at the previous step. For
each selected user, we use the party classifier C to predict the political relevance of
all the tweets in the user’s timeline. Then, we retain only those tweets for which C
yielded a score sPi ≥ T h for at least one party Pi . For large values of the threshold
T h, this results in selecting only those tweets for which our classifier provided strong
predictions. Such tweets are used as enrichment tweets in a second training phase of
the classifier. The ground-truth label assigned to those tweets is that of its author,
assigned at step 2.1 of this procedure. Notably, this label that we inferred in an
unsupervised fashion is likely to be correct since we are considering users that are very
similar to a given party in the political ideology space. Overall, this process allows to
expand the training set by ingesting tweets from average users in addition to those of
official party accounts, while still retaining a high confidence of the new tweets’ labels.
4. Build a new party classifier C 0 using both the original training dataset and the enrich-
ment data, using the same architecture shown in Figure 4. As a consequence of the
647Fagni & Cresci
original tweet translated tweet Lc Lo
√
@Mov5Stelle Invece di tagliare la rappre- @Mov5Stelle Instead of cutting the rep- PRC M5S
sentanza, bastava dimezzare gli stipendi. resentation, it was enough to halve the
Una legge ordinaria, sicuramente più ve- salaries. An ordinary law, a procedure cer-
loce come iter di una legge costituzionale. tainly faster than a constitutional law.
√
Salvini chiede I pieni poteri (!!!), sappi- Salvini asks for full powers (!!!), you should +E LE
atelo... be aware of this...
√
RT @gennaromigliore: A Genova la polizia RT @gennaromigliore: In Genoa the po- PD CPI
rompe le ossa al cronista #StefanoOrigone lice breaks the bones of the reporter #Ste-
e protegge le canaglie di #CasaPound: fanoOrigone and protects the villains of
bisogna sanzionare... #CasaPound: you have to punish...
√
#CasaPound Si arriverà davvero allo #CasaPound Will there really be the evac- M5S CPI
sgombero dei "fascisti del Terzo Millen- uation of the "fascists of the Third Mil-
nio" dal palazzo di 6 piani che hanno oc- lennium" from the 6-storey building they
cupato abusivamente da 15 anni nel centro have squatted in the center of Rome for 15
di Roma? years?
√
@dariofrance @nzingaretti Sarebbe un gov- @dariofrance @nzingaretti It would be a FI PD
erno peggio di questo. Peggio del #pd non worse government than this. There is
ci sta niente in circolazione! nothing around that is worse than #pd!
√
Un Altro PD Idiota contro Salvini ciabat- Another PD-idiot against Salvini moron LE LE
toni
√
Ennesimo strafalcione geografico per il Yet another geographical blunder for the FdI M5S
#M5S: questa volta il vento del cambia- #M5S: this time the wind of change even
mento sposta addirittura le regioni! Spe- moves the regions! We hope the funds re-
riamo i fondi arrivino davvero in #Molise, ally arrive in #Molise, without detracting
senza nulla togliere alle #Marche.. anything from the #Marche..
√
@virginiaraggi La compatisco. Fra un paio @virginiaraggi I sympathize with you. In CPI CPI
d’anni, allo scadere del suo mandato, lei a couple of years, at the end of your term,
finirà nell’oblio come merita. CasaPound you will be forgotten as you deserve. Cas-
sarà sempre al suo posto. aPound will always be in its place.
Le chiacchiere fanno i pidocchi, i mac- The chatter makes the lice, the macaroni FI CPI
cheroni riempiono la pancia fill the belly
In bocca al lupo alle ragazze e ai ragazzi Good luck to the girls and boys of my PD CPI
della mia commissione. Domattina si parte commission. Tomorrow morning we begin
#notteprimadegliesami #nightbeforeexams
Table 2: Examples of tweets included in the enriched training-set of the party tweet classifier.
√
Politically-relevant tweets are marked with , irrelevant ones are marked with . The label
initially assigned by C to each example is reported in column Lo , while the label corrected
through the usage of the minimal distance from a party account is reported in the Lc column.
enriched training-set, the new classifier C 0 is more accurate than C, especially with
regards to informal and negative political tweets.
In our preliminary experiments, we found that T h = 0.5 is a reasonable value to get
both several thousands of new labeled examples and a large variety of new tweets featuring
substantial differences in their writing style, with respect to the typical tweets of an official
party account. In detail, by applying the aforementioned process: (i) in step 2 we selected
1,462 users equally distributed among all parties, and (ii) at the end of step 3 we obtained an
enrichment dataset composed of 8,753 new labeled tweets. As shown in Table 2, this method
is obviously not perfect but it ensures to obtain a plentiful variety of different examples that
648Fine-Grained Prediction of Political Leaning on Social Media
(a) Our technique. (b) Word2vec.
Figure 5: UMAP projections of the latent political ideology spaces learned by our pro-
posed technique and via word2vec. Colors encode ground-truth party labels. Larger circles
highlight the position of the official accounts for each considered party (i.e., our pivots).
help to improve the precision and the generalizability of the enriched party classifier C 0 , in
an unsupervised fashion.
5. Predicting Political Leaning
By using the encoding scheme presented in Section 4.2, we are able to analyze the proposed
method from a qualitative point of view and to map each user into a position within a shared
latent political ideology space. This mapping is built directly onto user vectors with the aim
of projecting users over a bidimensional geometric space in such a way to (i) minimize the
distance between similar users having close political ideas and (ii) maximize the distance
between users having different political opinions. To perform feature reduction and to map
the latent user vectors in R40 to an equivalent space in R2 , we leveraged UMAP with default
parameters (McInnes et al., 2018). The mapping obtained from training data11 is shown in
Figures 5a and 6a, where users are respectively colored according to their party and pole
labels.
Regarding party projections, the first observation is that many users supporting a specific
party are concentrated in the neighborhood of the party itself (indicated by large circle
points). This is a quite strong indication that user feature representations provided by
Equation (3) properly describe the political stance of the parties. In addition, when users
have enough political content in their timeline, the same method also allows to position them
near to their preferred party. This first result is verified for all parties, and particularly so
for the left-leaning ones and for the M5S. Regarding right-leaning parties (right-hand side
of the figures), although this trend is confirmed, the situation is more fluid with users of
FI clearly separated from the users of the other 3 right-leaning parties (CPI, FdI and LE).
11. Here, to better highlight data distribution in the political ideological space, we used training data because
the amount of users is far bigger than those contained in test data and the distribution of points is
practically the same (i.e., there is no drift between training and test data).
649Fagni & Cresci
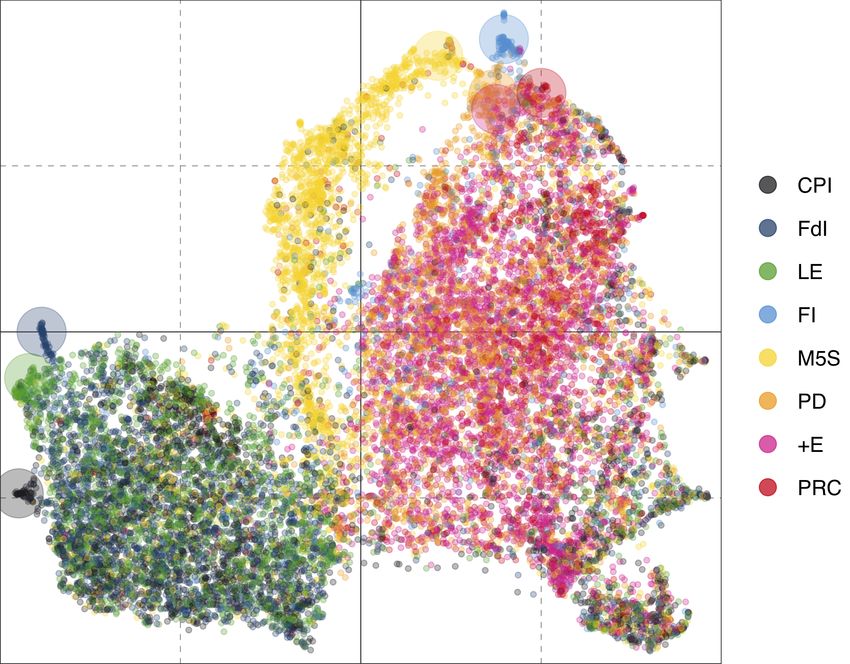
(a) Our technique. (b) Word2vec.
Figure 6: UMAP projections of the latent political ideology spaces learned by our proposed
technique and via word2vec. Colors encode ground-truth pole labels (right-leaning, left-
leaning, and M5S). Larger circles highlight the position of the official accounts for each
considered party (i.e., our pivots).
Indeed, supporters of the latter parties, in addition to forming clear clusters positioned
around official party accounts, are spread over wide areas of the political ideology space,
also creating regions where users of different parties are mixed together. This feature of our
learned political ideology space is in agreement with the Italian political landscape, where
these 3 far-right parties hold similar stances with respect to many political issues (Pasquino,
2019), and with the opinions expressed by their electors. By analyzing Figure 5a, it is also
worth noting that even the central area of the ideology space contains a mixture of users
belonging to different parties. Also this situation is expected and understandable, since it
represents undecided users and users that hardly share any political content at all.
When considering pole projections shown in Figure 6a, we can see that there is a clear
separation between the three poles, with only the central region of the ideology space charac-
terized by a physiological group of users whose political stance is not uniform, for the same
motivations given before. Quite naturally, these qualitative results suggest that the fine-
grained task (i.e., party prediction) represents a much more challenging problem than the
coarse-grained one (i.e., pole prediction). This naturally results from the minimal differences
between some of the considered parties.
For comparative purposes, in Figures 5b and 6b we show the latent political ideology
space obtained with a user encoding based on word2vec (Mikolov et al., 2013) instead of
the one learned with our method. Word2vec is a very popular embeddings method that al-
ready demonstrated an excellent encoding power on many NLP tasks. In this case we used
word2vec algorithm provided by gensim library12 to build from scratch a custom model op-
timized for this specific context by learning the latent space directly from the used Twitter
dataset. In order to build the new word2vec model, we applied a minimal step of prepro-
cessing to raw textual data. In particular, we transformed texts into lowercase and removed
12. https://radimrehurek.com/gensim/
650Fine-Grained Prediction of Political Leaning on Social Media
all stopwords. With the resulting data, we built a word2vec model keeping only the most
frequent 50,000 words. Each tweet is thus vectorized by computing the mean of the sum of
vector embeddings of each word occurring in the text. The user vector is finally obtained
by computing the mean of the tweet vectors extracted from the user’s timeline. Differently
from our method, the word2vec encoding seems unable to clearly separate the different po-
litical parties, as demonstrated by several regions of the ideology space featuring a mixture
of users from different parties. Another major drawback of this approach is represented
by the vicinity between the accounts of several different parties. While in Figure 5a each
pivot held a specific position in the ideology space, clearly separated from that of other
parties, in Figure 5b several pivots end up laying in the same area of the ideology space,
which inevitably hinders party separability and the prediction of users’ political leaning.
Regarding pole predictions, the situation improves. However, it does not reach the level of
data separation obtained with our proposed technique. In summary, these findings suggest
that word2vec encoding, in this particular context, is sub-optimal and not able to properly
model the semantics of political ideologies of the different parties.
Based on the favorable properties of our learned latent political ideology space, the
unsupervised prediction of user political leaning can be achieved by applying a clustering
algorithm directly to the bidimensional projected user vectors. Without loss of generality,
in this work we assume that we know the number of clusters we want to obtain at the end
of clustering process (i.e., 8 clusters for the party prediction task and 3 clusters for pole
prediction task). The steps needed by the clustering process are summarized the following:
1. Projection of the users into a new bigger latent space based on the similarity of users.
Each distinct user is seen as a separated feature in this new space and the feature
vector of each user is generated by computing its pairwise distance to all the other
users. This step was originally proposed by Darwish et al. (2020) and demonstrated
to improve the subsequent clustering step.
2. Feature reduction using UMAP to prevent the curse-of-dimensionality due to data
sparseness (Domingos, 2012).
3. Feature standardization by subtracting the mean and scaling the features to unit
variance.
4. Data clustering using the KMeans, GaussianMixture, or MeanShift algorithms. This
clustering step is based on the implementations provided by the sklearn Python soft-
ware package13 .
The first 3 steps of the above list are optional and can be used only in specific cases
where they improve clustering accuracy. For the experiments reported in the next section,
we followed the approach used by both Darwish et al. (2020) and Di Giovanni et al. (2018),
and we evaluated different configurations on the validation partition of the dataset. Then,
we used the best configuration obtained on the validation set to label users of the test set.
The details about the specific configurations that we used are given in Section 6.1.2.
13. https://scikit-learn.org/stable/
651You can also read