Exploring the Effects of Segmentation on Semi-structured Interview Data with Epistemic Network Analysis
←
→
Page content transcription
If your browser does not render page correctly, please read the page content below
Exploring the Effects of Segmentation
                on Semi-structured Interview Data
                 with Epistemic Network Analysis

              Szilvia Zörgő1(B)     , Zachari Swiecki2     , and A. R. Ruis3
        1 Institute of Behavioral Sciences, Semmelweis University, Budapest, Hungary
                               zorgoszilvia@gmail.com
        2 Faculty of Information Technology, Monash University, Melbourne, Australia
3 Wisconsin Center for Education Research, University of Wisconsin−Madison, Madison, USA

       Abstract. Quantitative ethnographic models are typically constructed using qual-
       itative data that has been segmented and coded. While there exist methodological
       studies that have investigated the effects of changes in coding on model features,
       the effects of segmentation have received less attention. Our aim was to exam-
       ine, using a dataset comprised of narratives from semi-structured interviews, the
       effects of different segmentation decisions on population- and individual-level
       model features via epistemic network analysis. We found that while segmentation
       choices may not affect model features overall, the effects on some individual net-
       works can be substantial. This study demonstrates a novel method for exploring
       and quantifying the impact of segmentation choices on model features.

       Keywords: Epistemic network analysis (ENA) · Semi-structured interviews ·
       Quantitative ethnography (QE) · Methodology · Data segmentation

1 Introduction

Quantitative ethnography (QE) is a nascent field aiming to unify quantitative and qual-
itative research methodologies in order to facilitate thick description at scale [1]. Most
QE studies involve coding raw qualitative data with constructs relevant to the research
question(s) and segmenting the data into meaningful parts to explore the interactions
of codes [2]. These acts are integral to modelling cognition or behavior and identifying
significant patterns. While QE researchers have begun to explore the effects of coding
and window length on model features [3–5], the effects of segmentation more broadly
have not been similarly examined. In this study, we explored how different approaches
to segmentation affect models of patient narratives constructed with Epistemic Network
Analysis (ENA), a technique for modelling the structure of connections among codes in
qualitative datasets.

© Springer Nature Switzerland AG 2021
A. R. Ruis and S. B. Lee (Eds.): ICQE 2021, CCIS 1312, pp. 78–90, 2021.
https://doi.org/10.1007/978-3-030-67788-6_6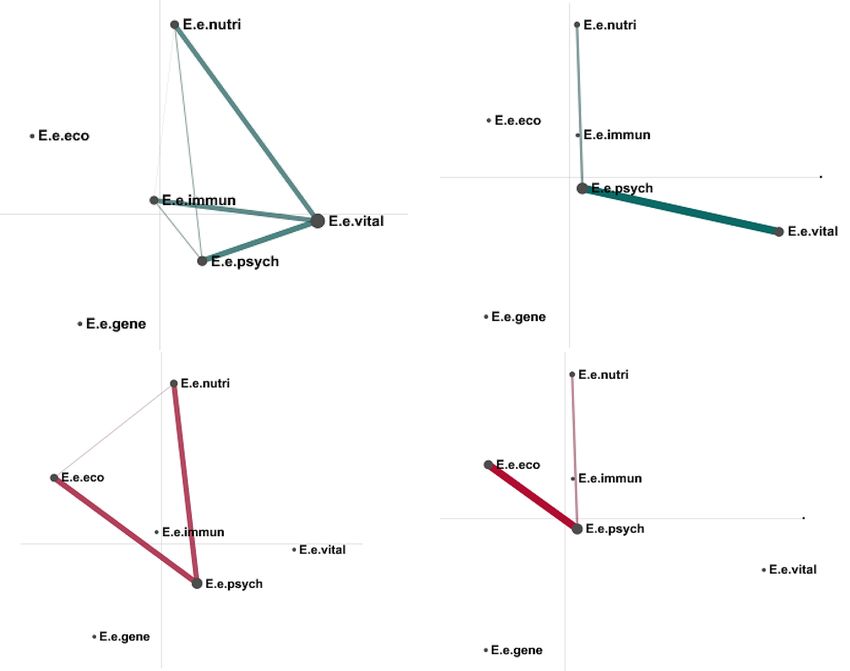
Exploring the Effects of Segmentation on Semi-structured Interview Data           79

2 Theory
Research in QE is conducted on various kinds of discourse data [2, 6], including log
files of online activity, recordings of conversations or interviews, published writing, pho-
tographs, field notes, and many others. To facilitate analyses of discourse, QE researchers
not only collect or record data that document people thinking, acting, and being in the
world, they also transform those data into a representation that makes quantification
possible.
     This transformation can involve a number of critical decisions. Transcribing video
recordings of conversations, for example, might involve: associating spoken sounds with
the appropriate word or other verbal expression; identifying which sequences of words
should be grouped into utterances; converting utterances into sentences by including
punctuation; assigning those sentences to speakers; documenting gestures, facial expres-
sions, or other visual information using consistent notation; applying time stamps; and
so on. These processes entail both reducing and standardizing audio-video data into text
data for subsequent analysis.
     One of the most critical transformation processes that researchers perform is seg-
mentation: the division of data into consistent and meaningful parts. In QE analyses,
there are two key levels of segmentation. The first involves segmentation into items or
lines (represented as rows in a qualitative data table1 ), which are the most elemental
units of data. This is the level on which codes are applied, so most researchers choose
relatively short segments, such as sentences or paragraphs in formal prose, turns of talk
in conversations, or questions and responses in structured interviews. The second level
of segmentation involves establishing relational context: groupings of items that are
linked for the purposes of interpretation. Defining the recent temporal context—some
span of items within temporal or conceptual proximity to one another—is one way of
establishing interpretive segmentation. This is the level on which interactions among
codes are considered meaningful.
     For example, many QE studies use ENA to model the structure of connections among
codes in discourse. To operationalize the relational context for each unit of analysis, ENA
uses two parameters: conversation and stanza window. Conversations define groupings
of items that can be connected in a model. For example, in a dataset that documents
the interactions of different project teams on different days, the conversations might be
defined by “Team” and “Day.” This would group items (say, turns of talk) such that each
segment contains all the items from one team’s interaction on one day. This means that
individuals can make connections only to contributions from their own team, and for a
given team, only within a single day’s interaction.
     Stanza windows define how connection structure is computed within conversations
for a given unit of analysis. There are three main types of stanza window:

• Moving stanza windows compute the connection structure of each line in a conver-
  sation relative to every line that comes before it within the window. With a moving

1 Qualitative data tables contain various kinds of data where rows and columns exhibit ontological
 consistency. Rows contain the same categories of values (data and metadata), while each column
 contains one type of information (e.g., age of participants).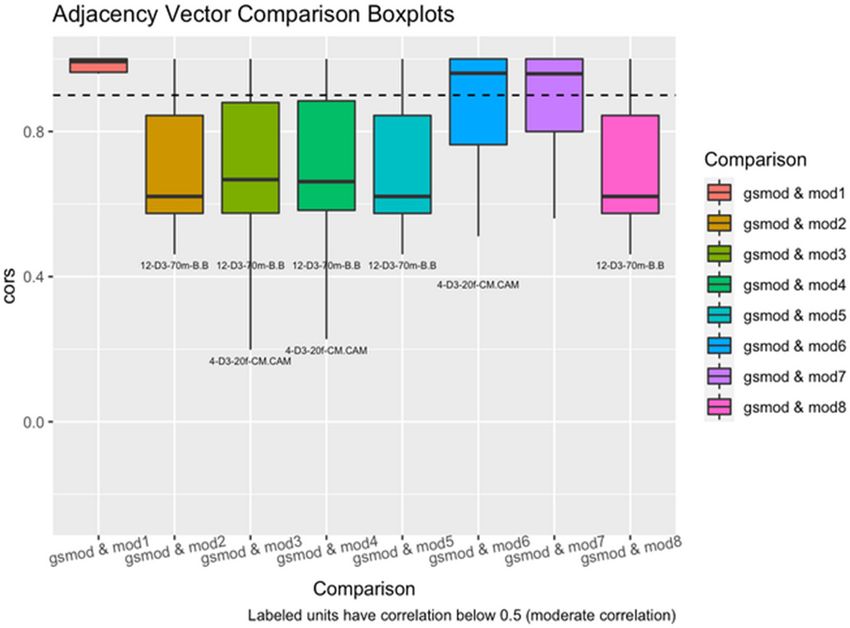
80      S. Zörgő et al.

  stanza window of length 4, for example, each line is connected to the three lines that
  precede it. The connections in each window for which a given unit contributes the
  referring line (the last line in the window) are then aggregated across all conversations,
  reflecting the connections contributed by that unit.
• Infinite stanza windows compute the connection structure of each line in a conversation
  relative to every line that comes before it within the conversation. Thus, the infinite
  stanza works in the same way as a moving stanza, but there is no limit on the number of
  previous lines that are included in the window (except for the length of the conversation
  itself).
• Whole conversation stanzas use the entire conversation as the stanza window, but only
  connect codes contributed by the same unit. The whole conversation model identifies
  whether or not a connection occurred in the unit’s lines in a given conversation, then
  aggregates connections across all conversations.

    Thus, the operationalization of relational context may have a significant impact on
resulting models of connection structure.
    Despite the importance of relational context in ENA models, relatively few studies
have examined the extent to which different choices of conversation and stanza window
affect model features. Ruis and colleagues, for example, found that for one dataset docu-
menting the interactions of engineering student project teams, statistical discrimination
between two sub-populations was fairly robust to window length once a minimum length
was reached (in their study, that minimum was four lines) [7]. However, they also found
that model features and interpretation were more sensitive to window length, and did
not stabilize until a window length of seven.
    Operationalizing relational context is also particularly challenging with some types
of data, e.g. semi-structured interviews, as alternations between interviewer speech and
interviewee speech do not necessarily denote meaningful segments for the purpose of
analysis. An interviewee may answer one question by addressing various topics relevant
to the research objectives in a single turn of talk, which may need to be segmented
and analyzed separately. While some researchers choose to parse an interview transcript
according to questions and responses when the interview is more clearly structured
[8], this may not be a viable option when the interview allows for organic digressions,
distal or implicit connections, and the interweaving of several relevant sub-topics. Yet,
because many exploratory research initiatives utilize semi-structured interviews for data
collection, this form of qualitative data is quite common. Consequently, it is important
to understand the effects of different approaches to segmentation on analyses of such
discourse.
    One approach to assessing the impact of different model parameters—in this case,
different conversation and stanza window selections—is through a sensitivity analysis.
In a sensitivity analysis, researchers examine whether alteration of one or more param-
eters invalidates a given inference [9]. In this study, we used a well-studied dataset
documenting patient decision-making regarding choice of therapy to explore the effects
of segmentation on model outputs. We then used this dataset to address two research
questions:
    RQ1: Do different segmentations produce significantly different ENA models?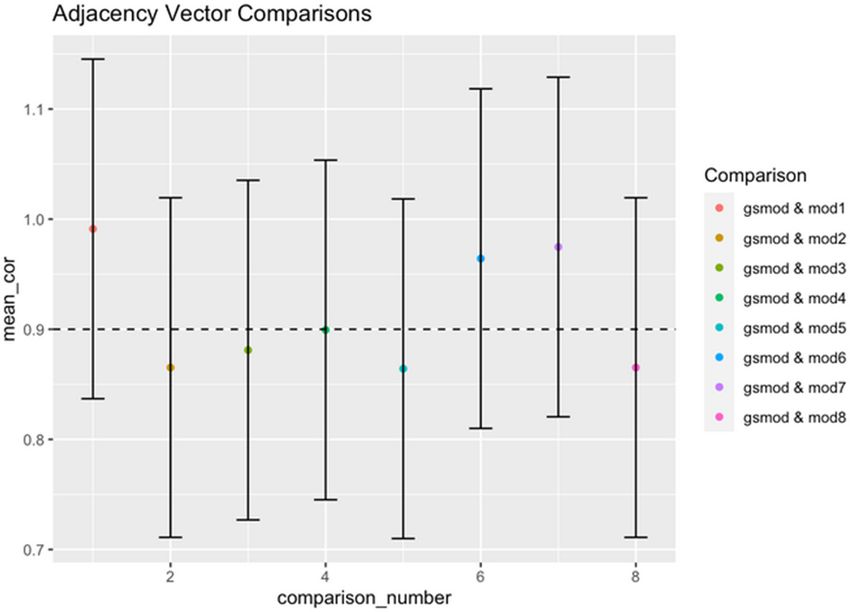
Exploring the Effects of Segmentation on Semi-structured Interview Data              81

   RQ2: Do different segmentations affect the interpretation of individual ENA
networks?

3 Empirical Data
3.1 Study Design and Data Collection
The empirical data we utilized was derived from a previous study on how patients
make decisions regarding their choice of therapy. In that project, we were interested in
why patients choose to employ biomedicine only or non-conventional medicine (i.e.,
Complementary and Alternative Medicine, CAM) either instead of or in addition to
biomedicine. The study took place in Budapest, Hungary; data was collected via semi-
structured interviews conducted with patients primarily included based on diagnosis
group (diabetes, musculoskeletal, digestive, and nervous system diseases). Interviews
covered three overarching themes: (i) trusted sources of health-related information, (ii)
lay etiology (theories of illness causation), and (iii) patient journey (decisions and experi-
ences). Interviews lasted 60 minutes on average and were sound-recorded and transcribed
verbatim. Zörgő & Peters give a full description of the study, focusing on methodologi-
cal considerations [10]. We included a total of 26 interviews in the present study; each
interview was considered a separate source of data.

3.2 Coding
Our deductive code system comprised three levels of abstraction, containing a total of
52 low-level codes. We had three clusters of codes, based on the interview structure:
Epistemology (sources of health-related information, appraisal of information; N = 16),
Ontology (concepts of illness and health; metaphors of illness and health; N = 23), and
Behavior (choices of therapy, evaluation of therapeutic efficacy; N = 13). Sentences
constituted the lowest level of segmentation (i.e., utterances); coding was performed
manually on this level. The analysis below contains the six codes from the Ontology
cluster that we used in this study; each code pertains to a lay theory of etiology (see
Table 1).

              Table 1. Codes capturing patient theories of illness causation (etiology)

Code name                  Label           Description
Psychosocial/              E.e.psych       Emotions, stress, trauma, nerves, nerve damage
Neurological
Psychosocial vitalist      E.e.vital       Energy/qi/prana, block, “law of attraction”, spiritual
                                           teleology
Ecological                 E.e.eco         Environmental toxins, chemicals, “electro-smog”
Immunological              E.e.immun       Weakness or susceptibility of immune system
Nutritional                E.e.nutri       Quality or type of food, additives, toxins in food
Genetic                    E.e.gene        Inherited illness or susceptibility, genetic causes
82 S. Zörgő et al. 4 Methods 4.1 Constants and Variables of Segmentation To explore the effects of segmentation on model features, we used two forms of conver- sation (source-based and delimiter-based) and three stanza window definitions (whole conversation, infinite stanza, and a moving stanza window of 4 lines). All other model parameters were held constant. Units were defined as individual patients, each of whom was associated with one interview (i.e., one source), and all lines were coded as described above. 4.2 Forms of Segmentation Source-Based Segmentation. For source-based segmentation, the conversation was defined as one interview transcript, and each source is uniquely associated with one patient. In this type of segmentation, all utterances within an interview were consid- ered relevant context. Source-based segmentation connotes one of the few “naturally” occurring choices for segmenting semi-structured interview data on the conversation level. Delimiter-Based Segmentation. For delimiter-based segmentation, the conversation was defined according to a coding process in which two independent raters segmented Fig. 1. Delimiter-based segmentation with the same definition of stanza (i.e., recent temporal con- text) manually performed by two independent raters. The first version (DelimiterV1) is represented by green boxes within the narrative, numbered in black (1–10). The second version (DelimiterV2) is displayed with overlaying red boxes, numbered in white (1–4). Coding is utterance-based (utter- ance = sentence); codes are depicted within the text representing three code clusters (yellow = epistemology, blue = ontology, red = behavior). (Color figure online)
Exploring the Effects of Segmentation on Semi-structured Interview Data           83

each source manually to identify shifts in topic within the patient’s narrative. This process
yielded two versions of the same type of segmentation: DelimiterV1 and DelimiterV2.
The former was performed by a research assistant with some prior knowledge of the
research topic, the latter by the principal investigator with extensive knowledge of the
topic.
    As Fig. 1 shows, although there are some instances when both versions of segmenta-
tion (DelimiterV1 and DelimiterV2) agree where a delimiter should occur in the narrative
(e.g., after green 7 and red 2), and there are times when the red delimiter is exactly the
double of the green (e.g., green 8–9 = red 3), in many cases, delimiting stanzas differ
substantially, such as red 1 ending in the middle of green 6.

4.3 Model Comparison

To compare the ENA models constructed with different segmentation parameters, we
first constructed a “gold standard” model—that is, the model that aligned best with
our qualitative understanding of the data.2 Source-based segmentation with an infinite
stanza window provided good interpretive alignment with the qualitative data. The codes
pertain to lay etiology, allowing us to model how a patient conceptualizes illness causa-
tion. Previous studies have observed that these explanatory models exhibit a high level
of intrapersonal congruence, despite the fact that an individual’s narrative may contain
references to a variety of illnesses. In other words, regardless of how many comor-
bidities a patient exhibits, from a certain analytical perspective, their theory of illness
causation will be consistent or integrated to include all experienced phenomena. Thus,
to examine an explanatory model that encompasses the illness with which we included
the patient into the study and its comorbidities as well, we chose a segmentation where
each individual’s narrative is considered a separate, bounded entity within which codes
may co-occur, and we regarded every utterance from an individual as closely connected.
Code co-occurrences within aggregated interview narratives and mean networks were
produced for the two main groups in the study: users of biomedicine and users of CAM.
     Following the approach described in [11], we compared each patient’s gold stan-
dard ENA model to their corresponding model under eight combinations of conversa-
tion/stanza window by computing the pairwise correlations (Pearson’s r) between the
normalized adjacency vectors (i.e., the vectors representing the normalized connection
strengths between each unique pair of codes) of each unit. A high-magnitude correlation
between normalized adjacency vectors suggests that the structure of connections asso-
ciated with each unit was similar in both models. A low-magnitude correlation between

2 The method we describe below can be used to compare any two ENA models that use the
 same units and codes, and thus does not require a gold standard model. We chose to use one
 here to reduce the number of comparisons made and simplify the presentation of the results.
 In many cases it may be difficult to justify a gold standard model. However, if one is justified,
 an alternate approach is to project all other models into the metric space produced by the gold
 standard model. Such an approach has the advantage of comparing units of analysis along fewer
 dimensions, rather than making comparisons in a high-dimensional space. We applied both
 approaches to these data and our results were consistent between them. Here we present only
 the high-dimensional comparisons to demonstrate the most general approach.
84 S. Zörgő et al.
Table 2. The nine models created to test the effects of segmentation on network structure
normalized adjacency vectors suggests that the models produced different connection
structures.
Prior to computing the correlations, individuals with no connections in one of the
two models compared in a given correlation were excluded. This situation was relatively
rare—only six patients had no connections under one or more of their models.
To evaluate how the networks changed overall for a given comparison, we averaged
the correlations. Prior to averaging, we transformed the correlations using Fischer’s Z
transformation, which allows for meaningful averages of correlation coefficients and the
calculation of confidence intervals. To test for significant differences between models,
we tested whether the average correlation between models was significantly different
from a high correlation value (0.90) using the 95% confidence intervals.
To inspect individual differences, we constructed boxplots of the (untransformed)
correlation values. This enabled us to explore the extent to which individual networks
might change substantially even if the average correlation between two models is high.
Finally, to explore model differences due to segmentation in more detail, we com-
pared ENA network graphs from the gold standard model to network graphs from the
other models for individuals whose vectors were substantially different. In these net-
work graphs, the nodes correspond to the codes in the analysis, and the edges reflect the
relative frequency of co-occurrence between codes. Thicker and more saturated edges
indicate higher relative co-occurrence.
5 Results
Figure 2 shows the pairwise correlations between the eight models generated with
differing segmentation parameters (mod1-8) and the gold standard model (gsmod).
All of the models generated with different segmentations (i.e., different combinations
of conversation and stanza window) are highly correlated with the gold standard model
(gsmod). That is, for no model is the upper bound of the 95% confidence interval below
the critical value of 0.90. Furthermore, no model’s confidence interval had a lower boundExploring the Effects of Segmentation on Semi-structured Interview Data 85
Fig. 2. Mean pairwise correlations (Pearson’s r) between the normalized adjacency vectors of
models created with different types of segmentation (mod1–8) and the gold standard model
(gsmod). The upper bounds of the 95% confidence intervals for all comparisons are above the
critical value of 0.90, suggesting that the models are highly correlated with the gold standard.
less than 0.70, indicating that all models were highly correlated with the gold standard
model.
While there are no statistically significant differences between the adjacency vectors
of the gold standard model and the other models, some comparisons show that certain
individuals changed substantially (see Fig. 3). In particular, 97 comparisons yielded
correlations below 0.90, and some are as low as 0.20. This suggests that while the
models as a whole are highly correlated, some individuals have very different networks
under models constructed with different segmentations.
To explore the extent to which interpretation of patient networks changed due to
segmentation, we chose two examples: Patient 25 and Patient 16. Source 25 is the
interview transcript of a patient in the CAM group, a female in her twenties, suffering
from Crohn’s disease and ulcerative colitis; she was diagnosed at the age of 14. Source
16 is the interview transcript of a patient in the biomedicine group, also a female in
her twenties, suffering from type 1 diabetes; she was diagnosed at the age of 2. Both
patients require biomedical treatment, but Patient 25 employs complementary therapies
as well. Both Crohn’s disease and type 1 diabetes are chronic conditions, and in the
current biomedical understanding, their causes are unknown. In instances of chronic
conditions of unknown origin, lay explanatory models of illness may play an even more
significant role in patient decision-making regarding choice of therapy. This was also
why these specific patients were selected for closer scrutiny. The source-based moving
stanza model of Source 25 exhibited one of the most substantial changes compared to
the gold standard, while Source 16’s same two models remained very similar.86 S. Zörgő et al.
Fig. 3. Box plots showing the distribution of pairwise correlations for each model comparison.
Although mean pairwise correlations between models were uniformly high, many individual
pairwise correlations were substantially lower.
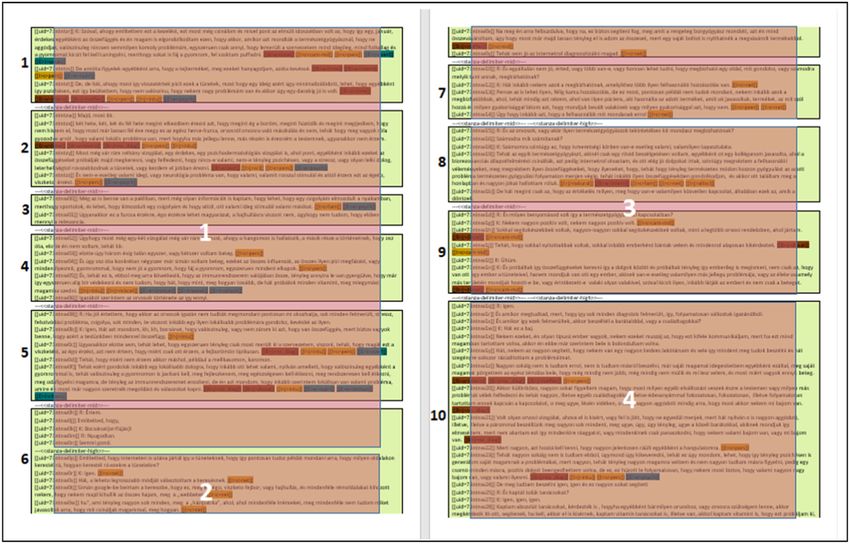
The graphs in Fig. 4 compare the co-occurrence of etiology codes within the nar-
ratives of the two individuals. Both network models were generated with source-based
segmentation, the graphs on the left with an infinite stanza window (gold standard), the
ones on the right with a moving stanza window of 4 utterances. While the basic structure
of the biomedical patient’s network (bottom models in red) stays consistent in the two
versions of segmentation (and all other types of models in our study), the CAM indi-
vidual’s network exhibits substantial differences. In both versions of segmentation, the
biomedical patient makes connections among psychological, ecological, and nutritional
factors within their theory of illness causation. The CAM patient, on the other hand,
makes connections among psychological, vitalist, immunological, and nutritional fac-
tors in the infinite stanza version of the model, but only a fraction of these remain in the
moving stanza version: the connection among psychological, vitalist, and nutritional fac-
tors remains (with different edge weights), but the connection to immunological factors
disappears, as well as the connection between codes Vital and Nutri.
The first third of Patient 16’s discourse does not contain any etiology codes, these
only appear in the remainder of the interview; Patient 25’s narrative, in contrast, contains
etiology codes in the first and second third only. The average distance between two
etiology codes in Source 16 is much less than in Source 25 (once every 7.6 lines and
once every 40.8 lines, respectively). Compared to the entire length of the interview, the
number of utterances spanning the first and last coded utterance is proportionally similar
in the two patients’ discourse (Source 16: 88 out of 371 utterances, which is 23.7% of
the total number of utterances; Source 25: 451 out of 2126 utterances, which is 21.2%
of the total number of utterances). Thus, etiology codes spanned about the same lengthExploring the Effects of Segmentation on Semi-structured Interview Data 87
Fig. 4. The network models of two patients in two different model comparisons. Unit 25 (top,
teal) is an individual in the CAM group, while Unit 16 (bottom, red) belongs to the biomedicine
group. The networks were generated using an interview transcript (source) as conversation, and the
stanza window was defined as infinite stanza (left) and moving stanza (right). The former is how
we defined the gold standard model. The figure illustrates the extent to which a network structure
can change with segmentation (Source 25) or remain roughly similar (Source 16), compared to
the gold standard. (Color figure online)
in both interviews proportionally, yet there were marked differences in the position of
these codes within the interview and relative to each other. These features may explain
a unit’s sensitivity to changes in model parameters.
Our employed R scripts, disclosed results, and extra visualizations can be openly
accessed at our Gitlab repository: https://gitlab.com/szilvia/icqe20-segmentation.
6 Discussion
We compared the normalized adjacency vectors of units in eight different ENA models
to our gold standard in order to assess the extent to which varying segmentation affects
overall network structure. As our results show, different segmentation choices did not
produce models with significantly different features in aggregate, but for some individ-
uals, there were substantial differences in their ENA networks under models produced
with different segmentations.88 S. Zörgő et al.
These differences in unit sensitivity to changing model parameters may be caused
by several factors. Apart from their frequency, the location of codes within the discourse
seems to be an influencing factor; codes appearing earlier in an interview, for exam-
ple, might increase the unit’s sensitivity to varying segmentation. Another potentially
important factor is code proximity, as relationships between codes in close proximity
may look similar in infinite and fixed window models, but more distal codes are less
likely to be connected in fixed window models. Further research is needed to more fully
understand the factors that contribute to a unit’s sensitivity to varying model parameters
and to understand what segmentation choices are most appropriate for different kinds of
data and research questions.
The source-based infinite stanza and whole conversation models capture the broadest
range of possible connections, while the delimiter-based models and source-based model
with a moving stanza window of 4 lines capture code co-occurrences taking place in
more recent temporal context. Yet, distance between codes (varying number of utterances
between two codes) may or may not reflect cognitive proximity in a semi-structured
interview. In our specific example, an interviewee may talk about one illness at the
beginning of a narrative that may receive a set of etiology codes, then go on to talk about
a comorbidity with another set of etiology codes, and alternate between these throughout
the interview. This situation could indeed lead to a larger distance between two etiology
codes, but there is a latent variable affecting that distance: the illness to which the
codes refer. Thus, it may be beneficial to segment a narrative based on an underlying
variable, such as illness in this particular case, and examine the relationship among
codes vis-a-vis this type of segmentation. Naturally, other clusters of codes (pertaining
to other phenomena or research questions) may be influenced by a different variable. For
example, our study also worked with a cluster of codes relating to the patient’s trusted
sources of information; this cluster may be less meaningful in an illness-based narrative
structure and more adequately understood with a discourse segmentation determined by
stages in a patient journey (e.g., before diagnosis/after diagnosis or according to various
employed treatments).
From a pragmatic point of view, one could assert that each of our nine models (gold
standard plus comparisons), highlights a different aspect of our data. In the source-based
segmentation, the whole conversation model (mod 1) showed us all possible connections
among all codes in the given source, but only whether they occurred or not, while the
infinite stanza model (gsmod) provided insights into the relative frequency of those con-
nections. Finally, the source-based moving stanza window of 4 model (mod 2) indicated
which of those weighted connections were among codes that are spatially/temporally
closer to each other within the interview. The delimiter-based models depicted the same
basic principles, but within segments of narrative that were manually determined to be
closely connected (according to a certain definition of stanza: i.e., topic of discussion).
Depending on the analytical goal, all of these models are potentially useful. The method
we present here for comparing models with different segmentation parameters allows
researchers to assess whether and to what extent any two models are significantly differ-
ent, but it does not indicate which model is better. That decision remains one that must
be based on the research questions being asked and deep qualitative engagement with
the data and the context in which they were collected.Exploring the Effects of Segmentation on Semi-structured Interview Data 89
Even if segmentation has little effect on model features overall, this study suggests
that individual networks may vary substantially under different segmentation parameters,
and thus other factors may be important when defining the conversation and stanza
window. For example, the (relative) frequency of codes can have a significant impact
on model features, as whole conversation models are sensitive only to the presence or
absence of a code in the conversation, while infinite stanza windows are also sensitive to
how often codes occur and where in the conversation they appear. Additional studies are
needed to explore the relationship between segmentation and the (relative) frequency
and distribution of codes.
7 Limitations
Our study had several limitations. First, to reduce the number of comparisons for simplic-
ity of presentation, we selected a gold standard model (source-based, infinite stanza), yet
in reality, such “gold standards” do not exist for a given dataset, much less for datasets in
general. The method we present here does not require a gold standard—it can be used to
compare any two models with the same units and codes, and thus has significant advan-
tages over projecting one model into the metric space defined by another model—but
all comparisons are still pairwise, and thus there are a large number of possible compar-
isons. In addition, the lowest correlations do not necessarily reflect networks with the
most significant differences (for any two models), as the overall structure of connections
could be similar even if all the edge weights are different. Many small changes to the
line weights could result in a poorer correlation than one large change (e.g., a connection
present in one model and not present in another), but the impact on interpretation may
be greater in the latter case. Furthermore, correlating the normalized adjacency vectors
is merely one way to compare network structures; other modes of comparison, such as
correlating the eigenvectors, might yield different results. Lastly, as discussed above, the
frequency of code occurrence may be a significant factor, particularly if code frequen-
cies are low, as many were in this dataset. Further research is needed on the effects of
segmentation on datasets with different frequencies and distributions of codes.
8 Closing Remarks
Our study aimed to investigate the effects of different segmentation parameters on model
features, and in particular to explore whether and to what extent different conversation
and stanza definitions changed network structure or interpretation. We present a method
that can be used to compare any two models with the same units and codes, which can
guide model parameterization, but this study also shows that more research is needed to
address several key questions: Under what conditions will the choice of segmentation
start to have large effects? How do these effects occur? and What influences their mag-
nitude? We believe that inquiry in this domain can aid the construction of more accurate
(network) models of qualitative data, which in turn, will facilitate our understanding of
human cognition and behavior.90 S. Zörgő et al.
Acknowledgements. The authors are grateful to collaborator GJY Peters and to research assis-
tants Anna Geröly, Anna Jeney, and Krisztina Veres for their rigorous work in the project that
provided our empirical data. This work was funded in part by the National Science Founda-
tion (DRL-1661036, DRL-1713110), the Wisconsin Alumni Research Foundation, and the Office
of the Vice Chancellor for Research and Graduate Education at the University of Wisconsin-
Madison. The opinions, findings, and conclusions do not reflect the views of the funding agencies,
cooperating institutions, or other individuals.
References
1. Williamson Shaffer, D.: Big data for thick description of deep learning. In: Millis, K., Long,
D., Magliano, J., Wiemer, K. (eds.) Deep Comprehension: Multi-Disciplinary Approaches to
Understanding, Enhancing, and Measuring Comprehension, pp. 262–275, 1st ed. Routledge
(2018)
2. Williamson Shaffer, D.: Quantitative Ethnography. Cathcart Press, Madison
3. Cai, Z., Siebert-Evenstone, A., Eagan, B., Shaffer, D.W., Hu, X., Graesser, A.C.: nCoder+:
a semantic tool for improving recall of nCoder coding. In: Eagan, B., Misfeldt, M., Siebert-
Evenstone, A. (eds.) ICQE 2019. CCIS, vol. 1112, pp. 41–54. Springer, Cham (2019). https://
doi.org/10.1007/978-3-030-33232-7_4
4. Bakharia, A.: On the equivalence of inductive content analysis and topic modeling. In: Eagan,
B., Misfeldt, M., Siebert-Evenstone, A. (eds.) ICQE 2019. CCIS, vol. 1112, pp. 291–298.
Springer, Cham (2019). https://doi.org/10.1007/978-3-030-33232-7_25
5. Eagan, B., Swiecki, Z., Farrell, C., Williamson Shaffer, D.: The binary replicate test: deter-
mining the sensitivity of CSCL models to coding error. In: Wide Lens: Combining Embod-
ied, Enactive, Extended, and Embedded Learning in Collaborative Settings, pp. 328–335.
International Society of the Learning Sciences, Lyon, France (2019)
6. Gee, J.: An Introduction to Discourse Analysis: Theory and Method. Routledge, London
(2014)
7. Ruis, A.R., Siebert-Evenstone, A.L., Pozen, R., Eagan, B.R., Williamson Shaffer, D.: Finding
common ground: a method for measuring recent temporal context in analyses of complex,
collaborative thinking. In: A Wide Lens: Combining Embodied, Enactive, Extended, and
Embedded Learning in Collaborative Settings. International Society of the Learning Sciences,
Lyon, France, pp. 136–143 (2019)
8. Wooldridge, A.R., Haefli, R.: Using epistemic network analysis to explore outcomes of care
transitions. In: Eagan, B., Misfeldt, M., Siebert-Evenstone, A. (eds.) ICQE 2019. CCIS, vol.
1112, pp. 245–256. Springer, Cham (2019). https://doi.org/10.1007/978-3-030-33232-7_21
9. Frank, K., Min, K.: Indices of Robustness for Sample Representation. Sociol. Methodol. 37,
349–392 (2007)
10. Zörgő, S., Peters, G.: Epistemic network analysis for semi-structured interviews and other
continuous narratives: challenges and insights. In: Eagan, B., Misfeldt, M., Siebert-Evenstone,
A. (eds.) Advances in Quantitative Ethnography, pp. 267-277. Springer, Cham (2019). https://
doi.org/10.1007/978-3-030-33232-7_23
11. Swiecki, Z.: Modeling interdependence in collaborative problem-solving. Doctoral disserta-
tion, University of Wisconsin–Madison (2020)You can also read