EWS splicing regulation contributes to balancing Foxp1isoforms required for neuronal differentiation
←
→
Page content transcription
If your browser does not render page correctly, please read the page content below

3362–3378 Nucleic Acids Research, 2022, Vol. 50, No. 6                                                                 Published online 7 March 2022
https://doi.org/10.1093/nar/gkac154

EWS splicing regulation contributes to balancing
Foxp1 isoforms required for neuronal differentiation
Veronica Verdile1,2 , Francesca Svetoni2 , Piergiorgio La Rosa2 , Gabriele Ferrante2 ,
Eleonora Cesari3 , Claudio Sette 3,4 and Maria Paola Paronetto 1,2,*
1
 Department of Movement, Human and Health Sciences, University of Rome “Foro Italico”, Piazza Lauro de Bosis 6,
00135 Rome, Italy, 2 Laboratory of Molecular and Cellular Neurobiology, Fondazione Santa Lucia, Via del Fosso di
Fiorano, 64, 00143 Rome, Italy, 3 GSTEP-Organoids Core Facility, IRCCS Fondazione Policlinico Agostino Gemelli,
00168 Rome, Italy and 4 Department of Neuroscience, Section of Human Anatomy, Catholic University of the Sacred
Hearth, 00168 Rome, Italy

                                                                                                                                                                  Downloaded from https://academic.oup.com/nar/article/50/6/3362/6543543 by guest on 06 July 2022
Received July 26, 2021; Revised January 27, 2022; Editorial Decision February 16, 2022; Accepted February 23, 2022

ABSTRACT                                                                          proteins regulate multiple steps of RNA metabolism and
                                                                                  are involved in several biological and pathological processes
Alternative splicing is a key regulatory process un-                              (1–3).
derlying the amplification of genomic information                                    The EWSR1 gene is famous for its involvement in the
and the expansion of proteomic diversity, particu-                                characteristic chromosomal translocations leading to Ew-
larly in brain. Here, we identify the Ewing sarcoma                               ing Sarcoma malignancies, tumors of bone and soft tissues
protein (EWS) as a new player of alternative splicing                             that mainly affect children and adolescents (4,5). In most
regulation during neuronal differentiation. Knock-                                cases, the chromosomal translocations generate in-frame
down of EWS in neuronal progenitor cells leads to                                 fusions between the amino terminus of EWS and the car-
premature differentiation. Transcriptome profiling of                             boxyl terminus of various ETS transcription factors, gen-
EWS-depleted cells revealed global changes in splic-                              erating an oncogenic transcription factor that drives neo-
ing regulation. Bioinformatic analyses and biochem-                               plastic transformation (4,6). More recently, EWSR1 muta-
                                                                                  tions have been identified in Amyotrophic Lateral Sclerosis
ical experiments demonstrated that EWS regulates
                                                                                  (ALS) patients (7). The ALS-associated mutations involve
alternative exons in a position-dependent fashion.                                the RGG domain and the nuclear localization signal (NLS)
Notably, several EWS-regulated splicing events are                                of EWS, leading to mislocalization of the protein from the
physiologically modulated during neuronal differen-                               nucleus to the cytoplasm and impairing its nuclear activity
tiation and EWS depletion in neuronal precursors                                  (7,8).
anticipates the splicing-pattern of mature neurons.                                  Knockout of the Ewsr1 gene in the mouse leads to high
Among other targets, we found that EWS controls the                               (∼90%) postnatal lethality prior to weaning and the few
alternative splicing of the forkhead family transcrip-                            surviving Ewsr1–/– mice are infertile due to impaired germ
tion factor FOXP1, a pivotal transcriptional regulator                            cell differentiation in both sexes (9). Loss of Ewsr1 function
of neuronal differentiation, possibly contributing to                             also leads to premature symptoms of aging, and defects in
the switch of gene expression underlying the neu-                                 B lymphocytes (9,10) and dermal development (11). More
                                                                                  recently, Ewsr1–/– mice were reported to display defects in
ronal differentiation program.
                                                                                  neuronal morphology and impairment of the dopaminer-
                                                                                  gic signaling pathway, followed by motor dysfunction (12).
INTRODUCTION                                                                      However, the specific role played by EWS in the brain
                                                                                  has not been investigated yet. Notably, EWS expression is
The Ewing Sarcoma protein (EWS) is a DNA/RNA bind-
                                                                                  fine-tuned at post-transcriptional level by miR-141 during
ing protein of the FET family, which also comprises FUS
                                                                                  mouse brain development and neuronal differentiation in
(Fused in Liposarcoma) and TAF15 (TATA-box binding pro-
                                                                                  culture (13). Moreover, a brain-specific isoform of EWS
tein Associated Factor 15) (1). FET proteins are character-
                                                                                  including a 18 bp-exon is expressed from embryonic day
ized by a serine–tyrosine–glycine–glutamine (SYGQ)-rich
                                                                                  11.5 (E11.5) to birth, paralleling the decrease of the main
domain at the N-terminus, acting as a transcriptional acti-
                                                                                  isoform (14), whereas expression of both isoforms declines
vation domain, a central RNA recognition motif (RRM),
                                                                                  steadily after birth (14). While these observations suggest
and three glycine–arginine (RGG) rich regions at the C-
                                                                                  that EWS function needs to be modulated during brain
terminus, which affect the RNA binding affinity (2,3). These

* To   whom correspondence should be addressed. Tel. +39 0636733576; Email: mariapaola.paronetto@uniroma4.it

C The Author(s) 2022. Published by Oxford University Press on behalf of Nucleic Acids Research.
This is an Open Access article distributed under the terms of the Creative Commons Attribution-NonCommercial License
(http://creativecommons.org/licenses/by-nc/4.0/), which permits non-commercial re-use, distribution, and reproduction in any medium, provided the original work
is properly cited. For commercial re-use, please contact journals.permissions@oup.com
Nucleic Acids Research, 2022, Vol. 50, No. 6 3363
development, the specific role played by this protein dur- meninges removal, embryonic cortices were isolated, me-
ing neuronal differentiation is currently unknown. One of chanically disaggregated and centrifugated, the pellet was
the best characterized functions of EWS is the regulation resuspended in neurosphere medium consisting of DMEM-
of alternative splicing (AS). In particular, EWS was shown F12 (1:1) with GlutaMAX™, B27 (1 ml/50 ml,Thermo
to directly interact with the RNA Polymerase II (2) and the Fisher Scientific), penicillin (100 U/ml), streptomycin
U1 snRNP component of the spliceosome (15–18) and to (100 mg/ml) and supplemented with epidermal growth
modulate selected splicing events in human cells. However, factor (EGF, 20 ng/ml, Peprotech, United Kingdom) basic
whether or not EWS modulates the transcriptome of neu- fibroblast growth factor (bFGF, 20 ng/ml, Peprotech) and
rons though splicing regulation during development has not heparin (0.5 U/ml, Sigma-Aldrich). The cells were incu-
been investigated to date. bated in a humidified atmosphere with 6% CO2 at 37◦ C.
AS is combinatorial process through which exons are dif- For clonal analysis, 2500 NPCs were plated in 35-mm wells.
ferentially assorted in the mature transcript (19–21), thus After 5 days of culture in proliferating conditions, neuro-
generating multiple transcript variants from each gene and sphere number was evaluated and NPC clonogenicity was
amplifying the genome and proteome complexity of or- calculated as ratio between plated cells and neurospheres
Downloaded from https://academic.oup.com/nar/article/50/6/3362/6543543 by guest on 06 July 2022
ganisms (22–25). While employed by all cells and tissues, formed, expressed as percentage. For the differentiation
AS regulation plays a particularly critical role in the mam- studies, dishes were coated with poly-ornithine (Sigma-
malian brain (26,27). Indeed, high-throughput transcrip- Aldrich) in H2 O, and with laminin-1 (Sigma-Aldrich) in
tome analyses revealed that brain displays the most com- PBS for 1 h each at 37 ◦ C. After three washes in PBS, cells
plex and dynamic AS network, leading to expression of were plated in neurosphere medium containing 1% FBS
neuron-specific protein isoforms (27–29). AS regulation af- and incubated in a humified atmosphere with 6% CO2 at
fects all key biological processes involved in neuronal func- 37◦ C for 3 days.
tions, such as differentiation and migration, axon guid-
ance, synapse formation and membrane physiology. In this Neural progenitor cells transfection
way, this process crucially contributes to the establish-
For transfection, NPCs were electroporated using AMAXA
ment and/or maintenance of the functional complexity of
nucleoflector device II and AMAXA mouse NPC nucle-
the brain (26–27,30). Transcript diversification via AS is
oflector kit (Lonza, Switzerland), following manufacturer
achieved through the coordinated activity of RNA-binding
instructions. Briefly, 5 × 10⁶ NPCs were centrifuged and re-
proteins (RBPs), that bind pre-mRNA and alter spliceo-
suspended in 100 l of P3 primary solution with 300 nM of
some assembly and splice site choice (19,31). Fine-tuned
sictrl or siEwsr1. Electroporated NPCs were resuspended in
modulation of the expression, localization and activity of
500 l of pre-warmed medium, centrifuged at 1300 rpm for
specific RBPs orchestrates the temporal patterns of cell and
5 min at room temperature and resuspended in NPC prolif-
tissue-specific splice variants (20).For instance, changes in
eration medium.
expression of specific RBPs during the transition from neu-
ral progenitor cells to differentiated neurons was shown to
Cell cultures and transfections
modulate specific splicing networks that impact on key de-
velopmental processes in the brain (32–34). Mouse N2A cells (ATCC) and human SHSY5Y (ATCC)
In this study, we found that depletion of EWS by RNA were maintained in Dulbecco’s modified Eagle’s medium
interference promotes neuronal differentiation and neuron (DMEM, GIBCO––Thermo Fisher Scientific, Waltham,
complexity in both neural progenitor cells (NPCs) and N2A MA, USA) with GlutaMAX™, supplemented with 10% fe-
neuron-like cells. Transcriptome analysis of EWS-depleted tal bovine serum (FBS), penicillin (100 U/ml) and strep-
N2A cells identified hundreds of genes regulated by this tomycin (100 mg/ml) (all from GIBCO). For differentia-
RBP at splicing levels. Notably, splicing of several of these tion studies, N2A cells were plated in DMEM with Glu-
genes was also modulated during neuronal differentiation taMAX™, supplemented with 0.5% FBS, penicillin (100
and EWS depletion promoted a splicing pattern similar to U/ml) and streptomycin (100 mg/ml) for 6 days. Trans-
that of mature neurons. Furthermore, we demonstrated that fection of N2A and SHSY5Y cell lines was performed us-
EWS directly binds the pre-mRNAs of the regulated tar- ing RNAimax reagent (Thermo Fisher Scientific) according
gets, including Foxp1, to promote splicing switches related to manufacter’s instructions. Briefly, 50 000 cells were sub-
to neuronal differentiation. These findings uncover a new jected to double pulse of reverse-transfection by using 2 l
role for EWS in the developmental splicing switch occur- of Lipofectamine RNAiMAX, and cells were collected 24
ring in neuronal cells and highlights an unprecedented link h after the last pulse of transfection. N2A cells were trans-
between EWS, Foxp1 and neuronal differentiation. fected with control siRNA and siRNA for Ewsr1 and Foxp1
(Sigma-Aldrich, St Louis, MO, USA) at the final concentra-
MATERIALS AND METHODS tion of 25 nM. SHSY5Y cells were transfected with control
siRNA and siRNA for EWSR1 at the final concentration of
Neural progenitor cells isolation and culture
25 nM (Santa Cruz Biotechnology). siRNA sequences are
Neural progenitor cells (NPCs) were isolated from reported in Supplementary Table S3.
C57/BL6 (Charles River Laboratories, Sulzfeld, Germany) For Antisense oligonucleotide (ASO) activity assays,
embryonic mouse cortex at embryonic day 13.5 (E13.5), transfection of N2A cell line was performed according to
following the Institutional guidelines of the Fondazione manufacturer’s instructions. Briefly, 50,000 N2A cells were
Santa Lucia and the approval of the local Ethical Com- seeded in 6-well plates and transfected with ASOs at the fi-
mittee. After olfactory bulbs, ganglionic eminences and nal concentration of 5, 10 or 20 M. Cells were collected
3364 Nucleic Acids Research, 2022, Vol. 50, No. 6
24h or 48h after transfection for RNA or protein extraction. previously (36). N2A cells were seeded in 12-well plates at
ASOs were designed and synthesized by Gene Tools (Ore- a density of 50 000/well and transfected with either ASOs,
gon, USA) to target either Foxp1 exon 16 5 splice site (ASO as described above. Plates were scanned every 6 h using a
5 SS), or EWS binding sites in the intron 16 of Foxp1 pre- 10× objective. Twenty-five images per well were captured
mRNA (ASO FOXP1), in the intron 7 of Ptbp1 pre-mRNA and images were analyzed for neurite length and branch
(ASO PTBP1), in the intron 1A of HnrnpA3 pre-mRNA, or points. The masks/filters adjustment for Neurotrack phase
a Standard Control Oligo (ASO ctrl). All ASOs were diluted contrast image analysis was as follows: segmentation mode:
with enzyme-free water to the final concentration of 1 mM texture; hole fill: 0; adjust size: −2 pixels; minimum cell
and stored at room temperature. The sequences of ASOs are width: 7 m; neurite filtering: best; neurite sensitivity: 0.3
listed in Supplementary Table S3. m; and neurite width: 2 m, detailed in (NeuroTrack™,
2020). The following parameters were quantified: neurite
length (NL) = sum of lengths of all neurites pooled/ area
Immunofluorescence analysis
of image field; neurite branch points (NBP) = total number
N2A cells were fixed for 20 min with 4% paraformaldehyde of branch points/area of image field.
Downloaded from https://academic.oup.com/nar/article/50/6/3362/6543543 by guest on 06 July 2022
(PFA, Sigma-Aldrich) in PBS, washed in PBS three times
(one fast, two for 5 min). Cells after were permeabilized with RNA extraction, gene expression and splicing assay analyses
0.2% Triton X-100 in PBS for 10 min, were incubated with
Total RNA was isolated by using TRIzol Reagent (Thermo
5% Bovine Serum Albumine (BSA) in PBS for 1 h at room
Fisher Scientific) according to the manufacturer’s instruc-
temperature. After PBS washes, cells were incubated for
tions. RNA was subjected to DNAse digestion (Qiagen) and
2 h with primary antibody mouse anti--III-tubulin (1:400,
the first-strand cDNA was obtained from 1 g of RNA
T8578, Sigma-Aldrich). Cells, after three washes in PBS,
using random primers and M-MLV Reverse Transcrip-
were incubated for 1 hour with Cy2-conjugated goat anti-
tase (Promega, Madison, WI, USA), following the man-
mouse IgG (1:500, Alexa, Life Technologies). NPCs were
ufacturer’s instructions. Synthesized cDNA was used for
fixed for 20 min with 4% PFA in PBS, washed in PBS three
conventional-PCR (GoTaq G2, Promega) and quantitative-
times (one fast, two for 5 min). Cells after were perme-
PCR (SYBR Green Master Mix for Light-Cycler 480,
abilized with 1% BSA 0.1% Triton X-100 for 5 min and
Roche, Basel, Germany), according to manufacturer’s in-
the primary antibodies were incubated for 2 hours at room
structions. For splicing assay experiments, conventional
temperature with mouse anti--III-tubulin (1:400, T8578,
PCR analysis was performed after 35 cycles. The ratio be-
Sigma-Aldrich). After PBS washes, cells were incubated for
tween isoforms related to included and skipped exons was
1 hour with Cy2-conjugated goat anti-mouse IgG (1:500,
calculated from densitometric analysis by ImageJ software.
Alexa, Life Technologies). Cell nuclei were stained by 4 -
Primers used for qPCR and PCR analyses are listed in
6-diamidino-2-phenylindole (DAPI). SHSY5Y cells were
Supplementary Table S4. The comparative cycle threshold
fixed for 20 min with 4% paraformaldehyde (PFA, Sigma-
(Ct) method was used to analyze the absolute expression
Aldrich) in PBS, washed in PBS three times (one fast, two
levels using Tbp and L34 as control.
for 5 min). Cells after were permeabilized with 0.2% Triton
X-100 in PBS for 10 min, were incubated with 5% bovine
Protein extraction and western blot analyses
serum albumine (BSA) in PBS for 1 h at room temperature.
After PBS washes, cells were incubated for 2 h with Alexa Proteins were extracted by using RIPA lysis buffer [(100
Fluor™ 594 Phalloidin (1:300, A12381, Life Technologies). mM NaCl, 10 mM MgCl2 , 30 mM Tris–HCl pH 7.5,
Cell nuclei were stained by 4 -6-diamidino-2-phenylindole 10% glycerol) (Sigma-Aldrich)] supplemented with protease
(DAPI). inhibitors [(10 mM NaF, 0.5 mM Na3VO4, 10 mM -
Samples were then viewed and photographed by us- glycerophosphate and proteases inhibitors cocktail (Sigma-
ing confocal laser-scanning microscope (Zeiss, LSM700, Aldrich)]. The extracts were incubated on ice for 10 min
Germany). Data are represented as percentage of positive and then centrifuged for 10 min at 13 000 rpm at 4◦ C. Pro-
cells/total cells (evaluated by the number of total nuclei). tein quantification was performed by using the Quick Start
Neurite length was calculated with the ImageJ software, as Bradford Protein Assay (Bio-Rad). The extracts were di-
previously described (35). Briefly, analysis was based on cell luted in Laemmli buffer and boiled for 5 min. Extracted
images acquired with confocal laser-scanning microscope proteins (10–30 g) were separated on 10% SDS-PAGE
(Zeiss, LSM700, Germany), followed by manual tracing of gels and transferred to polyvinyl difluoride (PVDF) mem-
neurite length using neurite tracer and counter plugins in branes (Amersham, United Kingdom). Membranes were
the ImageJ software. Images of three fields per well were saturated with 5% non-fat dry milk in phosphate-buffered
taken and the neurite length was calculated from the base saline (PBS) containing 0.1% Tween-20 for 1 h at room
of the soma to the end of the neurite. Data were obtained temperature and incubated with the following antibodies
from three independent experiments. overnight at 4 ◦ C: mouse anti-GAPDH (1:1000, SC-32233,
Santa Cruz Biotechnology Inc, Dallas, TX, USA), rabbit
anti-EWS (1:1000, (18), mouse anti--ACTIN (1:1000, SC-
Live cell imaging using the IncuCyte neurite analysis
47778, Santa Cruz Biotechnology Inc, Dallas, TX, USA),
The IncuCyte ZOOM Live-cell imaging system (Essen Bio- and rabbit anti-FOXP1 (1:1000, A-302-620A, Bethyl Lab-
Science, UK) was used to analyze neurite dynamics. Dif- oratories Inc, Montgomery, AL, USA). Secondary anti-
ferent parameters were quantified over time using an auto- mouse or anti-rabbit IgGs conjugated to horseradish per-
mated IncuCyte® Neurotrack software module, as detailed oxidase (Amersham) were incubated with the membranes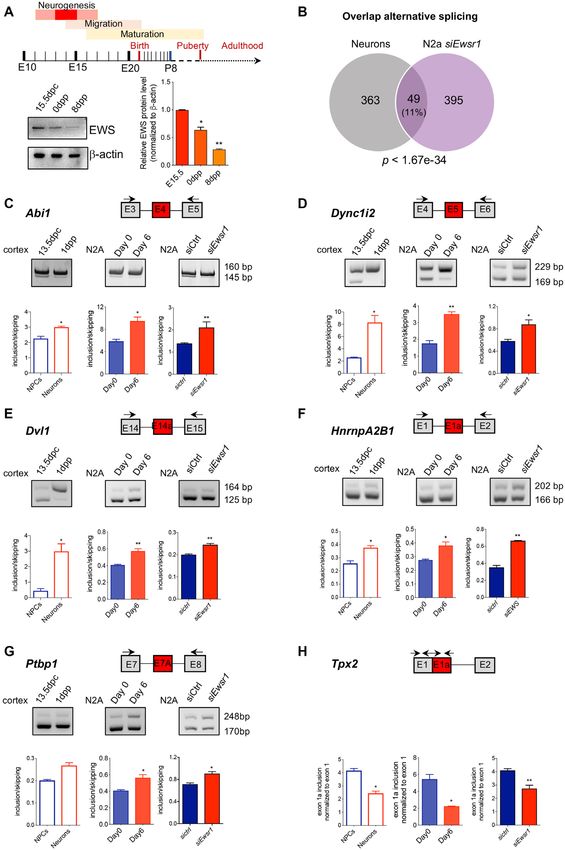
Nucleic Acids Research, 2022, Vol. 50, No. 6 3365
for 1 hour at room temperature at a 1:5000 dilution in PBS biological replicates. After the clustering analysis,
containing 0.1% Tween-20. Immunostained bands were de- one scrambled sample was discarded as outlier. The
tected by a chemiluminescent method (Thermo Fisher Sci- quality of the reads was assessed with the software
entific). Densitometric analysis was performed by ImageJ FastQC v0.11.9 (https://www.bioinformatics.babraham.
software. ac.uk/projects/fastqc/), then low quality portions of
the reads and adapters were removed with BBDuk
v38 (sourceforge.net/projects/bbmap/). The minimum
Crosslinking immunoprecipitation experiment
length of the reads after trimming was set to 35 bp and
CLIP assays were performed as previously described (17). the minimum base quality score to 25. The trimmed
N2A cells were UV-irradiated once with 400 mJ/cm2 . Cell reads were aligned against the Mus musculus refer-
suspension was centrifuged at 1200 rpm for 5 min, and ence genome sequence (GRCm38, Ensembl 98) with
the pellet was incubated for 10 min on ice in lysis buffer STAR aligner v2.5.0c, (https://www.ncbi.nlm.nih.gov/
(100 mM NaCl, 10 mM MgCl2 , 30 mM HEPES pH 7.6, 2 pmc/articles/PMC3530905/). FeatureCountsv1.4.6-
mM EDTA pH8, 10% glycerol, 0.5% Tryton-X100, RNase p5 (https://www.ncbi.nlm.nih.gov/pubmed/24227677)
Downloaded from https://academic.oup.com/nar/article/50/6/3362/6543543 by guest on 06 July 2022
inhibitor, cocktail prtotease inhibitor (Sigma-Aldrich), 0.5 was used together with the genome annotation to
mM Naortovanadate, 1%, 10 mM -glycerolphosphate and calculate gene expression values as raw read counts.
RNase inhibitor (Promega)). Samples were briefly soni- Normalized TMM and FPKM values were calcu-
cated and incubated with 10 l of 1/1000 RNase I (Am- lated with the R package edgeR (https://academic.
bion, AM2295, Thermo Fisher Scientific) dilution and 2 l oup.com/bioinformatics/article/26/1/139/182458). Lowly
Turbo DNase (Ambion, AM2238, Thermo Fisher Scien- expressed genes were removed with the HTSFilter package
tific) for 3 min at 37◦ C shaking at 1100 rpm, and then in- (https://www.ncbi.nlm.nih.gov/pubmed/23821648). The
cubated on ice for 3 min. Samples were centrifuged at 13 differential expression analysis was performed using edgeR
000 rpm for 10 min at 4◦ C. For input RNA, 10% of ex- and only the genes with an FDR equal or lower than 0.05
tract used for immunoprecipitation was treated with Pro- were considered as Differentially Expressed Genes (DEGs).
teinase K for 1 h at 55◦ C and RNA was purified by stan- In order to identify the number of different splicing
dard procedure. 1 mg of extract was immunoprecipitated events the software rMATS v3.2.5, (https://www.ncbi.nlm.
overnight using anti-EWS (18) antibody or purified rabbit nih.gov/pubmed/25480548) was used. A P-value filter of
IgGs (negative control) in the presence of protein A mag- 0.05 and a delta Psi of +/-10% was used to detect signifi-
netic Dynabeads (Thermo Fisher Scientific). Immunopre- cant differences in splicing events.
cipitates were incubated overnight at 4◦ C under constant For DEGs, gene set enrichment analysis was performed
rotation. After stringent washes with high salt buffer (300 using GSEA software (37), running a pre-ranked gene list
mM NaCl, 10 mM MgCl2 , 30 mM HEPES pH 7.6, 2 mM against a library of mouse gene sets. To generate the gene
EDTA pH 8, 10% glycerol, 0.5% Tryton-X100) beads were list, we firstly performed a differential expression analysis.
equilibrated with PK buffer (100 mM Tris–HCl, pH 7.4, 50 Next, the results were ordered from the most up-regulated
mM NaCl, 10 mM EDTA) treated with 50 g Proteinase to the most down-regulated in N2A siEwsr1 cells. The FDR
K for 20 min at 37◦ C shaking at 1100 rpm. 7 M urea was and the enrichment score (ES) were calculated by running
added to the PK buffer and incubation was performed for 1000 gene set permutations.
further 20 min at 37◦ C and 1100 rpm. The solution was col- For DEGs and significantly different splicing events, gene
lected and phenol/CHCl3 (Ambion, 9722, Thermo Fisher ontology analysis was performed using DAVID bioinfor-
Scientific) was added. After incubation for 5 min at 30◦ C matic tool (38) to identify the most enriched Gene Ontology
shaking at 1100 rpm phases were separated by spinning for (GO) categories across the down- and up-regulated events.
5 min at 13 000 rpm at room temperature. The aqueous layer
was transferred into a new tube and precipitated by addition
Bioinformatic analysis
of 0.5 l glycoblue (Ambion, 9510, Thermo Fisher Scien-
tific), 3 M sodium acetate pH 5.5 and 100% ethanol. After The size of exon, size of previous exon, size of following
mixing, the solution containing retained RNA was precipi- exon, size of intron, size of previous intron, size of following
tated overnight at –20◦ C. Purified RNA was used for qPCR intron, percentage of GC in the previous intron, percentage
analysis. Primers used to analyze EWS binding are listed in of GC in exon, percentage of GC in the following intron
Supplementary Table S4. were calculated using M. musculus (Ensembl GRCm38) as
reference genome.
For splicing feature analysis in order to calculate the
RNA sequencing
following values: MaxEnt Score Acceptor, MaxEnt Score
For RNA-seq analysis, RNA from two biological replicates Donor, Delta MaxEnt Score Acceptor-Donor, the tool
of control and three for siEwsr1 N2A cells were isolated called MaxEntScan (39) was used to estimate the strength
and DNase digested using the RNAeasy Mini Kit (Qiagen) of 3 and 5 splice sites. 5 splice site strength was as-
according to manufacturer’s instruction. RNA sequencing sessed using a sequence including 3nt of the exon and 6nt
and bioinformatics analysis were performed by IGA Tech- of the adjacent intron (http://hollywood.mit.edu/burgelab/
nology services (Via Jacopo Linussio, 51, 33100, Udine, maxent/Xmaxentscan scoreseq.html). 3 splice site strength
Italy). was assessed using a sequence including −20nt of the flank-
The RNA-seq experiment was performed with 33.7 ing intron and 3nt of the exon (http://hollywood.mit.edu/
M depth of paired reads (150 bp) per sample, in three burgelab/maxent/Xmaxentscan scoreseq acc.html).
3366 Nucleic Acids Research, 2022, Vol. 50, No. 6
SVM-BPfinder (https://bitbucket.org/ ficative. For the Venn diagram comparison, significance was
regulatorygenomicsupf/svm-bpfinder/src/master/) was used assessed using the hypergeometric test in to verify whether
to estimate branchpoint and polypyrimidine tract strength the overlap between the two groups is not due to chance.
and other statistics. First SVM-BPfinder was used with Fisher’s exact test was used for comparing count data, using
the following options: -s Mmus -l 500 -d 20. Scores were a total background of 38 593 genes. The test was performed
estimated using the sequence of introns to the 3 end of exon within the R environment.
between 20nt and 500nt. The results were filtering according
to the instructions in the official website of SVM-BPfinder RESULTS
(http://regulatorygenomics.upf.edu/Software/SVM BP/).
Exactly the website recommends the following: EWS regulates self-renewal and clonogenic potential of neu-
SVM-BPfinder outputs all candidate BPs. However, ral progenitor cells (NPCs)
many can be discarded. We recommend selecting BPs ac- To investigate the role of EWS during neuronal differentia-
cording to the following rules: tion, we used NPCs, which recapitulate early steps of neuro-
genesis in vitro (42). We isolated NPCs from the E13.5 cor-
Downloaded from https://academic.oup.com/nar/article/50/6/3362/6543543 by guest on 06 July 2022
• Generally, only consider BPs with svm score > 0 tex of wild type embryos (33) and EWS expression was si-
• Keep BPs close to the AGEZ (distance to 3 ss is ap- lenced by electroporating the cells in the presence of siRNA
prox. within AGEZ + 9nt), with BP-score > 0 and with oligonucleotides targeting the Ewsr1 transcript (siEwsr1;
svm score > 0. Figure 1A). Under stemness conditions, NPCs form neu-
• If there is only one such BP, take that one. If there is rospheres that rapidly grow in volume (33). Knockdown
more than one, you may keep the one with the highest of EWS markedly affected the physiological properties of
svm score if you only need one BP. NPCs, as indicated by the reduced diameter of siEwsr1-
• If there are none, drop the BP score > 0 condition and transduced neurospheres with respect to those transduced
consider the BPs with svm score > 0. with a control (ctrl) siRNA (Figure 1B, C). Accordingly,
*
All the above filters were applied in the final results. EWS-depleted NPCs exhibited reduced clonogenic poten-
tial (Figure 1D), suggesting that high EWS expression is re-
quired to maintain stemness. In line with this hypothesis,
Motif analysis expression of two well-known stemness markers, Sox2 and
An analysis of enriched DNA motives was performed to Nestin, were significantly reduced in EWS-depleted NPCs,
identify the presence of EWS binding sites in the differential whereas βIII-tubulin expression, a marker of neuron differ-
spliced regions. For that purpose, BED files with the dif- entiation, was increased (Figure 1E).
ferential splicing events were produced adding a padding Next, we performed differentiation assays by switching
of 250 bp upstream and downstream of the event’s coor- NPCs to serum-containing medium for 3 days (33,42).
dinates. In addition, a BED file containing all the anno- EWS-depleted NPCs differentiated with higher efficiency
tated exons in the mouse genome with a padding of 250 bp than control NPCs, as assessed by the increased number of
was produced and used as a background. The known bind- -III Tubulin positive cells after 3 days of differentiation
ing sites of EWS (17) were converted to DNA motives with (Figure 1F). Moreover, EWS-depleted neurons exhibited
Homer v4.11 (https://pubmed.ncbi.nlm.nih.gov/20513432/) higher complexity, as shown by the increased neurite length
and then the entire mouse genome was scanned with the compared to neurons derived from control NPCs (Figure
Homer tool scanMotifGenomeWide.pl to find all the EWS 1G). To characterize the neuron type generated prematurely
binding sites occurrences. The coordinates of the obtained in EWS-depleted cultures, we monitored the expression of
sites were intersected with the padded differential spliced GABAergic (Gad67), Cholinergic (Chat) and Glutamater-
events and the background to calculate the occurrence in gic (vGlut1) markers by RT-qPCR. As shown in the Sup-
each dataset and the proportions were compared with a plementary Figure S1, Ewsr1 knockdown caused a signifi-
Fisher Exact test. cant increase in Gad67 expression, which is associated with
GABAergic neurons representing the most abundant pop-
ulation in this setting. By contrast, markers of Cholinergic
External datasets
(Chat) and Glutamatergic (vGlut1) were not significantly af-
Neural progenitor cells (NPCs) and neurons purified from fected.
E15.5 cortical cells were downloaded from the Gene Ex-
pression Omnibus with accession GSE96950 (40). The EWS depletion promotes neuronal differentiation of neurob-
RNA-seq data of NPCs and neurons were re-analyzed us- lastoma N2A cells
ing the cut-off of P ≤ 0.05, and threshold 1.5 for the splicing
index fold change. FOXP1 KD Neural stem cells (NSCs) Our results indicate that EWS promotes NPC self-renewal
and their respective controls (41) were downloaded from proficiency and limits their entry into differentiation. To
GSE101605. The cut-off of FOXP1 KD NSCs RNA-seq investigate the mechanism underlying the impact of EWS
data was P ≤ 0.05. expression on neuronal differentiation, we employed the
N2A neuroblastoma cell line. These cells efficiently differ-
entiate into neuron-like cells, express enzymes associated
Statistical analysis
with neural function and are capable of generating action
Data are presented as mean ± SD. All tests were performed potentials (43). Depletion of EWS in N2A cells (Figure
using GraphPad Prism7. P ≤ 0.05 (*) was considered signi- 2A, B) elicited a marked change in cell morphology (Figure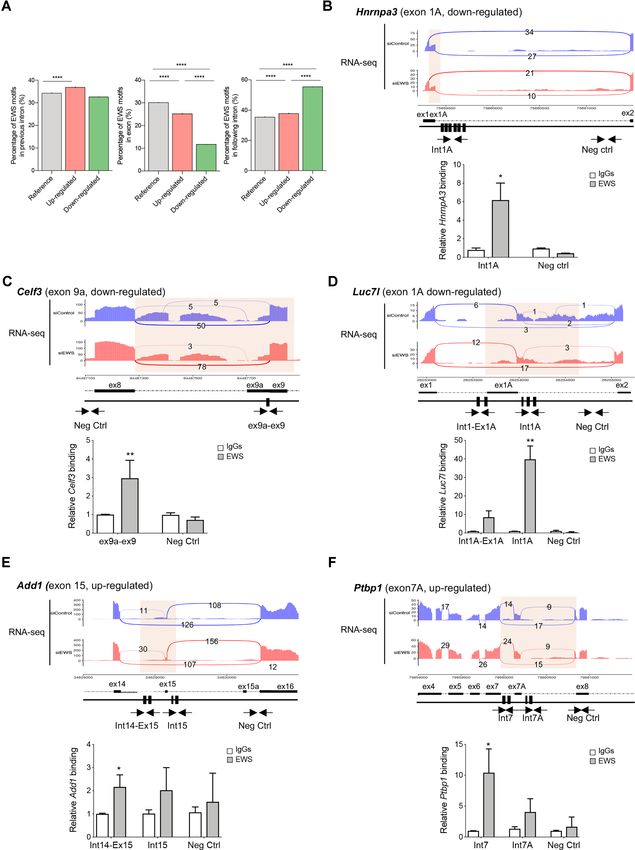
Nucleic Acids Research, 2022, Vol. 50, No. 6 3367
Downloaded from https://academic.oup.com/nar/article/50/6/3362/6543543 by guest on 06 July 2022
Figure 1. Knockdown of Ewsr1 promotes neuron differentiation in Neural Progenitor Cells. (A). RT-qPCR showing the levels of Ewsr1 transcript in NPCs
after 48h of transfection with either sicontrol (sictrl) or siEwsr1. (B) Representative images of NPCs transfected with sictrl or siEwsr1, cultured for 5 days in
proliferating condition. Scale bar = 25 m. (C) Bar graph reporting the analysis of the diameter of neurospheres formed by sictrl or siEwsr1 NPCs after 5
days of culture. (D) Bar graph reporting the clonogenicity of NPCs, expressed as the percentage of neurospheres obtained from the seeded sictrl or siEwsr1
NPCs. (E) RT-qPCR showing the levels of Sox2, Nestin and βIII tubulin transcripts in NPCs transfected with either sictrl or siEwsr1 oligonucleotides, after
3 days of culture in differentiation conditions, normalized for the levels of the housekeeping gene Tbp. (F) Representative images of NPCs transfected with
either sictrl or siEwsr1 oligonucleotides, after 3 days of culture in differentiation conditions. Cells were stained with anti-III tubulin (green), and DAPI
(blue). Bar graph representing the percentage of III-tubulin positive cells. Scale bar = 50 m. (G) Bar graph represents the average of total neurite length
per cell (m). P-values were determined by Student’s t test *P ≤ 0.05 (n = 3; mean ± SD).
2C), with a ∼2-fold increase in the neurite length compared changes of 10 arbitrarily selected genes associated to neu-
to control cells (Figure 2D). Similar results were also ob- ronal differentiation, supporting the reliability of the RNA-
served in human SHSY5Y neuroblastoma cells after silenc- seq data (Figure 2H). Collectively, these data support the
ing of EWS (Supplementary Figure S2A–D). Thus, EWS hypothesis that EWS plays a key role in the switch from pro-
knockdown promotes morphological changes leading to liferation to neuronal differentiation.
neurite outgrowth both in human and mouse neuron-like
cells.
To understand how EWS promotes morphological EWS affects alternative splicing choices in N2A neuron-like
changes in neuronal cells, we performed RNA-sequencing cells
(RNA-seq) analyses in N2A cells. Depletion of EWS caused EWS was previously shown to regulate AS in various cell
extensive transcriptional changes in N2A cells (Figure 2E), types (15–18,44). Analysis of the RNA-seq data by using
with 487 genes being differentially expressed (fold change ≥ the PSI-Sigma splicing patterns annotation method identi-
1.5) and mostly (62%) down-regulated in siEwsr1 cells (Fig- fied 570 AS events in 445 genes that were modulated upon
ure 2F, Supplementary Table S1). Gene ontology analysis EWS knockdown in N2A cells, with 350 events leading to
(Figure 2G) and gene set enrichment analysis (GSEA) (Sup- up-regulation of the alternative region and 220 to down-
plementary Figure S1B) revealed that the EWS-regulated regulation (Supplementary Table S2). Splicing pattern anal-
genes were enriched in signatures associated with chromo- ysis showed a higher impact of EWS on exon cassette events
some organization, DNA repair, cell projection, nervous (59%), followed by alternative 3 splice site (19%), alterna-
system and synaptic signaling. Notably, most of these genes tive 5 splice site (16%), multiple-exons skipping (3%) and
were also regulated during differentiation of progenitor cells mutually exclusive exon (3%) events (Figure 3A). Differ-
into mature neurons (40), highlighting a potential role of entially spliced genes were significantly enriched in func-
EWS protein in the regulation of the neuronal differentia- tional categories related to RNA processing, RNA splicing
tion process. RT-qPCR analysis confirmed the expression and post-transcriptional regulation (Figure 3B). Analysis of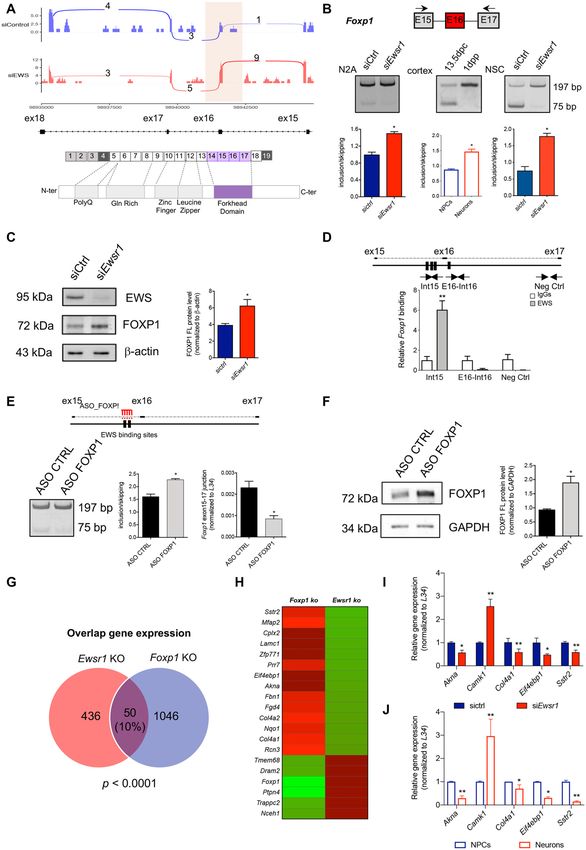
3368 Nucleic Acids Research, 2022, Vol. 50, No. 6
Downloaded from https://academic.oup.com/nar/article/50/6/3362/6543543 by guest on 06 July 2022
Figure 2. Knockdown of EWS promotes neuronal differentiation and leads to transcriptional changes in N2A cells. (A) RT-qPCR showing Ewsr1 transcript
levels in N2A cells after 48 h of transfection with either sictrl or siEwsr1, normalized for the levels of the housekeeping gene Tbp. (B) Western blot showing
the EWS protein levels in N2A cells after 48h of transfection with either control siRNA or siEwsr1, normalized to -actin. (C) Immunofluorescence
analysis of N2A cells transfected with either control or siEwsr1 oligonucleotides for 48 h. Cells were stained with anti-III tubulin (green). Scale Bar =
25 m. (D) Box plot showing the neurite length relative to N2A transfected with control siRNA or siEwsr1 for 48h. (E) Heatmap representing differential
gene expression in control and Ewsr1 knockdown N2A. Green color indicates down-regulated genes, and red represents up-regulated genes. Each row
represents a sample and each column represents a gene. (F) Pie charts showing percentages of up- and down- regulated genes identified in siEwsr1 versus
control N2A cells (fold change ≥1.5, P ≤ 0.05). (G) Bar graph showing the enrichment score of the gene ontology functional clusters enriched in splicing
regulated genes (P ≤ 0.01). (H) RT-qPCR showing the expression levels of Colgalt2, Cplx2, Cth, Cthrc1, Mcts1, Myl9, Nqo1, Nyap2, Prr7 and Ptpn4 in
sictrl and siEwsr1 N2A cells, normalized to Tbp. P-values were determined by Student’s t test * P < 0.05; ** P < 0.01 (n = 3; mean ± SD).
Nucleic Acids Research, 2022, Vol. 50, No. 6 3369

                                                                                                                                                                 Downloaded from https://academic.oup.com/nar/article/50/6/3362/6543543 by guest on 06 July 2022
Figure 3. EWS affects alternative splicing choices of N2A cells. (A) Pie chart representing distribution of regulated splicing events among different splicing
patterns in sictrl and siEwsr1 N2A cells. (B) Bar graph showing the enrichment score of the gene ontology functional clusters enriched in splicing regulated
genes (P ≤ 0.01). (C) Venn diagram showing overlap between transcriptional- and splicing- regulated genes, identified by comparison of siEwsr1 versus
control N2A cells (P < 0.002). (D–H) Representative images of the PCR analyses for indicated alternative splicing events differentially regulated between
N2A transfected with either sictrl or siEwsr1. Schematic representation for each event analyzed is depicted above the representative agarose gel. Red boxes
indicate the regulated exon in siEwsr1 compared with control N2A cells. Black arrows in the scheme indicate primers used for the PCR analysis of Add1,
Celf3, HnrnpA3, Luc7l and Ptbp1 event. The graphs show the densitometric analysis of the ratio between isoforms with included and skipped exons.
P-values were determined by Student’s t test: *P ≤ 0.05, **P ≤ 0.01 (n = 3; mean ± SD).

the overall changes in gene expression level indicated a lim-                     Sequence features of EWS regulated splicing events
ited overlap with splicing- regulated genes (P < 0.002, Fig-
                                                                                  To gain insights into the mechanism by which EWS mod-
ure 3C), suggesting that splicing regulation by EWS did not
                                                                                  ulates splicing, we searched for sequence features associ-
directly impact on expression or stability of most of its tar-
                                                                                  ated with the regulated exons. EWS-regulated exons display
get transcripts in neuronal cells. Validation of 9 randomly
                                                                                  changes in exon length in comparison with reference not-
selected splicing events by RT-PCR confirmed the reliability
                                                                                  regulated exons. In particular, up-regulated exons are sig-
of the RNA-seq analysis (Figure 3D–H and Supplementary
                                                                                  nificantly smaller than reference or down-regulated exons
Figure S3).
3370 Nucleic Acids Research, 2022, Vol. 50, No. 6
(Figure 4A). Moreover, up-regulated exons are flanked by ity of the 5 splice site promotes exon inclusion, presumably
introns that are significantly longer than reference introns by recruiting U1snRNP (17), whereas its binding near the
(Figure 4B, C), whereas down-regulated exons are charac- 3 splice site leads to skipping of the target exon.
terized by downstream introns that are longer than those of To confirm that EWS controls splicing of the regulated
both up-regulated and reference exons (Figure 4C). exons by direct binding, we designed antisense oligonu-
Analysis of splice sites strength indicated that exons cleotide (ASO) to mask its binding sites in the Ptbp1 and
up-regulated in EWS-depleted cells are characterized by Hnrnpa3 pre-mRNAs. As shown in Supplementary Figure
stronger donor and acceptor sites with respect to refer- S6, treatment with these ASOs mimicked the effects ob-
ence exons (Figure 4D and E). Analysis of branchpoint and served with EWS knockdown, with enhanced inclusion of
polypyrimidine tract sequences did not reveal significant exon 7A in Ptbp1 and repression of the exon 1A alternative
differences between EWS-regulated events and reference ex- 5 splice site in Hnrnpa3. These results indicate that prevent-
ons (Supplementary Figure S4A-E), although the distance ing EWS binding to its target pre-mRNAs, either by protein
between branchpoint and acceptor was slightly higher in depletion or by competition with an ASO, directly affects
regulated exons compared to reference ones (Figure 4F). the splicing decision.
Downloaded from https://academic.oup.com/nar/article/50/6/3362/6543543 by guest on 06 July 2022
Likewise, EWS regulated exons did not show differences
in GC content (Supplementary Figure S5A). However, up-
EWS-regulated events are modulated during neurogenesis
regulated exons were characterized by flanking introns with
higher GC content, whereas only the downstream intron of Developmental analysis of the mouse cortex showed that
down-regulated exons showed this feature (Supplementary EWS protein levels peak at E15.5, whereas its expression
Figure S5B and C) (45). Collectively, these results suggest slowly declines at birth and in early post-natal life (Fig-
that EWS represses small exons containing strong donor ure 6A) (13). The high EWS expression at E15.5 corre-
and acceptor sites and flanked by long, GC-rich introns. sponds to a stage of intense neurogenesis in the developing
Moreover, EWS plays a positive role on splicing regulation cortex (46,47), whereas its decline correlates with terminal
of weak exons that are followed by long introns with high differentiation of neurons (P0) and establishment of func-
GC content. tional synaptic contacts in the cortex (P8-21) (46). Thus,
we decided to compare the EWS-dependent splicing events
with those differentially regulated between NPCs and post-
EWS exerts a positional effect on splicing regulation of target
mitotic neuronal cells in the E15.5 mouse cortex (40). Our
exons
analysis revealed a highly significant (P = 1.67e–34) over-
Next, to determine whether EWS directly regulates these lap between AS events regulated in siEwsr1-N2A cells and
splicing events in N2A cells, we evaluated the density of those differentially spliced upon neuron differentiation in
EWS binding sites in its target exons. To this end, we vivo, with 49 events in common between the two datasets
searched for EWS consensus motifs (GGGTG, GGGGT, (Figure 6B). Analysis of 6 of these events showed that they
GGGGA pentamers) (17) in the regulated exons and flank- were differentially modulated in the mouse cortex between
ing intronic sequences (±250 nt). Position analysis of the E13.5, when the vast majority of cells are NPCs, and P1,
EWS motifs revealed a significant increase of EWS bind- when post-mitotic neurons are predominant (Figure 6C–
ing sites in the region upstream of up-regulated exons, and H). Notably, these events were regulated in the same di-
an even more pronounced in the intron downstream of rection also during neuronal differentiation of N2A cells in
down-regulated exons (Figure 5A). By contrast, EWS bind- vitro. More importantly, depletion of EWS in undifferen-
ing sites were significantly depleted within both up- and tiated N2A recapitulated the splicing pattern that typifies
down-regulated exons (Figure 5A). These results suggest N2A differentiated in vitro and the mouse P1 cortex with
that EWS exerts a positional effect on target exons, with respect to the E13.5 cortex in vivo (Figure 6C–H). These re-
binding nearby the 5 splice site promoting inclusion and sults suggest that high EWS expression in NPCs maintains
binding nearby the 3 splice site leading to skipping. the undifferentiated splicing signature and that its depletion
To directly evaluate whether EWS binds to its target pre- or physiological decline promotes the neuronal differentia-
mRNAs we performed UV-cross-linked and immunopre- tion program by modulating AS choices.
cipitation (CLIP) experiments in N2A cells. Analysis of the
Add1, Celf3, HnrnpA3, Luc7l and Ptbp1 pre-mRNAs (Fig-
EWS modulates Foxp1 splicing during neurogenesis
ure 5B–F) revealed the direct in vivo recruitment of EWS
in proximity of its binding sites (indicated as black boxes in Among the EWS splicing-regulated genes, we focused on
the scheme) near the regulated exons, while putative binding Foxp1. The Foxp1 gene encodes a transcription factor
sites, in other regions chosen farther from the regulated ex- whose expression in NPCs promotes neuron and astrocyte
ons were not bound (Figure 5B-F). Interestingly, the CLIP differentiation (41). Importantly, FOXP1 mutations have
assays also supported its positional effect on splicing regula- been linked to neurodevelopmental disorders in humans
tion. Indeed, EWS was preferentially recruited in the down- (48,49), further indicating the key role played by this tran-
stream intron of induced exons (down-regulated upon de- scription factor in neurogenesis. Depletion of EWS in N2A
pletion), like in the HnrnpA3, Celf3 and Luc7l pre-mRNAs promoted the inclusion of exon 16, which encodes part
(Figure 5B–D), whereas its binding was detected in the up- of the Forkhead domain required for DNA binding (Fig-
stream intron of repressed exons (up-regulated upon deple- ure 7A). First, we confirmed the RNA-seq results, doc-
tion), like in the Add1 and Ptpb1 pre-mRNAs (Figure 5E, umenting that EWS depletion promotes the inclusion of
F). These results indicate that binding of EWS in proxim- the alternative exon 16 (Figure 7B, Supplementary FigureNucleic Acids Research, 2022, Vol. 50, No. 6 3371
Downloaded from https://academic.oup.com/nar/article/50/6/3362/6543543 by guest on 06 July 2022
Figure 4. Sequence features of EWS regulated exons. Box plots representing comparison between up- regulated, down-regulated and reference events for
exon size (A), previous intron size (B), following intron size (C), donor score (D), acceptor score (E), distance between branchpoint and acceptor (F).
P-values are measured by Fisher test.
S7A,B), accompanied by a concomitant increase in the ex- counting neurite length and neurite branch points (Supple-
pression levels of the full length FOXP1 protein (Figure mentary Figure S8A, B).
7C). Importantly, increased inclusion of Foxp1 exon 16 was The AS isoform promoted by EWS lacks exon 16.
also detected in the developing cortex and in NPCs depleted The 15–17 junction, which is down-regulated in EWS-
of EWS (Figure 7B), although with a different baseline depleted N2A cells (Supplementary Figure S7B), produces
splicing pattern compared to N2A cells. In line with a direct a frameshift and creates a premature stop codon in exon
effect of EWS on this splicing event, CLIP experiments in- 17, which disrupts the forkhead domain. Thus, EWS could
dicated that EWS specifically binds intronic sequences up- impair FOXP1 transcriptional activity by regulating splic-
stream of the regulated exon in N2A cells, but not in the ing of exon 16. To test this possibility, we compared genes
downstream intron (Figure 7D). To corroborate the role of regulated by FOXP1 in NPCs cells (41) with those affected
EWS in promoting the inclusion of Foxp1 exon 16, we de- at the gene expression level upon EWS depletion in N2A
signed an ASO targeting the EWS binding motif in Foxp1 cells. We observed a significant (P < 0.001) overlap between
pre-mRNA. As shown in Figure 7E, ASO treatment fa- the two datasets, with 50 genes regulated by both EWS and
vored exon 16 inclusion and inhibited exon 15–17 junction, FOXP1 depletion (Figure 7G). Notably, all neuronal genes
thus reproducing the effect of EWS knockdown. Moreover, in common between the two datasets were regulated in op-
blocking of EWS binding through this ASO also caused an posite direction by depletion of EWS and FOXP1, support-
increase in the expression of the full length FOXP1 protein ing the notion that EWS represses FOXP1 activity (Fig-
(Figure 7F) and in N2A cell differentiation, monitored by ure 7H). RT-qPCR analysis confirmed that a portion of3372 Nucleic Acids Research, 2022, Vol. 50, No. 6
Downloaded from https://academic.oup.com/nar/article/50/6/3362/6543543 by guest on 06 July 2022
Figure 5. EWS exhibits positional pre-mRNA binding around regulated alternative splicing exons. (A) Bar graphs showing percentage of EWS motifs
according to their relative position, 250nt at 3 splice site, exon, 250nt at 5 splice site, among up-regulated, down-regulated and reference exons. P-values
are measured by Fisher exact test (****P ≤ 0.00001). (B–F) Representative sashimi plots displaying RNA-Seq reads coverage of the alternatively spliced
genes associated with microtubule cytoskeleton and RNA processing. Spliced regions are indicated by semi-transparent yellow blocks. Black rectangular
blocks indicate EWS binding sites. Black arrows in the scheme indicate primers and amplicons used for the CLIP assay analysis. Bar graph showing qPCR
signals amplified from the CLIP assays expressed as fold of IgGs. IgGs are represented in white and EWS binding in grey. P-value was determined by
one-way ANOVA, with P-valueNucleic Acids Research, 2022, Vol. 50, No. 6 3373
Downloaded from https://academic.oup.com/nar/article/50/6/3362/6543543 by guest on 06 July 2022
Figure 6. EWS-regulated events are modulated during neurogenesis. (A) Schematic representation of timing of embryonic and post-natal brain develop-
ment. Western blot analysis for EWS in mouse cortex at 15.5 days post coitum (15.5 dpc), 0 day post partum (0 dpp) and 8dpp, normalized to -actin
(n = 3; mean ± SD). P-value was determined by one-way ANOVA, with P-value < 0.05, and with Bonferroni post-hoc test. * P ≤ 0.05, ** P ≤ 0.01. (B)
Venn diagram showing overlap between splicing-regulated genes, identified by comparison of siEwsr1- N2A data with neuron differentiation seq- data (P <
1.67e–34). (C–H) Representative images of the PCR analyses for indicated alternative splicing events differentially regulated between N2A transfected with
either sictrl or siEwsr1, during neuronal development and in differentiating N2A cells. Schematic representation for each event analyzed is depicted above
the representative agarose gel. Red boxes indicate the regulated exon in siEwsr1 compared with control N2A cells. Black arrows in the scheme indicate
primers used for the PCR analysis of Abi1, Dync1i2, Dvl1, HnrnpA2B1, Ptbp1 and Tpx2 event. The graphs show the densitometric analysis of the ratio
between isoforms with included and skipped exons. P-values were determined by Student’s t test: * P ≤ 0.05, ** P ≤ 0.01 (n = 3; mean ± SD).3374 Nucleic Acids Research, 2022, Vol. 50, No. 6
Downloaded from https://academic.oup.com/nar/article/50/6/3362/6543543 by guest on 06 July 2022
Figure 7. EWS regulates Foxp1 alternative splicing impacting neuronal gene expression. (A) Representative sashimi plots displaying RNA-Seq reads
coverage of the alternatively spliced Foxp1 genes. Spliced region is indicated by semitransparent yellow blocks. Schematic representation of FOXP1 protein
domain. The purple exons encode for the forkhead domain. (B) Representative images of the PCR analyses for Foxp1 alternative splicing event differentially
regulated between N2A transfected with either sictrl or siEwsr1, during cortex development and in differentiating NPCs transfected with either sictrl or
siEwsr1. Schematic representation for Foxp1 event is depicted above the representative agarose gel. Red boxes indicate the regulated exon in siEwsr1
compared with control N2A cells. Black arrows in the scheme indicate primers used for the PCR analysis of Foxp1 event. P-values were determined by
Student’s t test: * P ≤ 0.05, ** P ≤ 0.01 (n = 3; mean ± SD). (C) Western blot analysis of sictrl and siEwsr1 N2A cell extracts to monitor the expression of
EWS and FOXP1 proteins. Loading was normalized to -actin expression. 15 g of protein extracts were loaded in each lane. P-values were determined by
Student’s t test: * P ≤ 0.05, ** P ≤ 0.01 (n = 3; mean ± SD). (D) Schematic representation of EWS binding sites in Foxp1 pre-mRNA is depicted above the bar
graph. Black rectangular blocks indicate EWS binding sites. Black arrows in the scheme indicate primers and amplicons used for the CLIP assay analysis. In
the bottom, bar graph showing qPCR signals amplified from the CLIP assays expressed as fold of IgGs. IgGs cross-linked RNAs are represented in white,
EWS cross-linked regions in grey. P-value was determined by one-way ANOVA, with P-value < 0.05, and with Bonferroni post-hoc test, ** P ≤ 0.01. (E)
Schematic representation of EWS binding sites and ASO binding in Foxp1 pre-mRNA is depicted above the bar graph. Black rectangular blocks indicate
EWS binding sites and red comb indicate ASO position used to inhibit EWS recruitment. In the bottom, representative image of the PCR analyses for
Foxp1 alternative splicing event differentially regulated between N2A treated with either ASO ctrl or ASO FOXP1. Histograms represent the densitometric
analysis of the ratio between isoforms with included and skipped exons. On the right, bar graphs represent RT-qPCR analysis showing the expression levels
of the junction exon 15–17 of Foxp1 gene in N2A cells treated with ASO ctrl or ASO FOXP1, normalized to L34. P-values were determined by Student’s t
test * P ≤ 0.05 (n = 3; mean ± SD). (F) Western blot analysis of ASO ctrl and ASO FOXP1 N2A cell extracts to monitor the expression of FOXP1 protein.
Loading was normalized to GAPDH expression. 15 g of protein extracts were loaded in each lane. P-values were determined by Student’s t test: * P ≤
0.05 (n = 3; mean ± SD). (G) Venn diagram showing overlap between transcriptional-regulated genes, identified by comparison of siEwsr1-N2A data with
siFoxp1-NSCs seq-data (P < 0.0001). (H) Heatmap representing differential gene expression in Foxp1 and Ewsr1 knockdown cells. Green color indicates
down-regulated genes, and red represents up-regulated genes. (I) RT-qPCR showing the expression levels of Akna, Camk1, Col4a1, Eif4ebp1, Sstr2 in sictrl
and siEwsr1 N2A cells, normalized to L34. (J) RT-qPCR showing the expression levels of Akna, Camk1, Col4a1, Eif4ebp1, Sstr2 in NPCs and neurons,
normalized to L34. P-values were determined by Student’s t test * P ≤ 0.05, ** P ≤ 0.01 (n = 3; mean ± SD).Nucleic Acids Research, 2022, Vol. 50, No. 6 3375
FOXP1 target genes were also modulated upon EWS de- tern (Figure 3A). Splicing-regulated genes were enriched in
pletion (Figure 7I). Moreover, these genes were also reg- functional categories related to RNA processing and RNA
ulated during cortical development (Figure 7J), concomi- splicing, thus supporting the strong impact of EWS on
tantly with the opposite regulation of EWS and FOXP1 RNA metabolism in neuronal cells. Comparison between
protein (Figure 8A). These results suggest that EWS con- transcriptional- and splicing-regulated genes showed lim-
trols gene expression programs associated with neurogene- ited overlap (Figure 3C), indicating that EWS modulates
sis through, at least in part, splicing modulation of Foxp1 independently transcription and splicing in neuronal cells.
exon 16. To directly test this hypothesis, we aimed at in- Bioinformatic analysis of sequence features associated
ducing the skipping of exon 16 in neuronal cells through an with the regulated exons revealed that EWS mainly re-
ASO that targets its 5 splice site (ASO5’SS). Transduction presses small exons characterized by strong splice sites and
of this ASO into N2A cells significantly induced skipping flanked by long introns (Figure 4). In contrast, EWS pro-
of exon 16 and increase in the exon 15–17 junction, as mon- motes the inclusion of weak exons followed by long introns
itored by RT-PCR analysis (Figure 8B). Furthermore, the with high GC content. The high GC content is an impor-
expression of this FOXP1 isoform, which is promoted by tant feature for the recruitment of U1 snRNP at the 5 splice
Downloaded from https://academic.oup.com/nar/article/50/6/3362/6543543 by guest on 06 July 2022
EWS, correlated with inhibition of neuronal differentiation, site (52). Thus, EWS could promote 5 splice site recogni-
as determined by decreased III tubulin expression (Figure tion and exon definition by recruiting U1 snRNP at weak 5
8C) and reduced neurite length and branching (Figure 8D). splice site, supporting previous works by our and other lab-
These results confirm that EWS controls the neuronal dif- oratories (15–17,44). In line with this hypothesis, position
ferentiation program through, at least in part, splicing reg- motif analysis revealed a significant enrichment of EWS
ulation of Foxp1 (Figure 8E). binding sites near the 5 splice site of down-regulated ex-
ons, an observation that was corroborated by CLIP experi-
ments from UV-cross linked N2A extracts, which confirmed
DISCUSSION
the direct binding of EWS to its target pre-mRNAs in vivo.
Ewsr1 knockout mice show defects in neuronal morphol- In particular, while EWS binding nearby the 5 splice site
ogy, dopaminergic signaling pathways and motor function promotes exon inclusion, its recruitment near the 3 splice
(12). However, whether EWS protein plays a direct role in site causes exon skipping (Figure 5), consistent with its in-
these processes and though which mechanism(s) was not in- teraction with U1 (15–17) and U2AF (17).
vestigated yet. In this work, we have uncovered a new role Alternative pre-mRNA processing plays a major role in
for EWS in neuronal differentiation, which is exerted, at the brain, by balancing cell growth and differentiation and
least in part, through splicing regulation of selected target by enhancing acquisition of cell identity (20,53–55). Given
genes. Our study documents that EWS protein is strongly that EWS expression is regulated during neurogenesis and
expressed at E15.5 in the developing cortex, which corre- postnatal cortical development (Figure 6) (13), and that its
sponds to stage of intense neurogenesis (46,47), while its ex- ablation leads to early differentiation in distinct neuronal
pression significantly decreased at birth and in post-natal cell models (Figures 1, 2, and Supplementary Figure S2),
life (Figure 6A) (13). These observations suggested that we compared the EWS-regulated splicing events with those
downregulation of EWS protein could be required for the regulated during neurogenesis (40). We observed a signifi-
transition from stemness to differentiation in NPCs (50). cant overlap of 11% of the genes affected in both RNA-seq
In line with this hypothesis, depletion of EWS in NPCs experiments. Genes involved in neurite branching, synapse
isolated from wild type E13.5 cortices impaired their pro- formation and RNA processing showed similar AS patterns
liferation and clonogenic potential, reduced expression of in EWS-depleted N2A cells and in post-mitotic neurons of
the stemness markers Sox2 and Nestin, and enhanced their the developing cortex. Among these events, we observed the
tendency to differentiate into mature neurons (Figure 1). inclusion of exon 1A in HnrnpA2B1 upon silencing of Ewsr1
These observations indicate that high EWS expression in in N2A cells and during neuronal differentiation, as well as
the developing cortex is required to maintain the pool of the alternative inclusion of exon 7A in Ptbp1. Interestingly,
NPCs and to limit their premature entry into the differen- the inclusion of the alternative exon 1A determines the pro-
tiation program. Similarly, depletion of EWS in N2A cells duction HnRNP B1 protein, rather than HnRNP A2 (56).
promoted neuronal-like differentiation and increased neu- On the other hand, inclusion of exon 7A in Ptbp1 yields
rite length (Figure 2C). Neurite extension is a complex pro- an isoform displaying altered splicing activity, thus affecting
cess which allows neurons to achieve precise connectivity, the inclusion levels of numerous exons (57). These observa-
a crucial step for their proper functioning (51). To under- tions suggest that EWS may coordinate a widespread splic-
stand the molecular mechanism underlying the morpholog- ing program in the developing cortex through direct and in-
ical changes induced by EWS knockdown, we performed direct mechanisms.
RNA-seq analyses in N2A cells. Most of the genes regulated To link EWS-mediated splicing regulation with func-
upon Ewsr1 silencing were associated with cell projection, tional outcome, we focused our attention on the transcrip-
nervous system and synaptic signaling. Notably, these func- tion factor FOXP1, which plays a hierarchical role in the
tional categories were also enriched during neuronal differ- transcription network of pluripotency. Previous studies in-
entiation in the developing cortex (40), supporting the role dicated that switching of its mutually-exclusive exons 16
of EWS in this process. and 16b controls pluripotency and reprogramming of em-
Our analysis also identified hundreds of genes modu- bryonic stem cells (58). In particular, the alternative inclu-
lated at the splicing level upon EWS knockdown, with sion of these exons changes the DNA-binding specificity
exon cassette being the predominant regulated splicing pat- of FOXP1 protein, promoting the transcription of pluripo-You can also read