Evaluation of Regularized Image Reconstruction for Clinical Positron Emission Tomography
←
→
Page content transcription
If your browser does not render page correctly, please read the page content below
Digital Comprehensive Summaries of Uppsala Dissertations
                from the Faculty of Medicine 1812

                Evaluation of Regularized Image
                Reconstruction for Clinical
                Positron Emission Tomography

                ELIN LINDSTRÖM

    ACTA
UNIVERSITATIS
 UPSALIENSIS    ISSN 1651-6206
                ISBN 978-91-513-1425-9
  UPPSALA       URN urn:nbn:se:uu:diva-468126
    2022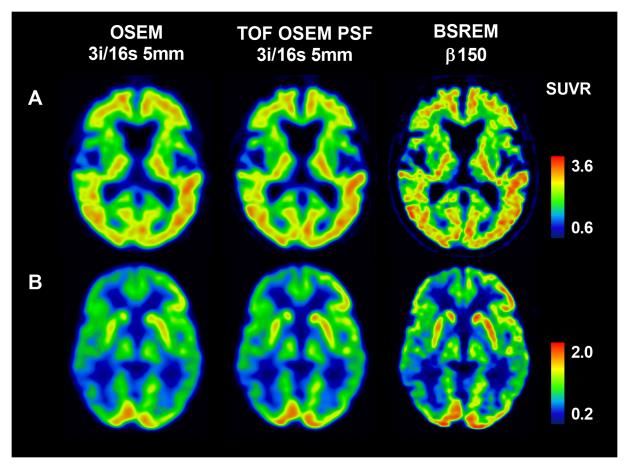
Dissertation presented at Uppsala University to be publicly examined in H:son-
Holmdahlsalen, Akademiska sjukhuset, Dag Hammarskjölds väg 8, Ing 100/101, 2 tr.,
Uppsala, Friday, 8 April 2022 at 09:00 for the degree of Doctor of Philosophy. The
examination will be conducted in English. Faculty examiner: Associate Professor Anne
Larsson Strömvall (Department of Radiation Sciences, Umeå University).

Abstract
Lindström, E. 2022. Evaluation of Regularized Image Reconstruction for Clinical Positron
Emission Tomography. Digital Comprehensive Summaries of Uppsala Dissertations
from the Faculty of Medicine 1812. 64 pp. Uppsala: Acta Universitatis Upsaliensis.
ISBN 978-91-513-1425-9.

Positron emission tomography (PET) combined with computed tomography (CT) is a widely
used noninvasive molecular imaging modality with a broad range of clinical applications
in oncology, neurology, and cardiology. Producing imperative image quality and accurate
quantification are important driving forces behind the technological advances within PET image
reconstruction and system development. To ensure clinical quality and to understand how the
modern state-of-the-art PET/CT systems and image reconstruction methods compare with older
systems and reconstruction methods they need to be evaluated and assessed in a clinical setting.
    This thesis summarizes six studies assessing the effect of state-of-the-art image reconstruction
methods and the introduction of digital PET on image quality and quantitative outcomes of
clinical PET scans in oncology, neurology, and cardiology. The overall aim was to evaluate,
optimize, and compare quantitative results of regularized image reconstruction with the current
standard reconstruction method used in routine clinical practice, ordered subsets expectation
maximization (OSEM).
    The optimal setting of regularized image reconstruction by block-sequential regularized
expectation maximization (BSREM) was found to be tracer dependent, and a potential clinical
benefit in terms of image quality measures of BSREM over OSEM was found when applied
for whole-body 18F-FDG, 68Ga-DOTATOC, 18F-fluorde, 11C-acetate, and 68Ga-PSMA-11 PET
imaging. Software-aided assessment of neurodegenerative disease evaluated with 18F-FDG and
18
   F-flutemetamol was affected by image reconstruction methods and should be used with caution
when employing other image reconstruction methods than those used for acquisition of the
normal database. In contrast, changes in reconstruction settings were shown to not implicate
myocardial blood flow (MBF) based on 15O-water PET analyzed using automated software.
This shows that diagnostic MBF cutoff values can be consistently used for 15O-water. Also,
large variations in image noise with three different image reconstruction methods did not impact
quantitative cerebral blood flow (CBF) in white and gray matter volumes of interest with 15O-
water brain PET to any large extent.
    BSREM image reconstruction shows a great potential clinical benefit providing improved
image quality measures with a subsequent possibility of shortening image acquisition durations
and/or lowering amount of radioactivity needed for each examination.

Keywords: Positron emission tomography, PET/CT, molecular imaging, image reconstruction,
regularized reconstruction, quantification, oncology, neurology, cardiology

Elin Lindström, Department of Surgical Sciences, Radiology, Akademiska sjukhuset, Uppsala
University, SE-75185 Uppsala, Sweden.

© Elin Lindström 2022

ISSN 1651-6206
ISBN 978-91-513-1425-9
URN urn:nbn:se:uu:diva-468126 (http://urn.kb.se/resolve?urn=urn:nbn:se:uu:diva-468126)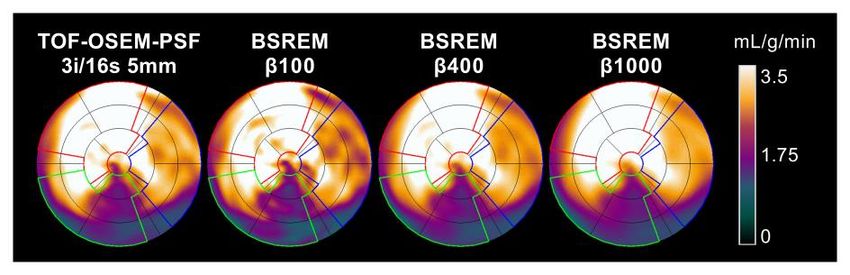
Tillägnad farfar
List of Papers

This thesis is based on the following papers, which are referred to in the text
by their Roman numerals.

      I.   Lindström, E., Sundin, A., Trampal, C., Lindsjö, L., Ilan, E., Danfors,
           T., Antoni, G., Sörensen, J., and Lubberink, M. (2018) Evaluation of
           penalized-likelihood estimation reconstruction on a digital time-of-
           flight PET/CT scanner for 18F-FDG whole-body examinations. Jour-
           nal of Nuclear Medicine, 59:1152–1158

     II.   Lindström, E., Lindsjö, L., Sundin, A., Sörensen, J., and Lubberink,
           M. (2020) Evaluation of block-sequential regularized expectation
           maximization reconstruction of 68Ga-DOTATOC, 18F-fluoride, and
           11
             C-acetate whole-body examinations acquired on a digital time-of-
           flight PET/CT scanner. European Journal of Nuclear Medicine and
           Molecular Imaging: Physics, 7:40

    III.   Lindström, E., Velikyan, I., Regula, N., Alhuseinalkhudhur, A.,
           Sundin, A., Sörensen, J., and Lubberink, M. (2019) Regularized re-
           construction of digital time-of-flight 68Ga-PSMA-11 PET/CT for the
           detection of recurrent disease in prostate cancer patients.
           Theranostics, 9:3476-3484

 IV.       Lindström, E., Oddstig, J., Danfors, T., Jögi, J., Hansson, O., and Lub-
           berink, M. (2020) Image reconstruction methods affect software-
           aided assessment of pathologies of [18F]flutemetamol and [18F]FDG
           brain-PET examinations in patients with neurodegenerative diseases.
           NeuroImage: Clinical, 28:102386

    V.     Nordström, J.*, Lindström, E.*, Kero, T., Sörensen, J., and Lubberink,
           M. (2022) Influence of image reconstruction on quantitative cardiac
           15
             O-water PET/CT. In revision in Journal of Nuclear Cardiology

 VI.       Lindström, E., Sousa, JM., and Lubberink, M. Noise equivalent count
           rate dependent regularized image reconstruction of dynamic 15O-wa-
           ter brain PET. Manuscript
*
Authors contributed equally to this work
Reprints were made with permission from the respective publishers.
List of Additional Papers

The following papers are not included in the thesis.

   i.   Mitran, B., Güler, R., Roche, F.P., Lindström, E., Selvaraju, R.K.,
        Fleetwood, F., Rinne, S.S., Claesson-Welsh, L., Tolmachev, V., Ståhl,
        S., Orlova, A., and Löfblom. J. (2018) Radionuclide imaging of
        VEGFR2 in glioma vasculature using biparatopic affibody conjugate:
        proof-of-principle in a murine model. Theranostics, 8:4462-4476

  ii.   Mitran B, Andersson KG, Lindström E, Garousi J, Rosestedt M, Tol-
        machev V, Ståhl S, Orlova A, and Löfblom J. (2019) Affibody‑medi-
        ated imaging of EGFR expression in prostate cancer using radio-
        cobalt‑labeled DOTA‑ZEGFR:2377. Oncology Reports, 41:534-542

 iii.   Regula N, Kostaras V, Johansson S, Trampal C, Lindström E, Lub-
        berink M, Velikyan I, and Sörensen J. (2020) Comparison of 68Ga-
        PSMA-11 PET/CT with 11C-acetate PET/CT in re-staging of prostate
        cancer relapse. Scientific Reports, Mar 19;10(1):4993

 iv.    Sigfridsson, J., Lindström, E., Iyer, V., Holstensson, M., Velikyan, I.,
        Sundin, A., and Lubberink, M. (2021) Prospective data-driven respir-
        atory gating of 68Ga -DOTATOC PET/CT. European Journal of Nu-
        clear Medicine and Molecular Imaging: Research, 11:33

  v.    Kvernby, S., Korsavidou Hult, N., Lindström, E., Sigfridsson, J.,
        Linder, G., Hedberg, J., Ahlström, H., Bjerner, T., and Lubberink, M.
        (2021) Comparison of data-driven gating with external hardware-gat-
        ing for 18F-FDG PET-MRI in patients with esophageal tumors. Euro-
        pean Journal of Hybrid Imaging, 5:5

 vi.    Regula, N., Kostaras, V., Johansson, S., Trampal, C., Lindström, E.,
        Lubberink, M., Iyer, V., Velikyan, I., and Sörensen, J. (2022) Com-
        parison of 68Ga-PSMA PET/CT with fluoride PET/CT for detection
        of bone metastatic disease in prostate cancer. In press in European
        Journal of Hybrid Imaging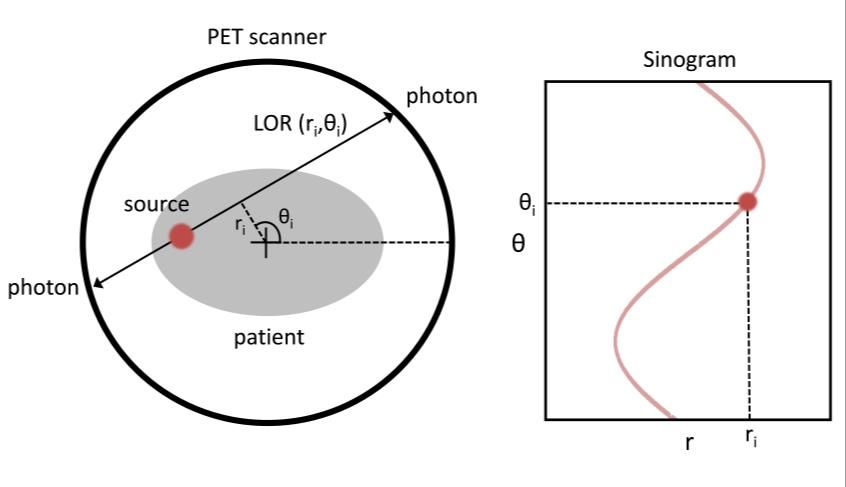
Contents

1.      Introduction ......................................................................................... 11
     1.1.     Aim ............................................................................................. 11
2.      Background and Theory ...................................................................... 13
     2.1.     Positron Emission Tomography ................................................. 13
     2.2.     Image Reconstruction ................................................................. 15
        2.2.1. Statistical Iterative Reconstruction ........................................ 16
        2.2.2. Point Spread Function............................................................ 18
        2.2.3. Time of Flight ........................................................................ 18
     2.3.     Clinical Application ................................................................... 19
     2.4.     Quantification ............................................................................. 20
        2.4.1. Standardized Uptake Value ................................................... 20
        2.4.2. Kinetic Modeling ................................................................... 21
     2.5.     Image Quality ............................................................................. 22
        2.5.1. Spatial Resolution .................................................................. 23
        2.5.2. Measuring Image Quality ...................................................... 23
3.      Materials and Methods ........................................................................ 25
     3.1.     Subjects ...................................................................................... 25
     3.2.     PET Scanner ............................................................................... 26
     3.3.     Image Acquisition and Reconstruction....................................... 26
        3.3.1. Whole-Body Imaging ............................................................ 27
        3.3.2. Brain Imaging ........................................................................ 27
        3.3.3. Cardiac Imaging..................................................................... 27
        3.3.4. Optimizing Dynamic Regularized Reconstruction ................ 28
     3.4.     Image Analysis ........................................................................... 31
        3.4.1. Whole-Body Imaging ............................................................ 31
        3.4.2. Brain Imaging ........................................................................ 31
        3.4.3. Cardiac Imaging..................................................................... 31
        3.4.4. Optimizing Dynamic Regularized Reconstruction ................ 32
     3.5.     Statistical Analysis ..................................................................... 32
4.      Results ................................................................................................. 33
     4.1.    Whole-Body Imaging ................................................................. 33
     4.2.    Brain Imaging ............................................................................. 37
     4.3.    Cardiac Imaging ......................................................................... 38
     4.4.    Optimizing Dynamic Regularized Reconstruction ..................... 39
5.      Discussion............................................................................................ 41
     5.1.    Whole-Body Imaging ................................................................. 41
     5.2.    Brain Imaging ............................................................................. 43
     5.3.    Cardiac Imaging ......................................................................... 43
     5.4.    Optimizing Dynamic Regularized Reconstruction ..................... 44
     5.5.    General Remarks ........................................................................ 45
6.       Conclusions ......................................................................................... 46
7.       Future Perspectives .............................................................................. 47
Popular Science Summary ............................................................................ 49
Populärvetenskaplig Sammanfattning .......................................................... 51
Acknowledgments......................................................................................... 53
References ..................................................................................................... 55
Appendix A ................................................................................................... 63
  Count dependent regularized image reconstruction ................................. 63
    Introduction ......................................................................................... 63
    Materials and Methods ........................................................................ 63
    Results ................................................................................................. 64
    Discussion............................................................................................ 64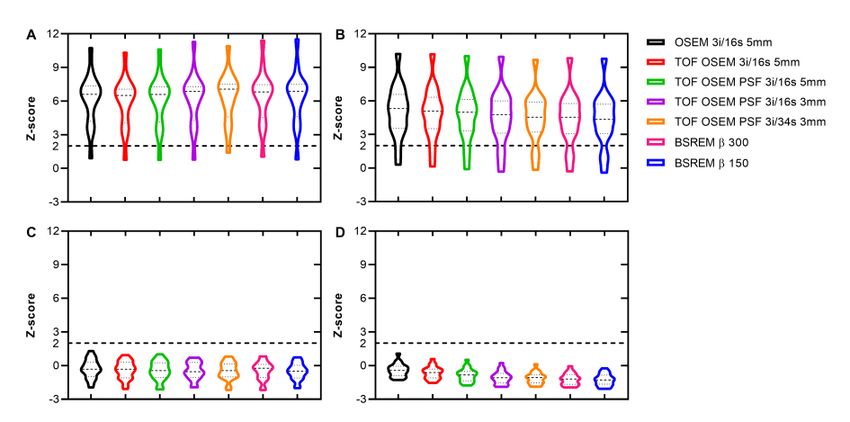
Abbreviations

1TCM       Single tissue compartment model
AI         Artificial intelligence
BSREM      Block sequential regularized expectation maximization
CBF        Cerebral blood flow
CS         Centrum semiovale
DOTATOC    Somatostatin receptor ligand
FDG        Fluorodeoxyglucose
FOV        Field of view
FWHM       Full width at half maximum
CNR        Contrast to noise ratio
CT         Computed tomography
i          Iteration
LAD        Left anterior descending artery
LCX        Left circumflex artery
LOR        Line of response
LV         Left ventricle
MBF        Myocardial blood flow
MBFt       Transmural myocardial blood flow
MLEM       Maximum likelihood expectation maximization
OSEM       Ordered subsets expectation maximization
PCa        Prostate cancer
PET        Positron emission tomography
PTF        Perfusable tissue fraction
PSF        Point spread function
PSMA       Prostate specific membrane antigen
PTF        Perfusable tissue fraction
RCA        Right coronary artery
s          Subset
SBR        Signal to background ratio
SNR        Signal to noise ratio
SUV        Standardized uptake value
SUVmax     Maximum standardized uptake value
SUVmean    Mean standardized uptake value
SUVSD      Standard deviation of standardized uptake value
TOF        Time of flight
VOI        Volume of interest
10
1. Introduction

Positron emission tomography (PET) combined with computed tomography
(CT) is a widely used noninvasive molecular imaging modality with a broad
range of clinical applications in oncology, inflammatory disease, neurology,
and cardiology. A PET/CT system can be used to identify and quantify phys-
iologic and pathologic processes within the body and has therefore become a
vital tool within initial diagnostics and therapy monitoring.
    Tremendous developments in PET instrumentation and software design
have pushed sensitivity and spatial resolution of PET imaging to increase
manyfold since the first systems were installed 50 years ago. The advancement
of computational power and detector technology has led to an overall im-
provement of quantitation accuracy of tracer uptake. The increased computer
power in particular has allowed for iterative reconstruction of PET data to be
feasible in a clinical setting and in the last couple of years there has been fur-
ther development within iterative image reconstruction. A regularized recon-
struction algorithm, block-sequential regularized expectation maximization
(BSREM), has become available for clinical PET image reconstruction. With
its noise modeling properties, this algorithm allows for an excellent tradeoff
between image quality and quantitative accuracy, moderated by a regulariza-
tion factor. However, the main challenge is the selection of the regularization
parameter.
    Producing imperative image quality is of course a big driving force behind
the technological advances, but so are lowering manufacturing costs, improv-
ing usability in routine clinical practice, shortening of image acquisition dura-
tions, and lowering amount of radioactivity needed for each examination.
    To ensure clinical quality and to understand how the modern state of the
art PET/CT systems compare with older systems they need to be evaluated
and assessed in a clinical setting.

1.1.     Aim
This thesis summaries six studies assessing the effect of state-of-the-art image
reconstruction methods and the introduction of digital PET on image quality
and quantitative outcomes of clinical PET scans in oncology, neurology, and
cardiology. The overall aim was to evaluate, optimize, and compare

                                                                               11
quantitative results of regularized image reconstruction with the current stand-
ard reconstruction method used in routine clinical practice.
Paper I-III focus on whole body imaging with five different PET-tracers com-
monly used clinically: 18F-FDG, 18F-fluoride, 11C-acetate, 68Ga-DOTATOC
and 68Ga-PSMA-11. The aim was to evaluate image quality measures in rela-
tion to the applied regularization factor of regularized image reconstruction
and acquisition time, together with visual assessments of image quality.
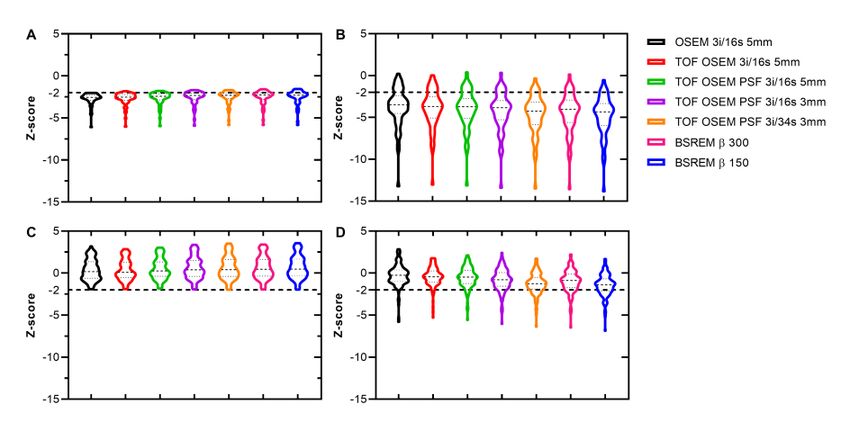
In Paper IV the aim was to evaluate how some of the improved PET image
reconstruction methods affect software-aided assessment of pathology in pa-
tients with neurodegenerative diseases using 18F-FDG and 18F-flutemetamol.
Specific outcome measures assessed were standardized uptake value ratios
(SUVR) and z-scores.
Quantitative 15O-water cardiac imaging measures were assessed in Paper
V. The aim was to evaluate the influence of regularized image reconstruction
and other reconstruction settings on myocardial blood flow (MBF), perfusable
tissue fraction (PTF), and transmural MBF (MBFt) used for assessing myo-
cardial ischemia.
Further on, in Paper VI, the aim was to assess the noise properties of dy-
namic 15O-water brain PET and develop regularized reconstruction by utiliz-
ing the noise equivalent count (NEC) for determining the BSREM regulariza-
tion factor for each frame to achieve a stable noise level throughout the dy-
namic acquisition. Then assess how the NEC dependent regularized recon-
struction affect quantitative measures of cerebral blood flow (CBF).
122. Background and Theory
2.1. Positron Emission Tomography
PET is a molecular imaging modality that can be used to quantify physiologic
and pathologic processes by tracing radiolabeled molecules in vivo.
PET methodology is based on coincidence detection of annihilation photon
pairs emitted in opposite directions in positron decays. The positrons produced
from radioactive decay travel a short distance before annihilating with elec-
trons. The annihilation generates two 511 keV photons traveling in opposite
direction of each other and the PET scanner counts these coincident events
between pairs of detectors. The straight line connecting the centers of two de-
tectors is called a line of response (LOR) and photon pairs recorded for a
specific LOR arise from annihilation events located along that LOR. The de-
tected events are usually stored in projection space represented in sinograms.
Sinograms are 2D histograms containing the angular and radial coordinate that
specifies the angle and orthogonal distance from the center of the field of view
(FOV) to the LOR (Figure 1). The detected events can also be stored in list
mode, which is a format that contains additional spatiotemporal information
that is otherwise lost in sinograms, i.e., the detector coordinates and the arrival
time for each event.
Figure 1. Schematic illustration of PET scanner with point source and corresponding
sinogram.
13Figure 2. Schematic illustration of three PET coincidence detections: trues,
scattered, and randoms, from left to right respectively.
PET imaging utilizes properties of isotopes that decay by positron emission.
Such radioactive isotopes, or radionuclides, are neutron deficient and a proton
within the nuclei decay into a neutron, which causes emission of a neutrino
and a positron. There are some commonly used radionuclides for clinical di-
agnostics with PET, namely, 15O, 11C, 68Ga, and 18F. These radionuclides are
produced in cyclotrons or generators with half-lives ranging from 2 min for
15
O to 109 min for 18F. The measured PET data is corrected for the physical
decay of the radionuclide.
The PET scanner detects and register prompt counts, which consists of true,
scattered, and random coincidence events. Thus, not all detected events origi-
nate from true coincidence events. Scattered and random coincidence events
result in LORs that do not correspond to a real annihilation event, illustrated
in Figure 2. Scatter fraction and random event estimations are therefore used
to correct the PET data from such events and prevent additional noise to some
extent (1,2).
Dead time is the time between detection and signal output, where the sys-
tem is occupied and uncapable of registering another event – leading to event
losses. At high counting rates, another contributing factor to loss of resolution
is pulse pile-up. A pulse pile-up occurs when the system is unable to identify
and separate two or more events taking place within the same detector module.
Modeling of both dead time and pile up can be used to correct the PET data
for these effects.
PET-systems today are combined with either computer tomography (CT)
or magnetic resonance imaging (MRI) and thereby provide both anatomical
and functional imaging. Combined PET/CT systems allow for CT-based at-
tenuation correction. A large degradation of PET data is caused by attenuation
of the photons within the body where interactions cause a loss of energy. To
account for this behavior, an attenuation-based CT map can be used to gener-
ate attenuation coefficients for each individual projection (3,4).
14Analog PET/CT systems use detectors with scintillation crystals coupled to
photomultiplier tubes (PMT). The high signal gain of the PMTs made them
the most widely used PET detector component for many decades. Solid state
photodetectors, silicon photomultipliers (SiPMs), gained interest as substitute
for PMTs for being compact and insensitive to magnetic fields during the de-
velopment of combined PET and MRI systems (5–7). Other benefits of the
SiPM detectors are excellent timing resolution and a digital readout. Figure 3
demonstrates some of the differences in design and bulkiness between the
PMT and SiPM detectors. Studies evaluating the performance of SiPM com-
pared to PMT have reported improved detection of small lesions (8) and in-
creased standardized uptake value (SUV) (9). Today, several digital PET/CT
systems from different manufacturers are available (10–12).
Figure 3. Concept images of an analog detector with a scintillation crystal block cou-
pled to four photomultiplier tubes on the left and a digital detector with a scintillation
crystal block coupled to SiPMs on the right. Image of SiPM from GE Healthcare.
2.2. Image Reconstruction
Image reconstruction of PET data is a mathematical process generating 3D
tomographic images from multiple projections that originates from the coin-
cident events detected by the scanner. The resulting images show the spatial
distribution of the radiotracer activity within the object, expressed as activity
concentration (Bq/mL). Analytic image reconstruction methods assume that
the PET data is free from noise and offer a direct mathematical solution for
the formation of an image. In contrast, iterative methods are based on a more
complicated mathematical solution requiring multiple steps and computa-
tional power to arrive at an image.
15Analytic reconstruction methods describe the formulation of an image as a
linear inverse problem such that
, Eq. 1
where is the measured projection data, is the imaging system matrix, and
defines the vector of the unknown image. Instead, iterative image recon-
struction models the statistical behavior of the imaging system, expressed as
the expected value of as a random variable,
. Eq. 2
2.2.1. Statistical Iterative Reconstruction
Iterative reconstruction algorithms started playing a central role in clinical PET
many years after being first mentioned in the late 1970s and early 1980s (13,14).
Although computationally more intensive than analytical methods, statistical it-
erative reconstruction methods for emission data are preferred due to the more
accurate noise model where the measured projection data are described by Pois-
son statistics. Statistical iterative reconstruction also enables the ability of in-
cluding an accurate system model into the reconstruction process.
The Poisson random variables can be modeled with the Poisson loglikeli-
hood function which is maximized using an expectation maximization (EM)
algorithm (14), with the goal of computing the maximum likelihood (ML) es-
timate of the tracer distribution based on the measured projection data. The
general concept of EM starts with an initial image estimate that is being for-
ward projected and compared with the measured projection data. The differ-
ence between the two sets of projections is then back projected and applied to
the initial image estimate producing an updated image that better matches the
measured projection data. The estimated image gradually converges towards
the true image. The MLEM method of forming an image by means of succes-
sive estimates is the basis of standard reconstruction methods for clinical PET
data used today. However, two main issues with the standard MLEM were
addressed to ensure clinical usefulness, namely, slow convergence rates and
resulting noisy images.
Rather than using the entire image data set for each iterative image update,
the process of forming an image can be accelerated by dividing the objective
function into subobjective functions using only a subset of the data (15–17).
The approach referred to as ordered subsets expectation maximization
(OSEM), will increase the convergence rate, particularly during the first few
iterations where the increase is almost linear with respect to the number of
subsets (15).
16The noise propagates with each iteration of both MLEM and OSEM result-
ing in unacceptable levels of image noise if too many iterations are used. The
noise propagates as a result of the characteristics of the EM algorithm to
strictly enforce agreement with the measured noisy projection data (14,18).
Stopping prior to convergence and filtering applied post reconstruction are
common approaches to reduce the excessive noise introduced in the iterative
reconstruction process. There are several different methods of filtering, and
many have been investigated for PET post reconstruction processing. The
ideal size of the smoothing kernel, expressed as full width at half maximum
(FWHM), regarding image quality depends on the type of smoothing filter
that is applied. The conventional choice is a Gaussian filter. However, termi-
nating the iterative process and applying filtering will lead to a bias and non-
uniform convergence in the final image estimate.
Regularized Reconstruction
Another option to regulate noise propagation is to add a roughness penalty to
the ML, which will allow for fully convergent iterative reconstruction. The
objective function for estimating from the measured projection data can
then be described as the Poisson log likelihood combined with a
roughness penalty according to
Eq. 3
In Eq. 3, is a positive regularizing parameter that controls the strength of
. Quadratic and nonquadratic penalties have been suggested for recon-
struction of emission data previously, although often resulting in either over-
smoothed edges with a quadratic penalty or patchy artifacts in the final image
with a nonquadratic penalty. The relative difference penalty function (19) is a
nonquadratic edge preserving penalty that was developed to improve quanti-
tative accuracy while maintaining an equally good visual image quality as the
OSEM reconstruction method that was currently used for clinical PET. The
relative difference penalty can be described as the following:
Eq. 4
where denotes the number of voxels. The relative difference is calculated
between each voxel and its neighboring voxels in the set of neighbors ,
and represent weights and depend on the distance between the neigh-
boring voxels, and in the potential function regulates the level of edge
17preservation. To facilitate a uniform spatial resolution in the resulting image
the relative difference penalty account for sensitivity variations throughout the
FOV (20). The β and factors in Eq. 3 and 4 control the trade-off between
noise and resolution. The -value is predetermined (21) whereas the β-value
is a user input variable in the commercially available version of the Q.Clear
software (GE Healthcare) utilizing BSREM (22). The BSREM algorithm is
used for maximizing the objective function described in Eq. 3 (23,24) in a
similar way as OSEM is used to maximize ML. However, BSREM can run
until full convergence is reached (24).
2.2.2. Point Spread Function
Iterative reconstruction enables modeling of the system properties to be in-
cluded in the reconstruction process. Resolution recovery modeling, describ-
ing the relationship between image space and projection space, is derived from
point source measurements at different positions of the scanner FOV. The re-
sulting point spread function (PSF) is then represented in the system matrix
and can also include factors such as depth dependent sensitivity and spatially
variant detector response (25,26).
2.2.3. Time of Flight
Time of flight (TOF) information is being used to localize the annihilation
point along the LOR and the distance from the LOR center point is deter-
mined by Eq. 5, where is the velocity of light and is the time difference
between detection of photons.
Eq. 5
The inclusion of TOF in image reconstruction improves the signal to noise
ratio (SNR) and the shorter the coincidence timing resolution of the system,
the more precisely the distance can be determined and thereby the greater
the improvement in signal to noise ratio (Figure 4) (27,28). The first commer-
cialized PET system utilizing TOF came in 2006 (29,30) even though the idea
of using TOF information originates from the very beginning of PET in the
late 1960s (31,32).
18Figure 4. Schematic illustration of timing resolution PET with LORs from a point
source (top row) and a corresponding probability function of the location of an event
(bottom row) compared to conventional non-TOF PET.
2.3. Clinical Application
Clinical PET/CT examinations are used for patient diagnostics, treatment de-
cision, assessment of disease progression and therapy response monitoring in
oncology, neurology, and cardiology. The modality is also used in research
for pharmacokinetics investigation and drug development.
Prior to a PET scan, the patient is injected with a tracer, consisting of a
radionuclide labeled to a targeting agent. In Figure 5, characteristic tracer dis-
tributions of five frequently used tracers in oncology are shown. Molecular
imaging by PET/CT has enabled unique noninvasive assessment of tumor bur-
den and disease progression within oncology allowing for treatment follow-
up and radiotherapy planning. The 18F-FDG tracer is a radiolabeled glucose
analogue that is being phosphorylated within cells. The tracer uptake reflects
the tissue glucose metabolism, which is usually high in malignancies, but this
is a condition that can also be true for areas of inflammation. Although 18F-
FDG is by far the most used tracer for PET imaging in oncology there is also
a need for alternate tracers that can be used for targeting other aspects of spe-
cific cell biology. In prostate cancer (PCa), tracers such as 11C-acetate, 18F-
fluoride, and 68Ga-PSMA-11 are being utilized as PCa is typically a slow
growing disease with low glucose metabolism. In contrast to many other can-
cer cells, PCa cells exhibit an increased lipid metabolism over glucose metab-
olism and 11C-acetate can therefore be used to target cell membrane lipid me-
tabolism (33–36). 18F-Fluoride is characterized by bone-specific uptake and
rapid blood clearance and is used to visualize bone metastases in PCa among
other cancers (37). The new standard of care for assessing PCa recurrence is
19Figure 5. Maximum intensity projections of 18F-FDG, 11C-acetate, 68Ga-DOTATOC, 68 Ga-PSMA-11, and 18F-fluoride PET. imaging of prostate specific membrane antigen (PSMA), which is upregulated in prostate tissue (38–40). Like PCa cells, neuroendocrine tumors exhibit low metabolic activity (41). In contrast, neuroendocrine tumors are characterized by cellular overexpression of somatostatin receptors and radiolabeled soma- tostatin analogs, like 68Ga-DOTATOC, are used for diagnosing and monitor- ing therapy response (42,43). Brain PET imaging for assessing neurodegenerative disease is another large domain of PET in addition to whole body oncology. For example, 18F- FDG is used for imaging of regional cerebral glucose metabolism to provide a measure reflecting the general brain function (44) and 18F-flutemetamol am- yloid imaging along with a number of other tracers is used for diagnosis of Alzheimer’s disease (45). Radiolabeled water, 15O-water, is freely diffusible in tissue and metaboli- cally inactive making it an ideal tracer for measuring perfusion (46,47). Meas- urements of cerebral blood flow (CBF) with 15O-water PET are used for dif- ferentiating between pathologic and healthy brain tissue and assessing brain functionality (48–51). Myocardial perfusion PET imaging with 15O-water is used to provide measurements of myocardial blood flow (MBF) for assessing coronary artery disease and myocardial ischemia (52,53). 2.4. Quantification 2.4.1. Standardized Uptake Value A semiquantitative standardized uptake value (SUV) reflecting tracer uptake is generally used for clinical assessment, especially for 18F-FDG oncology ex- aminations (54,55). SUV is defined as the measured radioactivity concentra- tion normalized to bodyweight divided by administered radioactivity. It is a simple measure without the need for further kinetic modeling or arterial blood 20
sampling which allows for short static image acquisitions at a specific time
point post injection that are suitable for the clinical workflow.
   SUV ratios can be used for reducing the variability of absolute SUVs. The
SUV of lesions or targeted areas are dived by the SUV measured in a reference
region. A reference region should not be pathologically affected and have a
low homogenous uptake and the choice depends on the specific biodistribu-
tion of the tracer and the area of examination.

Figure 6. Schematic illustration of the single tissue compartment model.

2.4.2.          Kinetic Modeling
To study rate of change at the regional or voxel level, dynamic acquisitions,
following the distribution of the tracer over time, are required. Dynamic ac-
quisitions are performed on a frame-by-frame basis where the early time bins
are kept short to capture the fast kinetics following injection of the tracer. The
tracer kinetics can then be estimated by compartmental modeling. The single
tissue compartment model (1TCM) is the simplest model, schematically illus-
trated in Figure 6, and described by the first order differential equation in Eq.
6. Here,      and      are the radioactivity concentration in arterial blood and
tissue compartment, respectively, and         and are rate constants.

                                                                           Eq. 6

   The first rate constant,       , represents the uptake rate, describing the
transport of the tracer from the blood compartment to the tissue compartment.
The second rate constant, , represents the clearance rate. The solution to Eq.
6 is given by

                                                         ,                 Eq. 7

where denotes the convolution operator. The tissue activity concentration
in a volume of interest (VOI) measured by PET will contain a fractional arte-
rial blood volume     and can be described by

                                                                               21
Eq. 8
The 1TCM with is an appropriate model of tracers exhibiting a re-
versible tissue uptake without further interaction of the tracer within the tissue
(e.g., receptor binding), which can be used to describe the kinetics of 15O-
water owing to its freely diffusible and metabolically inert characteristics
(46,47). Parameter estimates can be obtained by nonlinear least squares fitting
methods. In this thesis, parametric images are computed using a basis function
implementation of the 1TCM.
Parametric CBF images are constructed by using an arterial input function
corrected for dispersion and delay due to the distant sampling site (50). For
tracers with high extraction fraction relative to the blood flow, such as 15O-
water, CBF is approximately equal to . In contrast, myocardial perfusion
imaging with 15O-water uses for estimating MBF. Because 15O-water is
freely diffusible, MBF is present in both and according to
× × , Eq. 9
with and representing the fractional blood volume and spill-over of
the left and right ventricle. The partition coefficient of water in myocardial
tissue is known (56) allowing for estimation of perfusable tissue fraction
(PTF). The PTF parameter is defined as the fraction of water-perfusable tissue
within a given VOI that also accounts for both spill over and partial volume
effects. The clearance rate provides a more robust measure than the uptake
rate, since the amplitude of the time activity curve is affected by attenuation
correction discrepancies and non-perfusable tissue to a larger extent. Moreo-
ver, is affected by partial volume effects in contrast to . is referred
to as transmural blood flow (MBFt) and obtained by multiplying PTF with
MBF and dividing by .
Additional tissue compartments may be needed to describe a more complex
kinetic process.
2.5. Image Quality
There are both biological and physical parameters affecting the overall PET
image quality, which ultimately impact quantitative accuracy and lesion de-
tectability.
222.5.1. Spatial Resolution
PET spatial resolution is in the range of a few millimeters. Physical factors
such as positron range in tissue, acollinearity of the annihilation photons, size
of detector blocks, as well as depth of interaction all contribute to limit the
effective spatial resolution of PET (57). As mentioned earlier, spatial resolu-
tion is improved using SiPM detectors compared to conventional PMTs, and
the effective sensitivity is improved by TOF capable scanners resulting in
higher timing resolution. Geometric resolution depends, among else, on the
axial FOV, with increasing resolution the longer the FOV.
2.5.2. Measuring Image Quality
For simulation of whole-body imaging and evaluation of reconstructed image
quality in whole-body PET, a National Electrical Manufacturers Association
(NEMA) image quality body phantom is recommended (58). A NEMA phan-
tom consists of a body phantom with a lung insert and six spheres with various
sizes ranging from 10 to 37 mm in diameter. For similar purposes, a Hoffman
3D brain phantom is recommended for brain acquisitions (59). The spheres
and background volume of the NEMA phantom are filled separately allowing
for the user to decide on the sphere to background ratio, while the Hoffman
phantom, having a single fillable compartment, always simulates a 4:1 uptake
ratio between the gray and white matter. Example PET images obtained from
NEMA and Hoffman scans are displayed in Figure 7. The acquired phantom
data is used to estimate image quality and quantitative accuracy measures,
such as background noise and contrast recovery.
Monte Carlo simulations are another option that can simplify the process
of optimizing acquisition parameters and reconstruction methods apart from
phantom scans.
Figure 7. 18F-FDG PET images of NEMA image quality phantom on the left and
Hoffman 3D brain phantom on the right.
In clinical scans the image quality can be assessed by image metrics such as
background noise, signal to background ratio (SBR), and signal to noise ratio
(SNR). Background noise is commonly estimated by the standard deviation
(SD) in a background or reference tissue with homogenous uptake, and SBR
23and SNR are estimated by the uptake in a region of interest, such as a lesion, normalized to a reference tissue, e.g., liver or blood pool. Observer evaluations are complimentary measures of image quality that pose an important clinical relevance. There are many different observer eval- uation methods that have been used in previous studies where the number of quality criteria and grading scales vary (60–63). However, many observers and large quantities of images may need to be included in such assessments to differentiate between subtle differences in image quality. Also, if there is no ground truth available, observer evaluations of image quality are subjective to the observers participating in the evaluation. 24
3. Materials and Methods
3.1. Subjects
In Paper I-II, PET/CT raw data from whole-body examinations with 18F-FDG
(n = 11), 18F-fluoride (n = 10), 11C-acetate (n = 13), and 68Ga-DOTATOC (n
= 13) were collected from existing records. The cohorts consisted of oncologic
patients with additional suspected inflammatory disease patients in the group
scanned with 18F-FDG. The subjects in Paper III (n = 20) were included in a
prospective evaluation on the clinical benefits of whole-body 68Ga-PSMA-11
PET/CT (Ethical approval 2017-190) in PCa patients (64).
Paper IV was a collaborative study between Uppsala University Hospital
and Skåne University Hospital. The study included 16 prodromal Alzheimer’s
disease (AD) patients, 20 healthy volunteers, 20 (12 included in the analysis)
patients referred for dementia evaluation, and 13 melanoma patients without
brain involvement. The first two cohorts underwent 18F-flutemetamol PET/CT
examinations while the latter two cohorts underwent 18F-FDG PET/CT exam-
inations. The 18F-flutemetamol patients were scanned in Skåne and are in-
cluded in the Swedish BioFINDER 2 study (Ethical approval 2016-1053 and
Clinical Trials reference NCT03174938) and 18F-FDG patients were clinical
routine examinations in Uppsala.
Paper V included 20 clinical stress scans from patients referred for assess-
ment of myocardial ischemia with 15O-water PET/CT.
In Paper VI, raw data from 15O-water brain PET/CT examinations (n = 13)
were included. The subjects were originally included in a completed clinical
research study at Uppsala University with approval from the Medical Ethics
Review Board in Uppsala (reference number 2014-453).
An ethical application was approved by the regional Ethical Review Author-
ity in Uppsala for the second, fourth, fifth, and sixth study (reference number
2019-00092), allowing for the inclusion of more detailed information on patient
diagnosis. All image data were anonymized prior to processing and analysis,
and the reconstructed images were not used for clinical image reading.
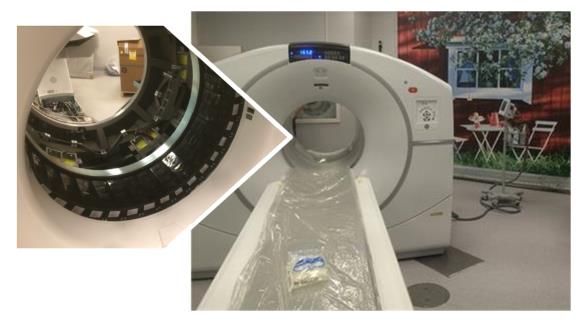
253.2. PET Scanner A Discovery MI digital TOF PET/CT scanner (GE Healthcare) was used throughout all six studies included in the thesis (Figure 8). The scanner has lutetium yttrium oxyorthosilicate scintillation crystals in 4 × 9 arrays coupled to SiPM detectors in 3 × 6 arrays (LightBurst Digital detectors, GE Healthcare). Each ring comprising 136 such detector blocks. The timing res- olution of the scanner is approximately 370 ps, sensitivity is 14 cps/kBq, and intrinsic spatial resolution is about 4.0 mm at the center of the FOV, with a 4- ring configuration (10). All studies summarized in this thesis include data acquired on a system with 4 detector rings except Paper V that include data acquired on a 5-ring system. Both configurations provide a 70-cm transaxial FOV, and 20 and 25- cm axial FOV producing 71 and 89 image planes, with the 4 and 5-ring con- figuration respectively, with a 2.8-mm slice thickness. Figure 8. One of the Discovery MI PET/CT scanners at Uppsala University Hospital with the ring of detectors showing without the outer shell during installation on the left. Photographs taken by Mark Lubberink and Ezgi Ilan 2017. All image reconstructions were produced using the manufacturer’s imaging system software (Columbia PET), with an additional MATLAB based re- search image reconstruction toolbox (Duetto v02.06, GE Healthcare) used in the last study (Paper VI). The Duetto toolbox uses algorithms that are identical to those used with the Discovery MI PET/CT system software. All appropriate corrections including CT-based attenuation correction were applied to the raw data as included in the scanner software. 3.3. Image Acquisition and Reconstruction Acquisition parameters, reconstruction methods and variables for all tracers and types of examinations included in this thesis are displayed in Table 1. 26
3.3.1. Whole-Body Imaging
NEMA image quality body phantom (58) scans were performed in Paper I and
II. The phantom was filled with 18F and 68Ga in a 4:1 and 4:1.3 sphere to back-
ground ratio, respectively, and scanned until 100 M prompt counts.
The whole-body PET/CT examinations were performed according to rou-
tine clinical protocols from the mid-thigh to the base of the skull. Transaxial
FOVs of 500 and 700 mm were used together with an image matrix of 256 ×
256, resulting in 1.95 × 1.95 × 2.79 and 2.73 × 2.73 × 2.79 mm3 voxels, re-
spectively. The whole-body acquisitions were performed in list mode and re-
binned using a small portion of the data into three sets of bed position dura-
tions for each tracer.
Phantom and whole-body images were reconstructed using the standard
OSEM settings recommended by the manufacturer (3 iterations, 16 subsets,
and a 5-mm Gaussian filter) and BSREM, both including TOF and PSF re-
covery. The BSREM reconstructions were generated with the same or a subset
of β-values for all acquisition durations in Paper I and II while a subset of β-
values was used for the shorter acquisition durations in Paper III.
3.3.2. Brain Imaging
18
F-Flutemetamol examinations, both patients and controls, were acquired as
20-min static scans starting approximately 90 min after injection. 18F-FDG
patient examinations were acquired as 10-min static scans starting approxi-
mately 45 min after injection, while the 18F-FDG control cohort of melanoma
patients underwent a whole-body scan, of which the 2-min static scan of the
brain bed position starting approximately 90 min after injection of 18F-FDG
was used.
A transaxial field of view of 250 mm and a 256 × 256 image matrix resulted
in 0.98 × 0.98 × 2.79 mm3 voxels. Images were reconstructed by OSEM (±
TOF, ± PSF, 3 iterations, 16/34 subsets, and 3/5 mm Gaussian post processing
filter) and BSREM with β 75-300) (including TOF and PSF).
3.3.3. Cardiac Imaging
Cardiac stress scans were acquired as a 4-min dynamic series of 20 frames (1
× 10, 8 × 5, 4 × 10, 2 × 15, 3 × 20, 2 × 30 s) starting simultaneously with
automated bolus injection of 400 MBq 15O-water. A continuous infusion of
adenosine (140 μg/kg/min) was used to induce hyperemic MBF.
A transaxial field of view of 500 mm and a 192 × 192 image matrix resulted
in 2.6 × 2.6 × 2.79 mm3 voxels. Images were reconstructed using OSEM with
different numbers of iterations, filter sizes, as well as with and without PSF
recovery, and BSREM including PSF and β-values between 100 and 1000. In
total, 21 different reconstructions per patient were acquired. The clinical
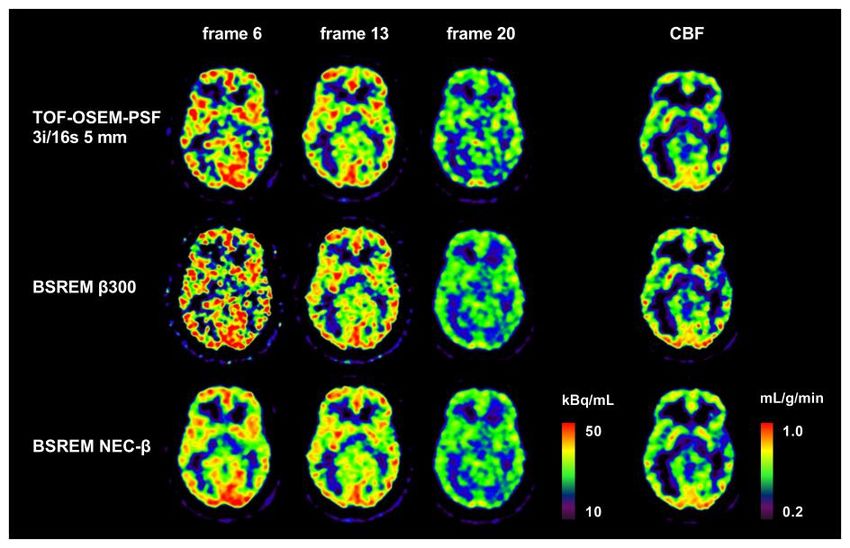
27reconstruction used at our center (TOF-OSEM-PSF 3 iterations, 16 subsets, and a 5-mm Gaussian filter) was used as the reference. 3.3.4. Optimizing Dynamic Regularized Reconstruction A Hoffman 3D brain phantom (59) scan was performed in Paper VI. The phan- tom was filled with 20 MBq of 18F and scanned for a total of 45 min in list mode and re-binned into files with 0.5, 1, 1.8, 2.8, 3.8, 5, 10, 15, 25, 50, 75, and 100 million prompt counts, as well as a dynamic series consisting of 26- time frames, mimicking a clinical dynamic 15O-water acquisition regarding number of prompt counts in each frame. Human subject examinations were acquired as 10-min dynamic series of 26-time frames (1 × 10, 8 × 5, 4 × 10, 2 × 15, 3 × 20, 2 × 30, 6 × 60 seconds) starting simultaneously with automated bolus injection of 400 MBq 15O-wa- ter. Arterial blood was sampled at 3 ml/min from the radial artery (Veenstra/Comercer, Joure, The Netherlands). In addition, patients also un- derwent a T1-weighted structural MR scan on a 3T Achieva MR scanner (Philips Healthcare). A transaxial FOV of 250-mm and a 128 × 128 image matrix was used, resulting in 1.95 × 1.95 × 2.79 mm3 voxels. Phantom and human subject dy- namic images were reconstructed using the clinical standard method (TOF- OSEM-PSF with 3 iterations, 16 subsets, and a 5-mm Gaussian filter) and two variations of BSREM including PSF (β 300 and NEC-β). BSREM NEC-β The Hoffman phantom data and pooled data from three human subjects was used to establish a relationship between NEC, β-value, and background noise. For this end, images were reconstructed using BSREM with β-values ranging from 25 to 5000. 28
Table 1. Acquisition parameters and reconstruction settings for NEMA image quality body and Hoffman 3D brain phantoms, whole-body, brain,
and cardiac scans.
 Object            PET-tracer       Activity (MBq/kg)       FOV      Acquisition time    Reconstructionsa
                                                            (cm)     (min/bp)
                   18
 NEMA image          F              3 kBq/mL (background)   50       100 M prompts       TOF-OSEM-PSF 3i/16s 5 mm filter
 quality phantom                    11 kBq/mL (spheres)                                  BSREM β 133, 267, 400, 533
                   68Ga             5 kBq/mL (background)   50       100 M prompts
                                    22 kBq/mL (spheres)
 Hoffman 3D        18F              20 MBq                  25       100 M prompts       TOF-OSEM-PSF 3i/16s 5 mm filter
 Brain phantom                                                                           BSREM 25-5000b
                                                                     26 frames           TOF-OSEM-PSF 3i/16s 5 mm filter
                                                                                         BSREM β 300, NEC-βc, T-βd
 WB                18F-FDG          3.7 (5.9e)              50       3                   TOF-OSEM-PSF 3i/16s 5 mm filter
                                                                                         BSREM β 133, 267, 400, 533
                                                            70       3, 2, 1             TOF-OSEM-PSF 3i/16s 3,5 mm filter,
                                                                                         TOF-OSEM-PSF 6i/16s 5 mm filter
                                                                                         BSREM β 133, 267, 400, 533
                   11C-acetate      4.8                     70       3, 2, 1             TOF-OSEM-PSF 3i/16s 5 mm filter
                   18F-fluoride     3.0                     70       2, 1.5, 1           BSREM β 133, 267, 400, 533
                   68Ga-DOTATOC     2.3                     70       2, 1.5, 1
                   68Ga-PSMA-11     2.0                     70       2                   TOF-OSEM-PSF 3i/16s 5 mm filter
                                                                                         BSREM β 100, 200, 300, 400, 500, 600, 700, 800,
                                                                                         900, 1000, 1100, 1200, 1300

                                                                                                                                           29
Object PET-tracer Activity (MBq/kg) FOV Acquisition time Reconstructionsa
(cm) (min/bp)
WB 68Ga-PSMA-11 2.0 70 1 TOF-OSEM-PSF 3i/16s 5 mm filter
BSREM β 800, 1000, 1200, 1400
0.5 TOF-OSEM-PSF 3i/16s 5 mm filter
BSREM β 800, 1000, 1200, 1400, 1600
Brain 18F-FDG 3.2 25 10 min OSEM 3i/16s 5 mm filter
3.7 2 min TOF-OSEM 3i/16s 5 mm filter
18F-flutemetamol
TOF-OSEM-PSF 3i/16,34s 3,5 mm filter
185 MBq 25 20 min
BSREM β 75, 150, 225, 300
15O-water 400 MBq 25 10 min (26 frames) TOF-OSEM-PSF 3i/16s 5 mm filter
BSREM β 300, NEC-βc, T-βd
BSREM β 50-5000b
Cardiac 15O-water 400 MBq 50 4 min (20 frames) TOF-OSEM 1,2,3,4,5,6i/16s 5 mm filter
TOF-OSEM-PSF 1,2,3,4,5,6i/16s 5 mm filter
TOF-OSEM-PSF 3i/16s 3,8 mm filter
BSREM β 100, 200, 300, 400, 600, 800, 1000
aAllBSREM reconstructions included TOF and PSF.
bReconstructions for establishing a relationship between NEC, β-value, and background noise.
cNEC-β refers to BSREM with frame-by-frame NEC dependent β-value.
dT-β refers to BSREM with frame-by-frame trues count dependent β-value presented in Appendix A.
eHigher administered activity for inflammatory disease patients.
FOV: field of view; TOF: time of flight; PSF: point spread function; WB: whole-body; OSEM: ordered subsets expectation maximization; NEC: noise
equivalent count; BSREM: block sequential regularized expectation maximization; T: trues.
303.4. Image Analysis
Several different software tools were used for image analysis: PET/CT Re-
view on an Advantage Workstation (GE Healthcare), CortexID on an Ad-
vantage Workstation server (GE Healthcare), aQuant (MedTrace A/S), as well
as in house developed software in MATLAB. The software tools were used
for PET and CT image co-registration, visualization, VOI delineation, data
base comparison, motion correction, and kinetic modeling.
3.4.1. Whole-Body Imaging
The background variability and contrast to noise ratio (CNR) was evaluated
in the NEMA image quality phantom images.
The image noise level was assessed in whole-body acquisitions, in Paper I-
III, and calculated as SUVSD divided by SUVmean of a spherical reference VOI
placed in normal liver tissue. The image quality was evaluated in terms of
signal-to-noise ratio (SNR) and signal-to-background ratio (SBR) using SU-
Vmax of measured lesions.
The image quality of whole-body 18F-FDG and 68Ga-PSMA-11 scans using
different reconstruction settings was further evaluated in visual assessments
by nuclear medicine physicians. The evaluation setup differed slightly be-
tween the two tracers, where 18F-FDG PET images were evaluated and scored
according to a four-grade scale in seven different categories, while 68Ga-
PSMA-11 PET images were evaluated in two separate parts: tumor counting
and ranking. In both assessments’ images were evaluated in a randomized or-
der and the observers were blinded to the reconstruction method.
3.4.2. Brain Imaging
Using a software-guided diagnostic tool regional SUVR using either whole
brain, whole cerebellum, pons, or cerebellar gray matter as reference regions
was derived and evaluated in Paper IV. The corresponding z-scores from com-
parisons to the normal control databases for 18F-flutemetamol and 18F-FDG
were also evaluated.
3.4.3. Cardiac Imaging
Parametric images were constructed in aQuant software, which uses a basis
function implementation of the single-tissue compartment model with image
derived input function extracted by cluster analysis. Cardiac hyperemic MBF,
PTF and MBFt were evaluated on the global level for the left ventricle (LV)
and for the three major coronary arteries: left anterior descending artery
(LAD), left circumflex artery (LCX), and right coronary artery (RCA). The
analysis was performed using two different methods. In the first method,
31identical myocardial, venous, and arterial VOIs were used for all reconstructed images of each subject. In the second method, all reconstructed images were analyzed separately using automatic segmentation without user intervention. 3.4.4. Optimizing Dynamic Regularized Reconstruction First, the relationship between NEC, β-value, and background noise was es- tablished for developing the NEC dependent BSREM reconstruction method. Secondly, the established reconstruction model was compared against the standard OSEM and BSREM β 300 methods. For definition of image noise, a white matter VOI was automatically de- fined over centrum semiovale (CS) by adjusting a white matter VOI derived using SPM12 (Statistical Parametric Mapping, Wellcome Centre for Human Neuroimaging, London) (65). A white matter mask for the Hoffman phantom was processed in a similar way. Noise was then calculated as SD divided by the mean measured activity concentration in the CS VOI. A relationship be- tween image noise and NEC was established for each β-value using the sum of two power functions. These relationships were then interpolated resulting in a model prescribing the β-value as a function of NEC required to obtain a noise level of 30%. Noise was calculated for each frame of the dynamic series (Hoffman and remaining 10 subjects) and the results were compared between the three re- construction methods. In addition, parametric CBF images of the 10 subjects were computed using a basis function implementation of the single-tissue compartment model including fitted blood volume parameter, with the on-line sampled curve used as input function. Apart from CBF noise, CBF CNR, cal- culated as the difference between gray matter and CS divided by the SD in CS, was also analyzed. 3.5. Statistical Analysis MATLAB and GraphPad Prism was used for graphics and statistical analysis. A paired Student t test was used in Paper I and throughout paper II-VI, a non- parametric Wilcoxon’s signed rank test was used when comparing different reconstruction methods to the reference reconstruction. Statistical significance was considered for P values less than 0.05. When investigating the level of association between relative difference in SUV and lesion volume in Paper I and II, the Spearman rank correlation was used. In Paper IV, an additional post-hoc analysis was performed using a non-parametric Friedman test with corrections for multiple comparisons and effect sizes was assessed with Co- hen’s d. In paper V, Pearson correlation coefficient was calculated using linear regression. 32
4. Results
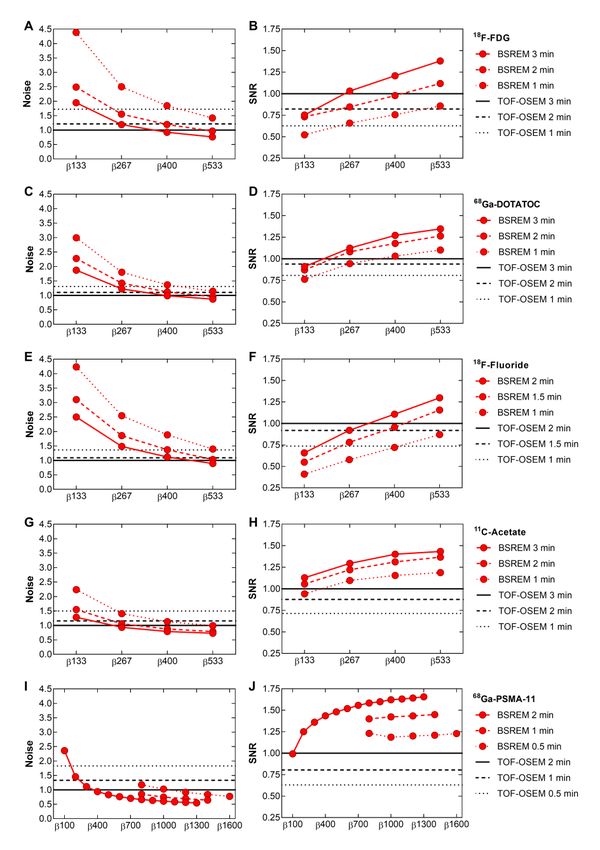
4.1. Whole-Body Imaging
Image quality measures using BSREM with various β-values followed similar
trends for all tracers investigated in Paper I-III regarding whole body acquisitions.
The level of background noise decreased while SNR increased with increasing β-
values (Figure 10). In turn, SBR decreased with increasing β-value, reflecting the
SUVmax of the measured lesions. Figure 9 shows a subject from the 18F-FDG co-
hort and the five evaluated reconstruction methods at full acquisition duration of
3 min per bed position. Decreased acquisition duration required a similar or in-
creased β-value for producing similar or improved image quality measures com-
pared with TOF-OSEM-PSF at a full acquisition duration of 3 or 2 min per bed
position depending on the tracer. The slightly higher β-values evaluated with
68
Ga-PSMA-11 allowed for further reduction of acquisition time to 0.5 min per
bed position with similar or improved noise, SNR, and SBR compared with TOF-
OSEM-PSF. A summary of the BSREM β-values that resulted in a similar image
quality measure, either noise, SNR, or SBR, as TOF-OSEM-PSF at full acquisi-
tion duration is given in Table 2.
The visual evaluation of 18F-FDG PET image quality resulted in similar
scores for reconstructions, although BSREM β 400 obtained the highest mean
whereas β 267 was ranked best in overall image quality, contrast, sharpness,
and tumor detectability. The visual evaluation of 68Ga-PSMA-11 PET image
quality showed low inter-rater agreement. TOF-OSEM-PSF was ranked high-
est among the four reconstructions in the overall category, while BSREM β
400 was ranked highest regarding sharpness and tumor detectability.
Figure 9. Coronal whole body 18F-FDG PET images, demonstrating uptake (arrows)
by SUVmax obtained with respective reconstruction method.
33You can also read