Evaluation of aerosol microphysical, optical and radiative properties measured with a multiwavelength photometer
←
→
Page content transcription
If your browser does not render page correctly, please read the page content below
Atmos. Meas. Tech., 15, 2139–2158, 2022
https://doi.org/10.5194/amt-15-2139-2022
© Author(s) 2022. This work is distributed under
the Creative Commons Attribution 4.0 License.

Evaluation of aerosol microphysical, optical and radiative properties
measured with a multiwavelength photometer
Yu Zheng1 , Huizheng Che1 , Yupeng Wang2 , Xiangao Xia3 , Xiuqing Hu4 , Xiaochun Zhang5 , Jun Zhu6 , Jibiao Zhu1 ,
Hujia Zhao7 , Lei Li1 , Ke Gui1 , and Xiaoye Zhang1
1 State Key Laboratory of Severe Weather & Key Laboratory of Atmospheric Chemistry,
Chinese Academy of Meteorological Sciences, China Meteorological Administration, Beijing, 100081, China
2 Changchun Institute of Optics, Fine Mechanics and Physics, Chinese Academy of Sciences, Changchun, 130033, China
3 LAGEO, Institute of Atmospheric Physics, Chinese Academy of Sciences, Beijing, 100029, China
4 National Satellite Meteorological Center, China Meteorological Administration, Beijing, 100081, China
5 Centre for Atmosphere Watch and Services, Meteorological Observation Centre,

China Meteorological Administration, Beijing, 100081, China
6 Jiangsu Key Laboratory of Atmospheric Environment Monitoring and Pollution Control,

Collaborative Innovation Center of Atmospheric Environment and Equipment Technology,
School of Environmental Science and Engineering, Nanjing University of Information Science & Technology,
Nanjing, 210044, China
7 Institute of Atmospheric Environment, China Meteorological Administration, Shenyang 110166, China

Correspondence: Huizheng Che (chehz@cma.gov.cn)

Received: 29 October 2021 – Discussion started: 20 November 2021
Revised: 23 February 2022 – Accepted: 28 February 2022 – Published: 8 April 2022

Abstract. An evaluation of aerosol microphysical, optical          ations of the single scattering albedo were approximately
and radiative properties measured with a multiwavelength           0.1 %–1.8 %, 0.6 %–1.9 %, 0.1 %–2.6 % and 0.8 %–3.5 % for
photometer named CW193 was performed in this study. The            the 440, 675, 870 and 1020 nm bands, respectively. For the
instrument has a highly integrated design, smart control per-      aerosol direct radiative forcing, deviations of approximately
formance and is composed of three parts (the optical head,         4.8 %–12.3 % were obtained at the earth’s surface and 5.4 %–
robotic drive platform and stents system). Based on syn-           15.9 % for the top of the atmosphere. In addition, the water
chronous measurements, the CW193 products were validated           vapor retrievals showed satisfactory accuracy, characterized
using reference data from the AERONET CE318 photome-               by a high R value (∼ 0.997), a small RMSE (∼ 0.020) and a
ter. The results show that the raw digital counts from CW193       good expected error distribution (100 % within expected er-
agree well with the counts from AERONET (R > 0.989),               ror). The water vapor RMB was about 0.979, and the biases
with daily average triplets of around 1.2 % to 3.0 % for the ul-   mostly varied within ±0.04, whereas the mean values were
traviolet band and less than 2.0 % for the visible and infrared    concentrated within ±0.02.
bands. Good aerosol optical depth agreement (R > 0.997,
100 % within expected error) and root mean square error
(RMSE) values ranging from 0.006 (for the 870 nm band)
to 0.016 (for the 440 nm band) were obtained, with the rela-       1   Introduction
tive mean bias (RMB) ranging from 0.922 to 1.112 and the
aerosol optical depth bias within ±0.04. The maximum de-           Atmospheric aerosols have a substantial impact on the whole
viation of the peak value for fine-mode particles varied from      environment, and affect the regional air quality and global
about 8.9 % to 77.6 %, whereas the variation for coarse-mode       climate change in particular. In terms of the earth’s climate,
particles was about 13.1 % to 29.1 %. The deviation vari-          aerosols represent one of the determining factors for climate
                                                                   change for which there are also large uncertainties (Che et

Published by Copernicus Publications on behalf of the European Geosciences Union.
2140                                  Y. Zheng et al.: Evaluation of aerosol microphysical, optical and radiative properties

al., 2019a; Gui et al., 2017; Hansen et al., 1997; Letu et al.,    satellite AOD retrieval products cannot meet the advanced
2020b; Xing et al., 2020; Zhao et al., 2021a). Specifically,       requirements for ecological environment assessment, heath
atmospheric aerosols can disturb the earth’s radiative budget      effect studies and real-time monitoring (Dubovik et al., 2006;
and modify it not only by scattering and/or absorbing the in-      Gui et al., 2021b; Ma et al., 2021; Miao et al., 2019; Ningom-
cident solar radiation and the outgoing radiation from the sur-    bam et al., 2021; Xing et al., 2021b; Zheng et al., 2019).
face (aerosol direct radiative effects) but also by altering the      For these reasons, aerosol detection from ground-based
microphysical properties of clouds, such as the cloud con-         observations is regarded as the most direct, accurate and ef-
densation nuclei concentration and reflectivity (Charlson et       fective technique to measure and study the columnar mi-
al., 1992; Dubovik et al., 2002; Letu et al., 2020a; Zhao et       crophysical, optical and radiative properties of atmospheric
al., 2020). In addition, the distribution of aerosols in the at-   aerosols, and there are extensive ground-based monitor-
mosphere is not uniform, and is characterized by high spatial      ing networks across the world dedicated to aerosol detec-
and temporal variability among regions (Gui et al., 2021a; Li      tion, such as the Precision Filter Radiometer (PFR) net-
et al., 2020a; Zhao et al., 2021b). For these reasons, an inte-    work of the Global Atmosphere Watch program of the
grated and accurate understanding of aerosol microphysical,        World Meteorological Organization (WMO-GAW; Cuevas
optical and radiative properties is essential for studies on the   et al., 2019), the China Aerosol Remote Sensing NETwork
climatic and environmental effects of aerosols, particularly       (CARSNET; Che et al., 2015, 2018), the Aerosol Robotic
when assessing the response of the climate to anthropogenic        Network (AERONET; Holben et al., 1998), the PHOtométrie
aerosols (Bi et al., 2014; Che et al., 2019c; Holben et al.,       pour le Traitement Opérationnel de Normalisation Satelli-
1998; Miao et al., 2021). At present, the two main techniques      taire (PHOTONS; Goloub et al., 2008) and the SKYrad Net-
used to monitor variations in columnar aerosol optical prop-       work (SKYNET; Nakajima et al., 2020), all consisting of
erties are remote sensing by satellites and ground-based ob-       precise instruments with the 0.02 AOD accuracy suggested
servations. As revealed by previous studies, the aerosol opti-     by the WMO (Che et al., 2009). Most of these observation
cal depth (AOD) and Ångström exponent are the most com-            networks are equipped with the CE318 (Cimel Electronique,
monly used and important parameters for investigating the          France), an automatic multiband sun photometer that is used
features of aerosols, and are widely used in numerical mod-        as the master and/or observation instrument to provide long-
eling and satellite calibration (Li et al., 2020b; Zhang et al.,   term data on aerosol microphysical, optical, and radiative
2021a, b; Zhao et al., 2018).                                      characteristics at the global scale. These networks play an
   Remote sensing from satellite-borne platforms has devel-        important role in determining the climatic and environmen-
oped rapidly since its inception, owing to its powerful fea-       tal effects of aerosols, especially in polar and plateau regions
tures and convenience, especially for the global and long-         where robotic measurements may be a better choice due to
term observation of atmospheric aerosols (Gui et al., 2019,        the harsh climatic conditions and lack of manpower sup-
2021c; Ma et al., 2021). For example, the Advanced Very            port, and their measurement results have been strictly veri-
High Resolution Radiometer (AVHRR) (Hauser et al., 2005;           fied under a wide range of conditions (Dubovik et al., 2000;
Stowe et al., 1997) and the Total Ozone Mapping Spec-              Eck et al., 1999; Xing et al., 2021a; Zhuang et al., 2017).
trometer (TOMS) (Hsu et al., 1999) have provided long-             As discussed in WMO-GAW report nos. 162, 207, 227 and
term global AOD products from 1979 to the present. The             228 (from 2004, 2012, 2016 and 2017, respectively), the
Sea-viewing Wide Field-of-view Sensor (SeaWiFS) and the            multiwavelength aerosol optical depth (AOD) is still recom-
Visible Infrared Imaging Radiometer Suite (VIIRS) provide          mended as the long-term measurement variable in the im-
aerosol retrieval products such as the fine-mode fraction          plementation plan from 2016 to 2023. Ground-based AOD
and the particle densities of aerosols (Gordon and Wang,           attenuation observation in particular is regarded as a highly
1994; Sayer et al., 2012). In recent years, a series of ad-        accurate monitoring method that provides indispensable data
vanced satellite sensors for aerosol monitoring have been          for satellite validation and global modeling. According to
launched, such as the Multi-angle Imaging SpectroRadiome-          this guideline, the absolute limit on the estimated uncertainty
ter (MISR) (Garay et al., 2017), the Moderate Resolution           is 0.02 optical depths for acceptable data, and < 0.01 is the
Imaging Spectrometer (MODIS) (Wei et al., 2019), and               goal to be achieved in the near future. Additionally, the in-
Cloud-Aerosol Lidar and Infrared Pathfinder Satellite Ob-          ternational coordination of AOD networks is still inadequate
servations (CALIPSO) (Kim et al., 2018), which have con-           and could be improved by a federated network under the
tributed greatly to our understanding of the temporal and spa-     WMO-GAW umbrella, and networks should be made trace-
tial distribution characteristics of aerosols. Nevertheless, as    able and maintainable via intercomparisons and calibrations.
Li et al. (2020a) reported, there are still considerable uncer-    These guidelines highlight that data assessment is as impor-
tainties in the satellite AOD retrieval products due to the in-    tant as field observations. However, in China, due to the vast
fluences of sensor calibration, cloud contamination and sur-       territory and various landforms present, there are still many
face albedo. In addition, owing to the limitation on the tem-      observation gaps in the monitoring of aerosol optical prop-
poral resolution of satellite-borne platforms over specific re-    erties. Furthermore, the complicated underlying surface and
gions such as high-altitude areas and huge-emission areas,         emission conditions result in distinct temporal and spatial

Atmos. Meas. Tech., 15, 2139–2158, 2022                                             https://doi.org/10.5194/amt-15-2139-2022
Y. Zheng et al.: Evaluation of aerosol microphysical, optical and radiative properties                                       2141

variations in the aerosol. Therefore, referring to the WMO-
GAW’s criterion, conducting field observations and evaluat-
ing data are of great importance for reducing the uncertain-
ties in aerosol optical properties, which will be of great as-
sistance when combating climate change.
   Many photometers aside from CE318, POM-02 (Naka-
jima et al., 2020) and PFR (Kazadzis et al., 2018) have
been used for AOD measurements in China, such as DTF-
5 and PSR-2 (Li et al., 2012; Huang et al., 2019). How-
ever, we suggest that all such instruments and their products
should meet the WMO-GAW’s criterion and remain consis-
tent with AERONET, thus providing comprehensive, com-              Figure 1. Location of the CAMS site.
parable aerosol optical products. Here, we present a highly
integrated multiwavelength photometer named CW193 (CW
is an abbreviation of “Chinese device for World”) for mon-         term ground-based aerosol measurements at CAMS, the an-
itoring aerosol microphysical, optical and radiative proper-       nual mean AOD440 nm is ∼ 0.65 ± 0.60, with a maximum
ties. It has a user-friendly instruction system and most of its    monthly mean of ∼ 0.82 ± 0.77 in July and a minimum
components are assembled in a robotic drive platform, which        monthly mean of ∼ 0.39±0.41 in December, which are con-
makes the whole system efficient and highly integrated. By         sidered to be representative of the urban atmospheric con-
using direct sun and diffuse-sky radiation measurements, the       ditions in China and a good test environment for CW193.
CW193 not only provides the columnar instantaneous AOD             This CAMS site (named “Beijing-CAMS”) is part of the
but also gives detailed information on the aerosol character-      AERONET observation network and has provided the AOD
istics, including – but not limited to – the volume size distri-   and other inversion products since its establishment in 2012.
bution (VSD), the single scattering albedo (SSA), the asym-        In addition, Beijing-CAMS is a transfer sun calibration site
metry factor (ASY) and the aerosol direct radiative forcing        for CARSNET, with the master instruments sent to the Izaña
(ADRF), which are the key input parameters for numerical           Observatory (Izaña, Canary Islands, Spain; 28.3◦ N, 16.5◦ W,
models (Miao et al., 2020; Stier et al., 2005; Wang et al.,        2373 m a.s.l.) for annual calibration. The data on particulate
2013). These features make the CW193 a particularly suit-          matter (PM) concentrations used in this study were provided
able multiwavelength photometer for monitoring aerosol mi-         by the Ministry of Ecology and Environment of the People’s
crophysical, optical and radiative properties, which can con-      Republic of China (https://air.cnemc.cn:18007/, last access:
tribute to verifying satellite and modeling products.              29 March 2022).
   For this study, synchronous measurements were conducted
by CW193 and CE318s from AERONET and CARSNET at                    2.2     Ancillary information
CAMS (Chinese Academy of Meteorological Sciences), and
the products of CW193 were evaluated and compared in de-           2.2.1    CE318 sun photometer and its observation
tail with the reference of AERONET to check that they re-                   network
main consistent with it. Following the present introduction,
the observation site and ancillary information for this study      In this comparative observation campaign, the AOD data and
are introduced in Sect. 2. In Sect. 3, a description of the new    their correlative aerosol inversions provided by AERONET
CW193 multiwavelength photometer is provided. Section 4            and CARSNET were used to validate the results retrieved
provides an evaluation and comparison of the aerosol micro-        from the CW193 observations. AERONET is the biggest
physical, optical and radiative properties from CW193. Fi-         federated instrument network in the world, providing open-
nally, the main conclusions are presented in Sect. 5.              access data on aerosol microphysical, optical and radia-
                                                                   tive properties (https://aeronet.gsfc.nasa.gov/, last access: 29
                                                                   March 2022). CARSNET is the largest ground-based aerosol
2     Observation site and ancillary information                   remote-sensing network in China, with more than 80 sites
                                                                   in China, of which 51 are currently operational. CARSNET
2.1    Observation site                                            uses a similar algorithm to AERONET (Dubovik et al., 2000;
                                                                   Dubovik and King, 2000) and has a rigorous calibration pro-
In this study, the CW193 instrument was tested in the              cess; therefore, the aerosol retrievals of CARSNET are of
atmospheric composition observation platform of CAMS               great importance for determining the temporal and spatial
(116.317◦ E, 39.933◦ N, 106 m a.s.l., see Fig. 1), in the north    variations of aerosol optical properties in China (Che et al.,
urban area of Beijing, where the main forms of pollution           2018; Yu et al., 2015; Zhao et al., 2021b; Zheng et al., 2021).
are derived from urban activities. As revealed by Che et              The master instrument used in AERONET and CARSNET
al. (2015, 2019b) and Zheng et al. (2019), according to long-      is the CE318 sun photometer, which performs direct sun and

https://doi.org/10.5194/amt-15-2139-2022                                             Atmos. Meas. Tech., 15, 2139–2158, 2022
2142                                  Y. Zheng et al.: Evaluation of aerosol microphysical, optical and radiative properties

Figure 2. CW193 scheme and dimensions.

diffuse-sky radiation measurements at set observation times.       675, 870, 936, 1020 and 1640 nm, which are precisely coated
For the direct sun measurements, the radiation is measured at      to delay the aging of their optical transmittance. There are
340, 380, 440, 500, 675, 870, 1020 and 1640 nm to calculate        sensors inside the optical head for internal humidity and tem-
an accurate AOD, and at 936 nm for water vapor (WV), with          perature monitoring, and this environmental information is
uncertainties within ±0.02 and ±0.10 cm, respectively. The         used to conduct the temperature correction of the raw signal,
diffuse-sky measurements are conducted at 440, 500, 675,           thus minimizing the temperature dependence of the silicon
870, 1020 and 1640 nm to retrieve the microphysical and op-        detectors at 1020 and 1640 nm.
tical properties of aerosols in different routines: the almu-         The robotic drive platform is the main dynamic system
cantar (ALM) and the principal plane (PPL). The azimuth            that allows the optical head to track the direct solar radiation,
angle is varied while the zenith angle is kept constant for the    and is used in the ALM scan routines. To avoid mechanical
ALM, and vice versa for the PPL. In this study, the CE318s         problems owing to excessive usage of the robotic platform,
and CW193 were set to perform intensive direct sun observa-        CW193 is designed to keep tracking the sun all the time un-
tions every 3 min (normally, they would be performed every         less the ALM routines are activated at specific integral lo-
15 min) to obtain enough data to evaluate the AOD accuracy.        cal times (09:00, 10:00, 11:00, 12:00, ...). In addition, all the
                                                                   measurement routines are suspended when precipitation is
2.2.2   CW193 multiwavelength photometer                           detected by the wet sensor of the platform, and the optical
                                                                   head will then turn down to avoid rain contamination. On the
The CW193 is an automatic photometer that is designed to           whole, the system is protected up to the IP65 level, making it
obtain AOD and other retrievals (such as microphysical, op-        tough enough to run in a humid or dusty environment.
tical and radiative properties of aerosols) from solar radia-         The stents system, which is directly supported on the
tion and sky radiation monitoring. The instrument is mainly        base of the robotic drive platform, consists of an adjustable-
composed of three parts: the optical head, robotic drive plat-     length tripod with a horizontal adjustment knob at each foot;
form and stents system (as shown in the left part of Fig. 2).      therefore, it can be quickly deployed and fixed onto flat
These three parts can be easily connected together using only      and/or rigid surfaces and has a reliable anti-wind capacity
a few screws. Aside from its highly integrated design, the         (< 25 m s−1 if not fixed on the ground). The instrument is
cross weight of CW193 is about 12 kg, which makes it easier        powered by a 220 V alternating current and is equipped with
to transport. We present a comparison of the technical speci-      a solar panel for use in remote locations and in temporary/-
fications of CE318-T and CW193 in Table 1.                         movable observation campaigns. As a result, the design of
   Two collimators with a 1.30◦ full field of view are both        CW193 is very robust, ensuring long-term, steady operation
separately screwed tightly to the optical head (making its dis-    at a wide range of temperatures and humidities: between
assembly and maintenance more convenient) to avoid inter-          about −30 and 60 ◦ C and between about 0 % and 100 %, re-
ference from stray light and to reduce the measurement error       spectively.
originating from nonparallel integrated collimators, as used          The main circuit board is in the head of the robotic drive
in CE318. To compare the results with AERONET, the de-             platform and integrates operation control, data acquisition,
tector in the optical head is designed with nine optical filters   data storage, transmission communication and status diag-
with nominal wavelengths centered at 340, 380, 440, 500,

Atmos. Meas. Tech., 15, 2139–2158, 2022                                             https://doi.org/10.5194/amt-15-2139-2022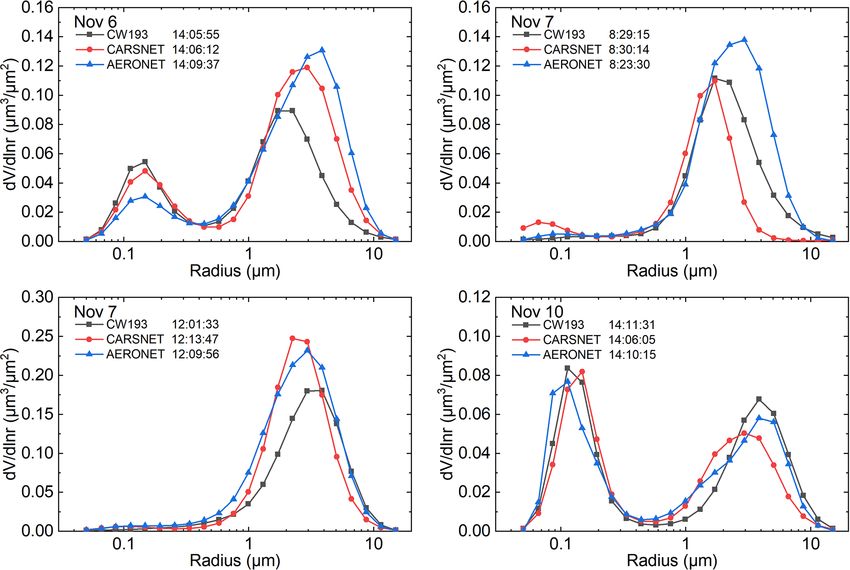
Y. Zheng et al.: Evaluation of aerosol microphysical, optical and radiative properties 2143
Table 1. Technical specifications for CE318-Ta and CW193.
CE318-Ta CW193
Main components Optical head, control unit, robot, Optical head, robotic drive platform, stents system
Spectral range 340, 380, 440, 500, 675, 870, 937, 1020, 1640 nm 340, 380, 440, 500, 675, 870, 937, 1020, 1640 nm
Field of view 1.26◦ 1.30◦
Azimuth range for detection 0 to 360◦ 0 to 360◦
Zenith range for detection 0 to 180◦ 0 to 180◦
Sun tracking accuracy 0.01◦ 0.02◦
Communication outputs RS232, USB, UMTS/3G/W-CDMA, GPRS RS232, USB, 4G
Storage Flash memory (4 MB), SD card (32 G) Flash memory (32 GB)
Power demand DC 12 V or solar panel (5 W) and DC 12 V
external batteries (12 V, 16 Ah)
Software PhotoGetData DataMonitor
a Parameters for the standard version of the CE318-T photometer.
nosis. The control unit is designed to conduct observations 2009, 2019c; Zheng et al., 2021). The sphere calibration
automatically in the default state once the geographic infor- was performed at the optical calibration laboratory (CAMS,
mation for the observation site has been confirmed by the Beijing) of CARSNET by integrating the sphere. We con-
built-in BDS (BeiDou Navigation Satellite System) module. ducted 50 measurements of the sphere’s radiance and found
The data unit comprises an internal data logger and 32 GB extremely small fluctuations in the CW193 digital counts
of memory, which is considered lifetime storage with a daily (< 1 ‰), indicating excellent detection stability and accurate
data size of ∼ 150 kB. Data transmission to a computer can sphere calibration coefficients (Tao et al., 2014).
be realized in two ways: serial communication via RS-232 or We calculated the cloud-screened AOD and columnar wa-
via the 4G network. The diagnostic module checks the whole ter vapor with CW193 using a similar algorithm to that
system when the instrument is powered on, and the running used by AERONET. As this algorithm has been used mul-
state is easily recognized by checking the indicator light in tiple times in many observation campaigns, numerical mod-
the optical head. eling and satellite verification for CARSNET, it is suitable
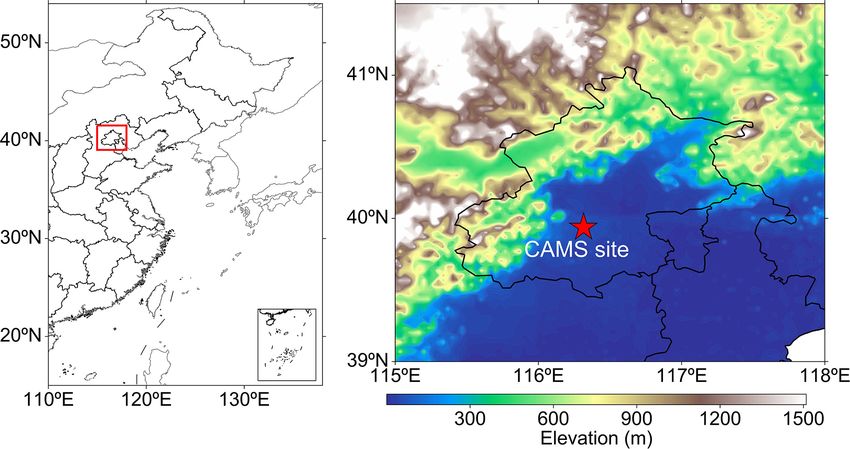
The system provides a friendly user interface on a com- and reliable for evaluating the AOD performance of CW193
puter, which makes CW193 easy to operate, convenient to (Wang et al., 2010; Xia et al., 2021; Yu et al., 2015; Zhao
maintain and highly functional. In Fig. 3, the functional area et al., 2021c; Zheng et al., 2021). A verification of the algo-
and monitoring area are clearly presented in the left and right rithm is provided in the Supplement, guaranteeing the accu-
parts of the interface, respectively. It is very convenient to re- racy of this campaign (Figs. S1 and S2 in the Supplement).
ceive data via the 4G network when serial communication is As for the inversions of VSD and SSA in this campaign,
unavailable (in some remote regions). Also, multiple device they were retrieved from observational data obtained from
control is achievable (devices 003, 005 and 006 are online diffuse-sky measurements by CW193 at 440, 675, 870 and
and controllable in Fig. 3) in this model. In the data download 1020 nm using the algorithms of Dubovik et al. (2002, 2006).
part, the history data can easily be downloaded by selecting The ADRF was calculated by the radiative transfer module,
the start and end times via a drop-down menu. All observa- which is similar to the inversion of AERONET (García et al.,
tion instructions are provided in the control commands area 2008, 2012). Because these inversions and their algorithms
and can be sent to the device in the dialog box. In the moni- have been introduced, validated and applied in many previ-
toring area in the right half, the plot and the data plotted are ous studies based on CARSNET observations, we will not
located in the top and bottom windows, respectively, making do so again in this paper (Che et al., 2018, 2019c; Zhao et
it convenient for monitoring the device’s status. We present a al., 2018; Zheng et al., 2021). In general, the uncertainty in
comparison of the functional specifications of CE318-T and the AOD was 0.01–0.02 (Eck et al., 1999). The VSD accu-
CW193 in Table 2. racy was 15 % to 25 % for 0.1 µm ≤ r ≤ 7.0 µm and 25 % to
100 % for other radii (Dubovik et al., 2002). The SSA ac-
2.2.3 Calibration and data processing curacy was 0.03 when it was calculated under the condi-
tion AOD440 nm > 0.50 with a solar zenith angle of > 50 ◦
In this work, the direct sun calibration of CW193 was con- (Dubovik et al., 2002). The bias for measured radiation at
ducted at the atmospheric composition observation platform the surface was about 9 ± 12 W m−2 , and was affected by the
of CAMS (one of the calibration centers of CARSNET) us- dominant aerosol type (García et al., 2008).
ing the method of coefficient transfer (intercomparison) with
the reference master instruments of AERONET (Che et al.,
https://doi.org/10.5194/amt-15-2139-2022 Atmos. Meas. Tech., 15, 2139–2158, 2022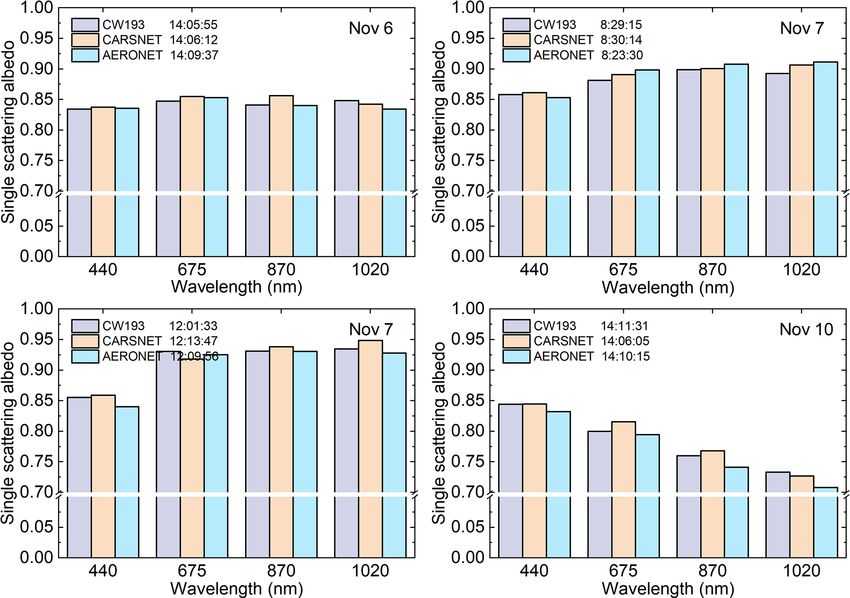
2144                                 Y. Zheng et al.: Evaluation of aerosol microphysical, optical and radiative properties

Figure 3. Monitoring software of CW193.

3     Results and discussion                                      CW193. In addition, to avoid the effect of instantaneous at-
                                                                  mospheric disturbance, only the values for which the differ-
In this work, synchronous measurements with five instru-          ence in observation time compared to the master instruments
ments were conducted at the CAMS observation platform             was within 20 s were selected and considered effective data
during 1–11 November 2020. Specifically, photometers #543         in this work.
and #746 of the CE318-N model and photometers #1043                  From Table 3, it can be seen that the digital counts mea-
and #1046 of the CE318-T model are the four master instru-        sured by CW193 and the master instruments are highly
ments at the Beijing-CAMS site in AERONET, and the raw            correlated for these specific bands, with correlation coeffi-
data from them are transmitted in real time to AERONET.           cients (R) and coefficients of determination (R 2 ) higher than
The AODs and other inversion products from these four in-         0.98 and 0.97, respectively, suggesting high linear consis-
struments can be downloaded from the AERONET website.             tency rather than possible nonlinearities of CW193 in the
Furthermore, these four instruments are the reference instru-     selected measurement range. To allow further comparison,
ments of CARSNET, and play an important role in the oper-         we rounded these statistics to four decimal places. It was
ational observations and annual calibration of CARSNET.           found that the raw signal from CW193 was generally more
                                                                  consistent with photometer #1046, with all the R 2 values
3.1    Raw digital count evaluation                               for that photometer exceeding 0.9988, whereas the R 2 val-
                                                                  ues for photometer #1043 varied from ∼ 0.9792 to 0.9994.
The raw digital counts are the deciding factor in the preci-      In practical terms, CW193 performs better in the ultravio-
sion of the calculation and retrieval results, which reflects     let (UV) bands (340 nm and 380 nm) and visible bands (440
the running status and stability of the instrument. In Table 3,   to 870 nm), yielding R 2 values larger than 0.9971 and 0.9995
we show the observed signal with the least squares method,        with photometers #1043 and #1046, respectively. The R 2 val-
presenting a basic statistical intercomparison at coincident      ues were relatively low in the infrared bands of 1020 and
spectral wavelengths. It is notable that these instruments per-   1640 nm. The minimum R 2 values were ∼ 0.9792 with pho-
form three measurements within ∼ 30 s in one scenario, and        tometer #1043 at 1020 nm and ∼ 0.9988 with photometer
we calculated the average digital count for each observa-         #1046 at 1640 nm, indicating greater variation in these two
tion in this comparison. Furthermore, the results from the        bands than in the other bands owing to their temperature sen-
AERONET webpage during this campaign were mainly de-              sitivity (Che et al., 2011; Tao et al., 2014). For the WV chan-
rived from photometers #1043 and #1046 according to the           nel at 936 nm, the R 2 values were ∼ 0.9977 and ∼ 0.9997 for
“instrument number” in the downloaded files; therefore, we        photometers #1043 and #1046, respectively; hence, CW193
used the corresponding observation signals of these two mas-      showed good detection ability for columnar WV.
ter instruments to carry out the performance evaluation of

Atmos. Meas. Tech., 15, 2139–2158, 2022                                            https://doi.org/10.5194/amt-15-2139-2022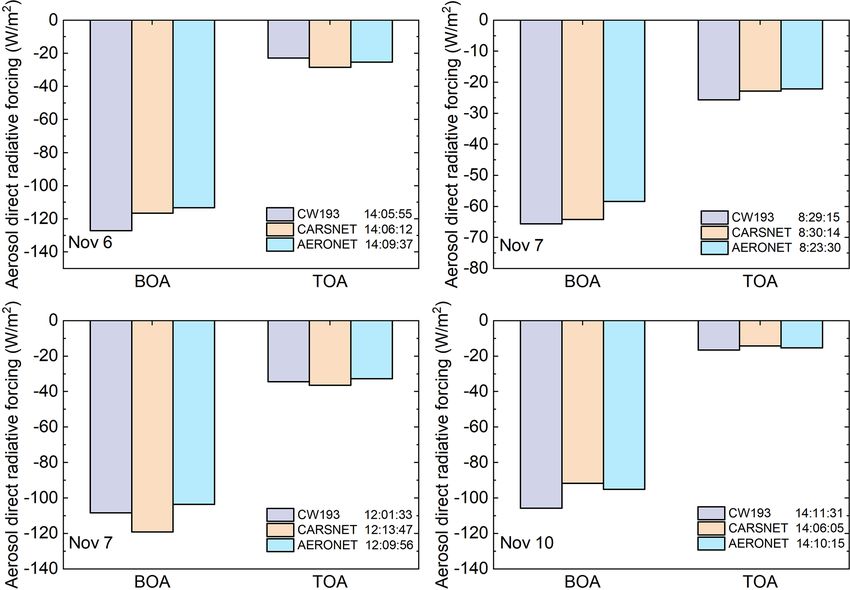
Y. Zheng et al.: Evaluation of aerosol microphysical, optical and radiative properties                                                            2145

Table 2. Functional specifications for CE318-Ta and CW193.

                                                CE318-T                                              CW193
          Observation frequency for             15 min (default), up to 2 min                        3 min (default), up to 2 min
          sun measurement
          Mode of sun tracking                  At the beginning of every measurement                Keep tracking with continuous rotation
          Observation frequency for             According to air mass, when air mass                 Every integral local time at 07:00, 08:00,
          ALM scan                              = 1.7, 2.0, 2.2, 2.4, 2.6...                         09:00, 10:00, 11:00, ..., 19 o’clock (pri-
                                                                                                     mary); according to air mass, when air
                                                                                                     mass = 1.7, 2.0, 2.2, 2.4, 2.6, ... (sub-
                                                                                                     sidiary)
          Observation scheduleb                 Sun, moon, black, principal plane, almu-             – Sun, black, almucantar, principal plane
                                                cantar, hybrid, cross sun, cross moon.               (default)
                                                Curvature cross                                      – Only sun (optional, consecutive)
                                                                                                     – Only almucantar (optional, consecutive)
                                                                                                     – Only principal plane (optional, consec-
                                                                                                     utive)
          Monitoring software                   – Instrument setupb                                  – Scan mode and scenario configuration
                                                – Wavelength selection                               – Measurement scheduling
                                                – Scan mode and scenario configuration               – Wavelength selection
                                                – Measurement scheduling                             – Data visualization
                                                – Data analysis                                      – Data retrieval
                                                – Data visualization                                 – Data storage (TXT files)
                                                – Data storage (raw data, k8, ASCII files)           – Command inputs
                                                                                                     – Multidevice control (4G mode only)
        a Standard version of the CE318-T photometer. b For the photometer in auto mode.

Table 3. Coefficient of determination (R 2 ) and number of coincident data (N) for the raw digital count comparison between CW193 and
CE318 measurements for the nine spectral bands used in this study.

                                     Wavelength                    #1043                             #1046
                                     (nm)                     R          R2        N             R         R2      N
                                     340                0.9997      0.9994       162        0.9998     0.9996    355
                                     380                0.9995      0.9990       162        0.9998     0.9996    355
                                     440                0.9997      0.9994       162        0.9998     0.9997    355
                                     500                0.9991      0.9982       162        0.9997     0.9995    355
                                     675                0.9993      0.9985       162        0.9999     0.9998    355
                                     870                0.9985      0.9971       162        0.9999     0.9998    355
                                     936                0.9989      0.9977       162        0.9998     0.9997    355
                                     1020               0.9895      0.9792       162        0.9995     0.9990    355
                                     1640               0.9923      0.9846       162        0.9994     0.9988    355

   The      triplet    value,    defined     as    (maximum –                          creasing dispersion with increasing airmass. However, cloud
minimum)/mean × 100 %, is a more effective parameter for                               contamination is also an important factor affecting triplet
obtaining a better description of the stability of the instru-                         variation. Using the weather record and the cloud-screening
ment and the atmospheric conditions. Thus, we calculated                               results of AERONET (version 3.0) as a reference, we found
the triplet for each band, and the diurnal variation in these                          that the atmospheric conditions on 7 and 11 November
triplets is shown in Fig. 4. In this study, it can be clearly                          were greatly influenced by cloud processes. As a result, the
seen that the triplets showed a typical diurnal distribution, as                       dispersion of the triplets on those 2 days was larger than
found in many previous studies (Barreto et al., 2016; Che et                           that on the other days, with almost all values exceeding
al., 2011; Estellés et al., 2012), which is characterized by in-                       2.0 % at all times. The observation conditions on the other

https://doi.org/10.5194/amt-15-2139-2022                                                                 Atmos. Meas. Tech., 15, 2139–2158, 2022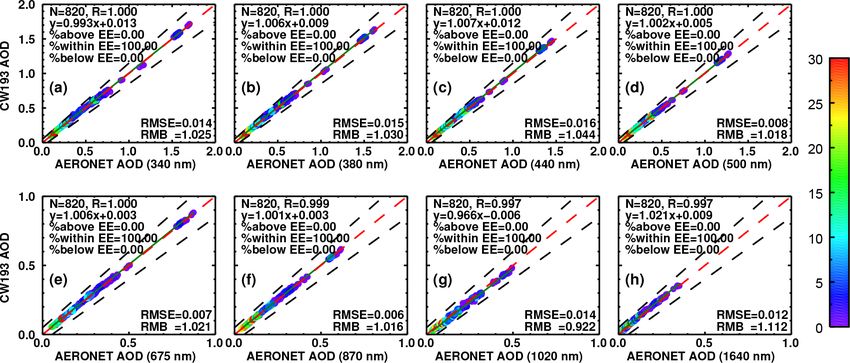
2146                                    Y. Zheng et al.: Evaluation of aerosol microphysical, optical and radiative properties

Figure 4. Diurnal variation of the triplet at each wavelength on 11 case days.

days were less affected by cloud, and it can be seen that the            tion with wavelength. The fluctuation for the WV channel
values reduced to a relatively low level; most values were               at 936 nm was moderate compared with those for the other
< 2.0 % between 10:00 and 14:00 BJT (Beijing Local Time)                 bands, and the daily average triplets were slightly higher
in all cases. The triplets of the UV bands are as large as               than those in the infrared bands from 1020 to 1640 nm but
10.0 %, whereas they are 2.0 %–6.0 % for the visible bands               much lower than those in the UV bands. In general, the
before 10:00 BJT and after 14:00 BJT. These results reveal               WV channel showed a similar variation range to the 870 nm
that the digital counts of CW193 measurements fluctuate                  band: ∼ 0.5 %–2.5 %. As can be seen from Fig. 5, the lowest
considerably during the morning and in the afternoon owing               daily fluctuations were found on 3 November, with a varia-
to the weak solar radiation and rapid and extensive changes              tion range of ∼ 1.4 %–1.8 % for the UV bands and ∼ 0.4 %–
in the solar altitudinal angle.                                          0.8 % for the other bands. Using the meteorological and en-
   The daily average triplets were also calculated in this inter-        vironmental records as a reference (no cloud contamination
comparison (Fig. 5). We found that the daily average triplets            and daily PM2.5 ∼ 11 µm m−3 ; Table 4), these results indi-
for the UV bands showed the largest ranges of amplitude                  cate that the dispersion of diurnal triplets is quite small under
fluctuations: ∼ 1.5 %–3.0 % for 340 nm and 1.2 %–2.5 % for               clear and stable weather conditions, suggesting that CW193
380 nm. For the visible bands from 440 to 870 nm, it can                 is capable of reliable measurements.
be clearly seen that the variation in the daily average triplet
decreases with increasing wavelength. With the exception                 3.2     AOD evaluation
of 7 November, which was greatly affected by cloud pro-
cesses, the daily average triplets for the visible bands were
                                                                         The AOD performance of the CW193 was tested at the
all less than 2.0 %. Relatively weak fluctuation amplitudes
                                                                         Beijing-CAMS site using CE318s as the reference, as this
were observed in the infrared bands from 1020 to 1640 nm
                                                                         instrument has been widely verified under a wide range of
in all cases, with the daily average triplets being lower than
                                                                         conditions (Che et al., 2015, 2018; Holben et al., 2001; Xia
1.0 % except on 7 November, and they showed less varia-
                                                                         et al., 2016).

Atmos. Meas. Tech., 15, 2139–2158, 2022                                                   https://doi.org/10.5194/amt-15-2139-2022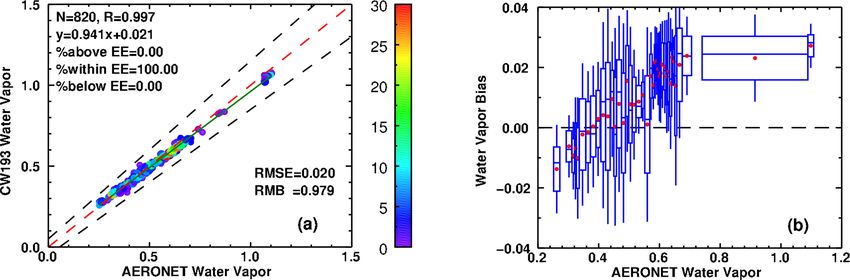
Y. Zheng et al.: Evaluation of aerosol microphysical, optical and radiative properties 2147
Table 4. Classification of case days based on daily average PM2.5
and PM10 concentrations and the variation range of AOD440 .
Date PM2.5 PM10 AOD440
Level I 2 Nov 6 42 0.08–0.15
3 Nov 11 44 0.09–0.26
8 Nov 12 45 0.11–0.21
1 Nov 15 73 0.14–0.29
9 Nov 23 57 0.14–0.31
7 Nov 30 142 0.26–0.47
Level II 4 Nov 37 77 0.35–0.58
Figure 5. Daily triplet value at each wavelength on 11 case days 10 Nov 43 81 0.20–0.60
from 1 Nov (“11-1”) to 11 Nov (“11-11”).
Level III 5 Nov 82 125 0.49–0.91
6 Nov 84 147 0.37–0.63
11 Nov 104 148 1.32–1.47
First, we examined the wavelength dependence of the
AOD from CW193, which is an important indicator of
the observation precision. Furthermore, the daily average
PM2.5 and PM10 concentrations were calculated for air qual- evaluation, the key point is that the performance under quite
ity classification, using the ambient air quality standards low aerosol loading is largely affected by the accuracy and
of China (GB3095-2012, http://www.mee.gov.cn/gkml/hbb/ stability of the instrument (Campanelli et al., 2007; Che et al.,
bwj/201203/t20120302_224147.htm, last access: 29 March 2009; Kazadzis et al., 2018; Ningombam et al., 2019; Tao et
2022) as the reference, to achieve a comprehensive evalua- al., 2014). From Fig. 4, it can be seen that (with the exception
tion of AOD performance under different atmospheric pol- of 7 November, when severe cloud contamination occurred)
lutant loadings. In this study, Level I air quality is defined the variation of the AOD curve can be easily identified ow-
as a daily average PM2.5 lower than 35 µg m−3 , which in- ing to its wavelength dependence. Under the cleanest con-
dicates that the air quality is quite clean and satisfactory ditions (Level I, PM2.5 ∼ 6 µg m−3 , AOD440 ∼ 0.08–0.15,
for outdoor activities. Level II reflects acceptable air qual- 11 November), despite the cloud contamination in the after-
ity coincident with a low burden of certain air pollutants, noon, the AOD variation in each band consistently showed
and a daily average PM2.5 concentration between 35 and a gradually increasing trend, strictly following the rule of
75 µg m−3 . Level III indicates mild atmospheric pollution decreasing AOD with increasing wavelength. Therefore, in
with a daily mean PM2.5 concentration of 75–115 µg m−3 . summary, CW193 showed good ability to reveal the wave-
At Level III, the time spent on outdoor activities should be length dependence of AOD under both high and low aerosol
reduced for children, older people and patients. loadings; hence, the excellent detection ability of CW193
The daily average PM2.5 and PM10 and the variation range makes it a reliable instrument for aerosol monitoring.
of AOD at 440 nm (AOD440 ) at different air quality levels In the next step, the precision performance of CW193
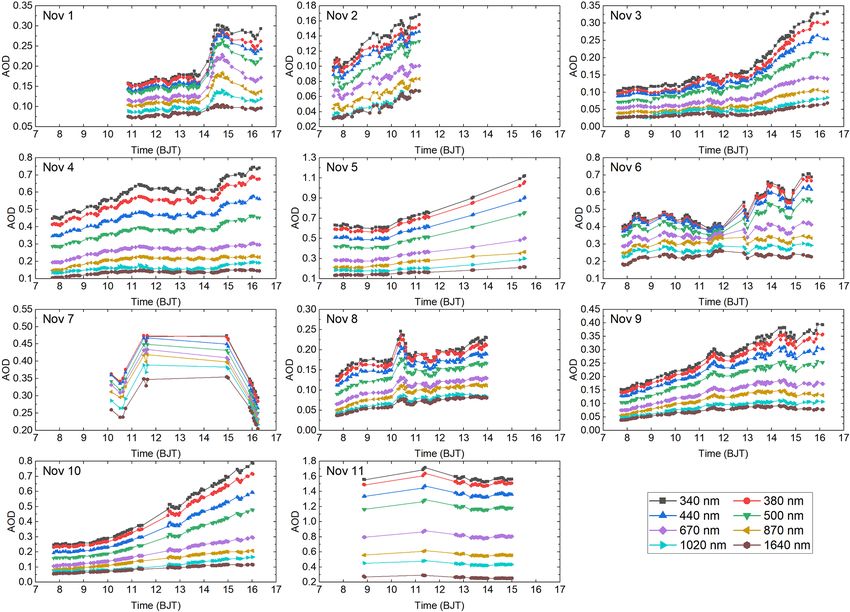
are shown in Table 4. Figure 6 shows the diurnal variation was validated in detail using the AOD from AERONET as
of cloud-screened AOD (only from daytime observations) a reference. Figure 7 shows a comparison of the AODs from
for each band from CW193 during this campaign. An ob- CW193 with the AODs from AERONET at coincident spec-
vious decreasing trend in AOD with increasing wavelength tral wavelengths. In general, the AODs from CW193 agree
can be seen, which is in agreement with many previous stud- well with the AERONET results, with correlation coeffi-
ies (Che et al., 2019c; Holben et al., 1998; Liang et al., cients (R) of ∼ 1.000 for 340–675 nm, ∼ 0.999 for 870 nm,
2019). Consequently, under weak pollution conditions, the and ∼ 0.997 for 1020 and 1640 nm, which indicates that the
high AOD made the characteristics of the wavelength depen- AODs from CW193 were similarly distributed on both sides
dence more apparent. On the most polluted day (11 Novem- of the y = x line. From the R values, we can see that the
ber, Level III, PM2.5 ∼ 104 µg m−3 , AOD440 ∼ 1.32–1.47), correlation tends to slightly decrease with increasing wave-
the diurnal AOD was distributed in an orderly pattern and length. This result can be explained to some degree by the
showed a similar variation trend at each wavelength, with temperature sensitivity of the instrument. As reported by
each curve clearly visible and not intersecting with the oth- Campanelli et al. (2007), the AOD in near-infrared bands
ers. This distribution was also found during the Level II situ- is dependent on the ambient temperature, and the retrieval
ations on 4 and 10 November. Although AOD440 (∼ 0.20– accuracy could be improved by correcting the data for the
0.60) was smaller than that at Level III, the diurnal AOD 870 and 1020 nm wavelengths for temperature effects. In ad-
curves for each wavelength were more continuous and could dition, although CW193 is equipped with the same type of
be recognized more easily, which is partly attributable to the temperature sensor in its optical head, there are many other
reduced impact of cloud contamination. In terms of AOD factors that influence the temperature readings, such as the
https://doi.org/10.5194/amt-15-2139-2022 Atmos. Meas. Tech., 15, 2139–2158, 2022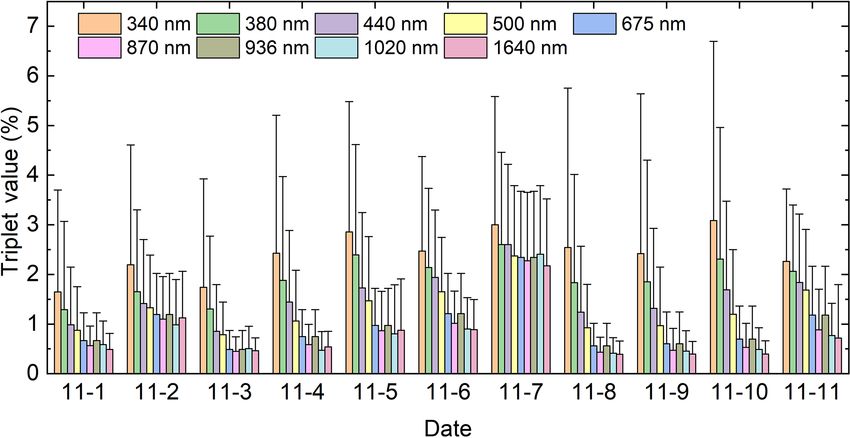
2148                                  Y. Zheng et al.: Evaluation of aerosol microphysical, optical and radiative properties

Figure 6. Diurnal variation of the AOD at each wavelength on 11 case days.

mechanical structure and coating color, which could be the            the AODs in the 1020 nm band were underestimated by ∼
main reasons for the temperature uncertainty and the larger           7.8 % (RMB = 0.922), whereas they were overestimated by
AOD deviations at the longer wavelengths of 870, 1020                 ∼ 11.2 % (RMB = 1.112) in the 1640 nm band. The AODs
and 1640 nm.                                                          from CW193 in the other bands were all slightly overesti-
   From this linear regression figure, it can be seen that            mated (∼ 1.6 %–4.4 %), with the RMB varying within the
the slopes for the 340 and 1020 nm bands are ∼ 0.993 and              relatively narrow range of ∼ 1.016–1.044. This indicates
0.966, respectively, whereas those for the other bands are            that, from the perspective of stability and accuracy, the AODs
all larger than 1, varying from ∼ 1.001 to 1.021. This in-            derived from CW193 show better performance in the UV
dicates that the AOD from CW193 tends to be higher than               bands (340 and 380 nm) and visible bands (440 to 870 nm)
that from AERONET. As done in many previous AOD vali-                 than in the near-infrared band from 1020 to 1640 nm. Further
dation studies, expected error (EE) analyses were conducted           studies and experiments aimed at algorithm and mechanical
in this study. We set the envelopes as ± (0.05 + 10 %). It was        structure optimization to improve the retrieval accuracy need
found that the AODs from CW193 for each band were all                 to be conducted in the future.
able to achieve a satisfactory performance, with 100 % re-               Figure 8 shows the CW193 AOD bias compared with
trievals within the EE – much higher than the standard devi-          equal-frequency bins of AOD from AERONET. All collo-
ation of ∼ 70 % (Che et al., 2019b; Levy et al., 2010). The           cations of AODs were sorted in ascending order and then
root mean square errors (RMSEs) were all less than 0.05 for           sampled with 20 bins. From the bias boxplots, it can be seen
all bands, which revealed that the AODs from CW193 are                that the mean biases (red dots) have similar trends in the
all highly concentrated in the reference AOD range. These             340 to 870 nm bands: they are in a narrow range from about
extremely small deviations also highlight the stability and           −0.02 to 0.03 and are characterized by an initial increase fol-
accuracy of CW193. To further evaluate the AOD accu-                  lowed by a decrease and then a slight increase at high AOD.
racy, the relative mean bias (RMB) for each linear regres-            This indicates that the AODs in these bands from CW193
sion equation was calculated. As mentioned above, the AOD             are overestimated at low AOD (for example, AOD440 ∼ 0.10
uncertainties for the near-infrared bands are obviously larger        to 0.40). Then, under moderate AOD levels (for example,
than those for the other bands in this campaign. Specifically,        AOD440 ∼ 0.50 to 0.90), these biases become smaller or al-

Atmos. Meas. Tech., 15, 2139–2158, 2022                                                https://doi.org/10.5194/amt-15-2139-2022
Y. Zheng et al.: Evaluation of aerosol microphysical, optical and radiative properties                                      2149

Figure 7. Validation of the CW193 AOD at each wavelength against the AERONET AOD. The one-to-one line, the linear regression line
and the EE envelopes of ± (0.05 + 10 %) are plotted as dashed red, solid green and dashed black lines, respectively.

most equal to zero (or even a little bit negative) in the range    position of the sun). In this study, we chose the VSD, SSA
from about −0.01 to 0.01, indicating that the calculations are     and ADRF to represent the microphysical, optical and radia-
more consistent with the reference values and are highly ac-       tive properties of aerosols, as they are not only widely used
curate. At high AOD levels (for example, AOD440 ∼ 1.30 to          parameters in current research but they are also the most im-
1.50), a slight increase in bias is observed in this campaign,     portant factors influencing the radiative budget of the earth–
with mean values varying from about 0 to 0.02. However, the        atmosphere system (Wang et al., 2013; Zhang et al., 2018).
bias performance is quite different for the 1020 and 1640 nm       However, it should be noted that the uncertainties in these
bands. For the 1020 nm band, the mean bias decreases from          inversions are more difficult to ascertain, as the aureole and
zero to −0.02, consistent with the AOD varying from ∼ 0.05         sky radiance measurements constitute only single observa-
to 0.20, and it remains relatively constant at about −0.02         tions (from one ALM routine), and the observation time of
as the AOD continually increases to ∼ 0.50. For the biases         each sequence at a specific wavelength is largely dependent
at 1640 nm, the mean values in the bins show a roughly             on the mechanical design and instrument version used (for
parabolic distribution, varying from ∼ 0.01 to 0.02, consis-       example, the CE318-T has faster robotic movements than the
tent with the AOD varying from ∼ 0.02 to 0.36. Similar to          CE318-N). Furthermore, there is no absolute self-calibration
the results mentioned above, the different distribution of the     procedure between the sphere calibrations; therefore, the un-
bias boxes for the near-infrared bands suggests that an im-        certainty in the sky radiance at the time of calibration is as-
provement in accuracy is needed. Although the linear regres-       sumed to be < 5 % for these four channels (Holben et al.,
sion and bias showed fluctuations to some degree, the AOD          1998). As reported by Tao et al. (2014), the sphere calibra-
performance of CW193 was outstanding: high accuracy and            tion results of CARSNET differed by 3.12 %–5.24 % in the
stability were obtained based on the comprehensive analysis        870 and 1020 nm bands and by less than 3 % in the other two
above, characterized by a bias concentrated within ∼ 0.02          bands compared with the original values from Cimel. In ad-
for the visible and near-infrared bands and within ∼ 0.03 for      dition, to avoid disturbances from transient atmospheric pro-
the UV bands, which meets the accuracy requirements for            cesses, only the results with observation times that deviate
AERONET (Holben et al., 1998).                                     by less than 10 min from those of AERONET were selected,
                                                                   and the related inversions of CARSNET were also retrieved
3.3   Inversion evaluation                                         and presented to show a more detailed comparison.

According to the algorithm, the aerosol inversions, including      3.3.1   Volume size distribution
microphysical, optical and radiative properties, are retrieved
from the aureole and sky radiance measurements. Similar            Figure 9 shows a comparison of the VSDs for four se-
to CE318, CW193 conducts the ALM routine at a specific             lected cases in this campaign. It can be seen that the re-
time related to the air mass. It is performed in two wings in      sults from CW193 accurately present the variation pattern
the 440, 675, 870 and 1020 nm bands sequentially: right (az-       of aerosols: typical bimodal distributions were seen on 6
imuth angle displaced towards the right of the position of the     and 10 November and nearly unimodal distributions for
sun) and left (azimuth angle displaced towards the left of the     the two cases on 7 November. For fine-mode particles (ra-

https://doi.org/10.5194/amt-15-2139-2022                                            Atmos. Meas. Tech., 15, 2139–2158, 2022
2150 Y. Zheng et al.: Evaluation of aerosol microphysical, optical and radiative properties Figure 8. Boxplots of CW193 AOD bias and AERONET AOD using the 25th and 75th percentiles with 20 bins. The dashed black line indicates zero bias. The red dots, middle line, and upper and lower hinges represent the mean and median of the AOD bias and the 25th and 75th percentiles, respectively. dius < 1.00 µm), variations were clearly observed on 6 and 08:00) and 22.2 % (for the case corresponding to a time 10 November. For the reference PM concentrations, the ra- of around 12:00) compared with AERONET, respectively. tio PM2.5 /PM10 was ∼ 53.1 %–57.1 %, suggesting a certain However, the performance of CARSNET was better than amount of small particles, which agrees with the distribution that of CW193 in these three cases, with deviations of ∼ pattern from CW193 and AERONET. The maximum volume 5.7 %, ∼ 20.4 % and ∼ 6.7 %, respectively. As mentioned of fine-mode particles varied in the range of ∼ 0.03–0.05 above, except for the calibration and algorithm uncertain- and ∼ 0.07–0.08 µm3 µm−2 on 6 and 10 November, respec- ties, these large deviations could be explained by the influ- tively. Specifically, the largest deviations of the maximum ences of instantaneous atmospheric disturbances on the re- for fine-mode particles occurred on 6 November: ∼ 77.6 % trievals, although the time differences between the CW193 and ∼ 57.1 % for CW193 and CARSNET compared with and AERONET measurements were within ∼ 4–8 min (∼ 3– AERONET, respectively. Despite the large volume devia- 4 min for CARSNET). A narrow variation range was found tions for fine-mode particles, the variation trends were con- for the 10 November case, which was characterized by a sistent with those of AERONET, characterized by a maxi- relatively small time difference among these three retrievals mum peak at a radius of 0.15 µm. Hence, these patterns can (∼ 2–4 min). Consequently, the deviation of the peak volume be attributed to the different observation times to some de- for CW193 compared with AERONET was ∼ 13.1 %, while gree. The time deviation compared with AERONET varied a larger difference of ∼ 16.8 % was found for CARSNET. from ∼ 3 to 4 min in this case, while the fine-mode vol- In summary, the difference in the VSD showed an obvious ume showed a gradually decreasing trend from CW193 to time-correlation regularity – the smaller the time deviation, CARSNET to AERONET, which agreed with the time series. the better the retrieval consistency with AERONET. In contrast, small deviations of the maximum for fine-mode particles occurred on 10 November: ∼ 8.9 % and ∼ 6.8 % for 3.3.2 Single scattering albedo CW193 and CARSNET compared with AERONET, respec- tively. The peaks for CW193 and AERONET occurred at a The SSA represents the scattering proportion affected by radius of 0.11 µm and the peak for CARSNET was observed aerosol particles with respect to the total extinction, and is at 0.15 µm, indicating that both CW193 and CARSNET show one of the key variables for assessing the effects of aerosols good consistency with AERONET. on the climate (Che et al., 2019c; Zhao et al., 2018). The For coarse-mode particles (radius > 1.00 µm), variations variation of the SSA at four spectral wavelengths for the were clearly detected for the four cases, especially on four cases (6 and 10 November and two on 7 November) 7 November, when the ratio PM2.5 / PM10 was ∼ 21.1 %, is shown in Fig. 10. First, we examined the wavelength de- suggesting that large aerosols were dominant. In these four pendence of SSA, revealing the different scattering capac- cases, the peak volumes of coarse-mode particles varied ities for aerosols at specific bands, which is largely influ- in the ranges ∼ 0.09–0.13, ∼ 0.11–0.14, ∼ 0.18–0.25 and enced by the aerosol chemical composition and can be re- ∼ 0.05–0.07 µm3 µm−2 , respectively. It can be seen that the garded as an indicator of the dominant aerosol type (Eck et highest deviations of the peak volume from CW193 were al., 1999; Zheng et al., 2021). It can be seen from Fig. 10 observed on 6 and 7 November, with values of ∼ 29.2 %, that the SSA showed different variation trends on the 3 days. ∼ 19.1 % (for the case corresponding to a time of around Specifically, for the 6 November case, the SSA increased Atmos. Meas. Tech., 15, 2139–2158, 2022 https://doi.org/10.5194/amt-15-2139-2022
Y. Zheng et al.: Evaluation of aerosol microphysical, optical and radiative properties                                 2151

Figure 9. Comparison of retrieved VSDs from CW193, CARSNET and AERONET for four selected cases.

from 440 to 675 nm and showed a roughly decreasing trend        with a value of ∼ 0.899, whereas that of AERONET was
from 675 to 1020 nm, indicating a relatively strong aerosol     found in the 1020 nm band, with a value of ∼ 0.911, which
absorbance at shorter wavelengths in the visible bands. The     suggests a maximum deviation of ∼ 1.3 %. The largest de-
SSA showed an increasing trend with wavelength for the two      viation for a specific wavelength of CW193 compared with
cases on 7 November, whereas a decreasing trend was ob-         AERONET occurred in the 1020 nm band, and was ∼ 2.1 %,
served on 10 November. This indicates that the absorptive       followed by 1.9 % at 675 nm, 1.0 % at 870 nm and 0.6 %
ability of the aerosol was attenuated with increasing wave-     at 440 nm. For the case at around 12:00, although the SSA
length on 7 November, whereas enhanced aerosol absorbance       was relatively low in the 440 nm band (∼ 0.840–0.859), it
with wavelength occurred on 10 November. From the dis-          remained almost constant from 675 to 1020 nm for CW193
cussion above, we can see that the wavelength dependences       and AERONET; it was characterized by a small fluctuation
of the SSAs from CW193 and CARSNET were both highly             amplitude of ∼ 0.930–0.935 for the former and ∼ 0.926–
consistent with that from AERONET, indicating that this re-     0.931 for the latter. The highest deviation for a specific
trieval showed good performance for aerosol optical proper-     wavelength, ∼ 1.8 %, was measured in the 440 nm band, fol-
ties.                                                           lowed by 0.8 % at 1020 nm, 0.6 % at 675 nm and 0.1 % at
   To elaborate the SSA assessment, we present a com-           870 nm. The SSA showed more obvious fluctuations for the
prehensive comparison of the accuracy in detail here. On        10 November case. Specifically, the peak SSAs from CW193
6 November, the SSA peaked in the 675 nm band, with val-        and AERONET were both observed in the 440 nm band, with
ues of ∼ 0.848, 0.857 and 0.853 for CW193, CARSNET              values of ∼ 0.844 and 0.832, respectively. Likewise, the low-
and AERONET, respectively. The deviations of these max-         est values of ∼ 0.733 and 0.708 for these two were measured
ima for CW193 and CARSNET compared with AERONET                 in the 1020 nm band. However, the variation of the deviation
were ∼ 0.1 % and 0.3 %, respectively. In this case, the SSA     at a specific wavelength did not show a regular pattern com-
of CW193 varied within a narrow range of ∼ 0.834–0.848,         pared with the SSA. The largest deviation of ∼ 3.5 % was
whereas that of AERONET was ∼ 0.836–0.853. The high-            found in the 1020 nm band, followed by ∼ 2.6 % at 870 nm,
est deviation for a specific wavelength of CW193 was found      ∼ 1.4 % at 440 nm and ∼ 0.7 % at 765 nm. In conclusion, the
in the 1020 nm band, with a value of ∼ 1.7 %, and the low-      SSA deviation between CW193 and AERONET varied in the
est was found in the 440 and 870 nm bands, with a value of      range of ∼ 0.1 %–1.8 %, ∼ 0.6 %–1.9 %, ∼ 0.1 %–2.6 % and
∼ 0.1 %. As mentioned above, the SSA showed an increas-         ∼ 0.8 %–3.5 % for the 440, 675, 870 and 1020 nm bands, re-
ing trend with wavelength for the two cases on 7 November.      spectively, indicating a high consistency with AERONET.
The smallest SSA values were all observed in the 440 nm
bands, with values varying in the range of ∼ 0.858–0.861 and
∼ 0.840–0.859, respectively. For the case at around 08:00,
the maximum of CW193 was found in the 870 nm band,

https://doi.org/10.5194/amt-15-2139-2022                                         Atmos. Meas. Tech., 15, 2139–2158, 2022
2152                                 Y. Zheng et al.: Evaluation of aerosol microphysical, optical and radiative properties

                                                                 (BOA) varies from −86 ± 31 to −132 ± 50 W m−2 , whereas
                                                                 the ADRF at the top of the atmosphere (TOA) varies from
                                                                 −35 ± 18 to −55 ± 26 W m−2 , based on a 5-year observa-
                                                                 tion campaign in urban Beijing. Therefore, it can be seen that
                                                                 the BOA and TOA retrievals of CW193 and CARSNET all
                                                                 show a reasonable range of values in this campaign. Specif-
                                                                 ically, the BOAs of CW193 were −127.1, −65.6, −108.4
                                                                 and −105.6 W m−2 for the four cases in chronological order,
                                                                 respectively. Correspondingly, the BOAs from AERONET
                                                                 were −113.2, −58.4, −103.5 and −95.0 W m−2 . Thus, the
                                                                 deviation of the BOA in these cases was ∼ 12.2 %, 12.3 %,
                                                                 4.8 % and 11.2 %, respectively, suggesting an overestima-
                                                                 tion of BOA compared with AERONET. For the TOAs,
                                                                 the CW193 retrievals for these cases were −22.8, −25.6,
                                                                 −34.3 and −16.5 W m−2 , whereas the reference values from
Figure 10. Comparison of the retrieved SSAs from CW193,          AERONET were −25.3, −22.1, −32.6 and −15.3 W m−2 ,
CARSNET and AERONET for four selected cases.                     respectively. That is, the TOA deviation found in these cases
                                                                 was ∼ 9.8 %, 15.9 %, 5.4 % and 7.4 %, respectively. In sum-
                                                                 mary, the deviation of the retrieval BOA was ∼ 5 %–12 %,
                                                                 whereas it was ∼ 5 %–16 % for the TOA. As shown above,
                                                                 the relatively large uncertainties can be partly explained by
                                                                 the inherent algorithm error, as well as the difference in ob-
                                                                 servation time.

                                                                 3.4   Water vapor evaluation

                                                                 Water vapor (WV) is a key atmospheric component in stud-
                                                                 ies of climate change because it not only has an important
                                                                 role in aerosol aging but it can also influence the energy bud-
                                                                 get of the earth–atmosphere system by absorbing and scatter-
                                                                 ing solar energy. Therefore, in this study, the precision per-
                                                                 formance of WV from CW193 was validated in detail using
                                                                 AERONET as a reference.
Figure 11. Comparison of the retrieved ADRF values from CW193,
CARSNET and AERONET for four selected cases.
                                                                    Figure 12 shows a comparison of the WV from CW193
                                                                 with the results from AERONET. In Fig. 12a, it can be seen
                                                                 that the WV from CW193 agrees well with the AERONET
3.3.3   Aerosol direct radiative forcing                         WV, with a correlation coefficient (R) of ∼ 0.997. From
                                                                 this linear regression, the slope was ∼ 0.941, suggesting
The ADRF is a key factor influencing the radiation budget of     that the WV from CW193 tends to be lower than that from
the earth–atmosphere system; any small perturbation to this      AERONET. In terms of RMB values, it is found that the WV
global energy balance can cause a profound change in the         from CW193 is underestimated by ∼ 2.1 % (RMB = 0.979).
climate (García et al., 2012). In this context, much progress    EE analysis showed that the retrieved columnar WV (100 %)
had been made in this field to provide insight into the cli-     was within the EE. In addition, the small RMSE (∼ 0.020)
mate effects of aerosols. A previous study estimated the total   also indicated that the CW193 WV was highly concentrated
anthropogenic radiative effect at the global scale to be +1.6    in the reference AERONET range.
(−1.0 to +0.8) W m−2 , of which −0.5 (±0.4) W m−2 are as-           Figure 12b shows the CW193 WV bias compared with
sociated with the direct radiative forcing of aerosols (García   equal-frequency bins of WV from AERONET. From this
et al., 2008). However, it can be seen that there remains huge   boxplot, it can be seen that the bias varies in the range of
uncertainty in the evaluation of the ADRF. For this reason,      −0.04 to 0.04, whereas its mean values (red dots) are concen-
we selected this important product of CW193 to examine the       trated in a narrower range from −0.02 to 0.02. As reported
accuracy of the radiative retrieval.                             by Holben et al. (1998), the uncertainty of the WV retrieval
   In Fig. 11, we show a comparison of the ADRF values           has been found to be less than 12 %, based on an intercom-
from CW193, CARSNET and AERONET for the four cases               parison with radiosonde results. In this study, the overall WV
(6 and 10 November and two on 7 November). As reported           bias of CW193 was roughly lower than 4 %, demonstrating
by Zheng et al. (2019), the ADRF at the earth’s surface          the accurate measurement capability of CW193 for columnar

Atmos. Meas. Tech., 15, 2139–2158, 2022                                           https://doi.org/10.5194/amt-15-2139-2022
You can also read