EVALUATION OF A CUSTOM QIASEQ TARGETED DNA PANEL WITH 164 ANCESTRY INFORMATIVE MARKERS SEQUENCED WITH THE ILLUMINA MISEQ
←
→
Page content transcription
If your browser does not render page correctly, please read the page content below
www.nature.com/scientificreports
OPEN Evaluation of a custom QIAseq
targeted DNA panel with 164
ancestry informative markers
sequenced with the Illumina MiSeq
D. Truelsen1*, A. Freire‑Aradas2, M. Nazari3, A. Aliferi3, D. Ballard3, C. Phillips2, N. Morling1,4,
V. Pereira1 & C. Børsting1
Introduction of new methods requires meticulous evaluation before they can be applied to forensic
genetic case work. Here, a custom QIAseq Targeted DNA panel with 164 ancestry informative markers
was assessed using the MiSeq sequencing platform. Concordance, sensitivity, and the capability for
analysis of mixtures were tested. The assay gave reproducible and nearly concordant results with an
input of 10 and 2 ng DNA. Lower DNA input led to an increase in both locus and allele drop-outs, and
a higher variation in heterozygote balance. Locus or allele drop-outs in the samples with less than
2 ng DNA input were not necessarily associated with the overall performance of a locus. Thus, the
QIAseq assay will be difficult to implement in a forensic genetic setting where the sample material is
often scarce and of poor quality. With equal or near equal mixture ratios, the mixture DNA profiles
were easily identified by an increased number of imbalanced heterozygotes. For more skewed mixture
ratios, the mixture DNA profiles were identified by an increased noise level. Lastly, individuals from
Great Britain and the Middle East were investigated. The Middle Eastern individuals showed a greater
affinity with South European populations compared to North European populations.
There is an increasing interest in sequencing and analysing ancestry informative markers (AIMs) in forensic
genetic casework because AIMs may generate investigative leads in cold cases and support the identification
of missing p ersons1. The introduction of massively parallel sequencing (MPS) simplified the typing of high
numbers of single nucleotide polymorphisms (SNPs) that are typically used to infer the ancestry of an unknown
individual2,3. Currently, there are two commercial MPS panels available for AIM SNP genotyping: the Preci-
sion ID Ancestry P anel4–7 and the ForenSeq DNA Signature Prep K it7–12. Both panels amplify AIMs that are
useful for the continental differentiation of human population groups. With these and other well-established
panels in place, the search for markers that may resolve genetic patterns on a fine geographical scale has been
initiated13–15. From a forensic perspective, the ability to differentiate individuals of Middle Eastern ancestry
from individuals with European ancestry is challenging. The Middle East has throughout time been the centre
of many different population migrations between Africa, Asia, and Europe, which have altered the demography
and genetic structure within the a rea16–18. Large amounts of gene flow from the surrounding regions have made
individuals from the Middle East particularly difficult to differentiate from Europeans and South Asians using
global ancestry panels13,19–22.
Several PCR-based assays such as the Ion AmpliSeq (Thermo Fisher Scientific), GeneRead (Qiagen), and the
ForenSeq DNA Signature Prep Kit (Verogen) have been used in forensic genetics for various purposes4,10,23–27.
Here, we evaluated the applicability of the QIAseq chemistry for forensic genetic case work using a custom panel
of 164 SNPs specifically selected to differentiate Middle Eastern, South Asian, and European p opulations15,24. The
QIAseq chemistry was originally designed for cancer diagnostics to detect variants with low frequencies in cell
populations28,29. The assay has been used in forensic genetics for the identification of mass disaster and genocide
victims through the work by the International Commission on Missing Persons (https://www.icmp.int/). In the
QIAseq assay, the first step of the protocol is an enzymatic fragmentation of the DNA followed by ligation of
1
Section of Forensic Genetics, Department of Forensic Medicine, Faculty of Health and Medical Sciences,
University of Copenhagen, 2100 Copenhagen, Denmark. 2Forensic Genetics Unit, Institute of Forensic Sciences,
University of Santiago de Compostela, Santiago de Compostela, Spain. 3Faculty of Life Sciences and Medicine,
King’s College, London, UK. 4Department of Mathematical Sciences, Aalborg University, 9220 Aalborg,
Denmark. *email: forensic.genetics@sund.ku.dk
Scientific Reports | (2021) 11:21040 | https://doi.org/10.1038/s41598-021-99933-2 1
Vol.:(0123456789)www.nature.com/scientificreports/
adapters with molecular barcodes known as unique molecular indices (UMI). UMIs increase the sensitivity of
variant detection and allow identification of variants present in extremely low frequencies such as tumour-derived
mutations28. True variants will be present in almost all reads with the same UMI, whereas PCR or sequencing
errors are easily detected as artefacts since they are only present in some of the reads with the same UMI30. The
QIAseq assay can be sequenced with both the MiSeq (Illumina) and the Ion S5 (Thermo Fisher Scientific). In
this work, the test was performed with the MiSeq.
When evaluating new chemistries in a forensic context, it is important to investigate the adequacy of these
methods to low and/or poor quality DNA samples and to define stringent quality standards for data analysis.
With this in mind, we investigated; (1) the sensitivity of the assay, (2) the concordance with previously obtained
results to assure correct sequencing of genotypes, (3) the reproducibility within and between labs, and (4) the
capability to identify mixtures. Individuals from Syria, individuals self-declared as of Middle Eastern origin
(primarily from Iran and Iraq), and individuals from Great Britain were genotyped. This was done to test the
ability of the selected markers to differentiate Europeans from individuals from the Middle East. The aim was
to evaluate if the QIAseq assay proved to be reliable and sensitive enough in a forensic context, and if it could
be used as an alternative for library preparation to other assays such as the AmpliSeq or the GeneRead assays.
Results and discussion
Sensitivity. The sensitivity of the QIAseq assay was first assessed by sequencing DNA from a Danish indi-
vidual with known genotypes using an input of 10 ng, 2.0 ng, 0.5 ng, 0.25 ng, and 0.125 ng genomic DNA. A
control sample of 40 ng from the same individual was also genotyped at University of Copenhagen (UCPH) as
the QIAseq protocol recommends an input of 10–40 ng DNA. At UCPH, the dilution series was typed in dupli-
cate, and at King’s College, London (KCL) it was typed once.
Figure 1 shows the percentage of correctly assigned genotypes, locus- and allele drop-outs for each dilution
with a minimum read depth of 20 and heterozygote balance (Hb) of 0.3–3.0. For both replicates of the control
sample with 40 ng input DNA, the SNP rs718501 presented Hb above 3.0.
This particular locus was also problematic with 10 ng and 2 ng input DNA. A total of six discordances were
found. Three discordances were due to locus drop-outs (Hb > 3.0), and the other three discordances were due
to allele drop-outs. The known rs718501 genotype of the Danish individual was rs718501 [AC], whereas it was
determined as either [AA] or [AC] with the QIAseq assay. The SNP rs718501 generally performed poorly with
all dilutions tested in the sensitivity study (Supplementary Table S3). The locus either displayed Hb outside the
specified threshold (4 dilutions), allele drop-outs (5 dilutions) or locus drop-out (4 dilutions). In contrast, the 50
Syrian individuals had a median Hb of 1.048, a median locus balance of 1.395, and a median noise of 0.703% for
this particular locus. The discrepancies observed in the Danish sample was likely caused by poor amplification of
the C allele (92% of all reads had the A allele) due to sequence variation in the target specific PCR primer bind-
ing site. Besides these eight inconsistencies for the same locus, full concordance was obtained with 40 ng, 10 ng,
and 2 ng of DNA both between replicates and between laboratories. In comparison, forensic genetic laboratories
routinely generate DNA profiles from 100 to 200 pg DNA using commercial or in-house developed a ssays31–34.
As expected, the number of drop-outs increased with decreasing amount of input DNA. However, there was
no obvious pattern in the loci that suffered from drop-outs (Supplementary Tables S3–S5). The numbers of locus
or allele drop-outs between replicates, laboratories, and DNA input amounts were not consistent (Supplemen-
tary Tables S4, S5). Locus drop-outs were not necessarily observed in loci with low read depths (Supplementary
Fig. S1) and allele drop-outs were not necessarily observed in loci with skewed heterozygote balances (Supple-
mentary Fig. S2) or high levels of noise (Supplementary Fig. S3).
The 96 allele drop-outs observed in the sensitivity study were divided among 46 different loci (Supplementary
Table S5) and in 17 of these loci, allele drop-out was only observed once. These features make it difficult to select
and exclude poorly performing loci from the assay. Overall, fewer locus drop-outs were observed at KCL that
also had higher read depths compared to UCPH data. However, while the number of locus drop-outs was lower
for KCL, the number of allele drop-outs was higher for analyses with 0.25 and 0.125 ng input DNA compared
to the UCPH data. When 0.125 ng of input DNA was used, more than 50% of the genotype calls were incorrect
for both KCL and UCPH (Fig. 1).
Figure 2 shows the Hb for the different amounts of DNA used in the sensitivity study (minimum read
depth = 20). The balance for genotypes ranged from 0.1 to 8.4 for the UCPH sensitivity study, and from 0.12 to 9.0
for the KCL sensitivity study. Increased Hb with decreasing DNA input was observed in both laboratories (Fig. 2a
and 2b). A total of 10.3% and 9.5% of the heterozygous genotypes in the UCPH and KCL sensitivity studies were
outside the acceptable Hb range. This was much higher than those observed with the GeneRead and AmpliSeq
assays, where only 0.12% and 0.17% of the genotypes were outside the defined threshold of 0.3–3.023,24. The
reduced sensitivity and large variation in read depth observed for the QIAseq assay compared to the two PCR-
MPS assays may be attributed to the different library preparation methods. The reduced sensitivity of the assay
and the randomness in locus- and allele drop-outs indicated that the adapter ligation step was not efficient.
Overall, the results showed that although the genotyping was reproducible for high input amounts of DNA, the
QIAseq assay was not sufficiently sensitive to meet the requirements in forensic genetics.
Genotype concordance. Four Coriell samples (two Central European (CEU) individuals, one individual
from Yoruba, Ibadan, Nigeria (YRI), and one Southern Han Chinese individual from China (CHS)) were typed
with the QIAseq assay, and genotype concordance was checked with known reference data. In total, three dis-
cordances were observed. Two discordances were due to locus drop-out in the QIAseq assay for rs1470637 for
one CEU individual and the YRI individual. One discordance was an allele drop-out in rs4834738 using the
QIAseq assay for one of the CEU individuals (NA06994). The reference data reported the genotype as [CT],
Scientific Reports | (2021) 11:21040 | https://doi.org/10.1038/s41598-021-99933-2 2
Vol:.(1234567890)www.nature.com/scientificreports/
a
100
90
80
Fraction of loci in %
70
60
50
40
30
20
10
0
40 ng 10 ng 2.0 ng 0.5 ng 0.25 ng 0.125 ng
% Locus drop-out % Allele drop-out % Correctly assigned genotype
b 100
90
80
Fraction of loci in %
70
60
50
40
30
20
10
0
40 ng 10 ng 2.0 ng 0.5 ng 0.25 ng 0.125 ng
% Locus drop-out % Allele drop-out % Correctly assigned genotype
c 100
90
80
Fraction of loci in %
70
60
50
40
30
20
10
0
10 ng 2.0 ng 0.5 ng 0.25 ng 0.125 ng
% Locus drop-out % Allele drop-out % Correctly assigned genotype
Figure 1. Sensitivity study. Percentage of correctly assigned genotypes, locus- and allele drop-outs for each
dilution using a minimum read depth of 20 reads and a heterozygote balance of 0.3–3.0. (a) Samples analysed at
UCPH, replicate 1; (b) samples analysed at UCPH, replicate 2; (c) samples analysed at KCL. Light grey indicates
the % correctly assigned genotypes, medium grey indicates the % allele drop-outs, and dark grey indicates the %
locus drop-outs.
while the QIAseq assay typed the individual as [TT]. This was observed by both UCPH and KCL. An analysis
in IGV showed around 2.6% reads for the C allele. This could indicate the presence of a partial null allele in
the CEU individual for this particular locus. The four Coriell samples were sequenced using 10 ng DNA and
were therefore within the range specified in the QIAseq protocol. Besides the three discordances, concordant
genotypes were obtained, which underlined that the QIAseq genotyping was reliable when sufficient amounts
of DNA were used.
Mixtures. Samples with DNA contributions from two or more people are frequently collected from crime
scenes, which makes it important to identify a given sample as a mixture. With bi-allelic loci such as SNPs and
insertion/deletions, this requires a detailed analysis of the allele read count(s). DNA mixtures were constructed
from DNA from the two CEU Coriell samples (CEU1 and CEU2) in ratios of 1:18, 1:6, 1:2, 3:2, and 5:1, and
the ability to identify mixtures was evaluated. The two samples had different genotypes at 78 loci. At nine out of
these 78 positions, the two individuals were opposite homozygotes. Figure 3 shows the ratio of allele counts for
CEU1 divided by the allele counts for the CEU2 individual for the nine loci. Ratios were log10-transformed to
allow better comparison. The ratio between the read counts for the two alleles at the nine loci were consistent
with the ratio of the mixture.
For the mixtures of 1:2, 1:6, 3:2, and 5:1, the called genotypes at the nine opposite homozygote loci were
mixtures of one allele from each contributing individual. For the 1:18 mixture, the called genotypes at the nine
loci were those of the major contributor only (CEU2). However, the read depth of the alleles from the minor
contributor was still above the read depth threshold of 20 reads. Table 1 shows the number of genotypes that fell
outside the Hb threshold of 0.3–3.0. The number of imbalanced heterozygous genotypes increased markedly for
Scientific Reports | (2021) 11:21040 | https://doi.org/10.1038/s41598-021-99933-2 3
Vol.:(0123456789)www.nature.com/scientificreports/
a b
0.125 ng 0.25 ng 0.5 ng 2 ng 10 ng 40 ng 0.125 ng 0.25 ng 0.5 ng 2 ng 10 ng 40 ng
Figure 2. Log transformed heterozygote balances in the sensitivity study. (a) UCPH. (b) KCL. Heterozygote
balance was estimated as the number of reads for a nucleotide divided by the number of reads for the other
nucleotide in the called genotype in the following order: A, C, G, and T. The outliers observed for 40 and 10 ng
DNA input (a) represent the rs718505 locus as discussed in the sensitivity paragraph.
Log10 (read depth CEU1 allele/read depth CEU2 allele)
1:18 1:6 1:2 3:2 5:1
Figure 3. Mixture study. The read depth ratio for the nine loci for which the two individuals were opposite
homozygotic. The read depth ratio was calculated as the number of reads for the allele of CEU1 divided by the
number of reads for the allele of CEU2.
Scientific Reports | (2021) 11:21040 | https://doi.org/10.1038/s41598-021-99933-2 4
Vol:.(1234567890)www.nature.com/scientificreports/
No. of genotypes outside Average number of observed Average number of observed
Sample mixture ratio specified Hb thresholds* Range of Hb Number of loci with noise† > 3% heterozygotes homozygotes
1:2 67 0.12–8.4 1 96.5 67.5
1:6 27 0.11–8.67 56 69 95
1:18 1 0.21–2.59 55 55 109
3:2 61 0.14–7.65 2 96 68
5:1 45 0.12–8.93 42 75.5 88.5
No. of genotypes outside Average number of observed Average number of observed
Single source samples specified Hb thresholds* Range of Hb Number of loci with noise† > 3% heterozygotes homozygotes
CEU1 0 0.4–1.43 12 52 112
CEU2 1 0.38–3.40 0 55 109
Table 1. Mixture study. *Heterozygote balance thresholds used: 0.3 ≥ Hb ≤ 3.0. † Noise was calculated as the
number of reads that were different from the called genotype divided by the total number of reads for the
marker.
the mixed DNA samples compared to those of the single source samples, which demonstrated that it was possible
to identify mixtures by identifying an increased number of heterozygote genotypes with a high heterozygote
imbalance. This pattern has been observed previously32,35.
The low differentiation power of SNPs in mixtures is one of the biggest disadvantages compared to S TRs36.
Especially if the ratio of the major and minor contributors is highly skewed, it can be difficult to identify the
presence of a mixed DNA sample35,37. Table 1 shows that there was a clear increase in the number of loci with
a noise level higher than 3% for the 1:5, 1:6 and 1:18 mixtures. This indicates that many loci with high levels of
noise is a clear indicator of a mixed sample, which was also observed previously for AmpliSeq a ssays32.
Population genetics. Possible deviations from HWE were tested for the British, Syrian, and Middle East-
ern individuals. After Bonferroni correction (p-value: 0.00031), all loci were in HWE. For the LD analysis, only
individuals with full DNA profiles were used (Syria: N = 31, Middle East: N = 14, and Britain: N = 28). Rutgers
Map Interpolator was used to infer distance in cM (compgen.rutgers.edu/map_interpolator.shtml). The LD test
was performed for 13,203 combinations of loci. After Bonferroni correction (p-value = 3.79E−06), three pairs of
loci displayed significant LD for the Syrian individuals: rs11746746 and rs4552703 (chromosome 5 and chromo-
some 6), rs2472304 and rs359955 (chromosome 15 and chromosome 1), and rs3099359 and rs424765 (chromo-
some 13 and chromosome 15). Two pairs of loci were in significant LD among the British individuals: rs1446585
and rs7570971 (both loci are on chromosome 2 separated by 0.28 cM), and rs1446585 and rs932206 (both loci
are on chromosome 2 separated by 0.22 cM). Finally, two pairs of loci were in significant LD among the Middle
Eastern individuals: rs10509722 and rs10994740 (both loci are on chromosome 10 separated by 40.07 cM), and
rs310362 and rs39897 (chromosome 8 and chromosome 5).
The genetic relationships of the sequenced individuals and reference populations from 1000 Genomes (Sup-
plementary Table S2) were visualized with PCA (Fig. 4). PC1 and PC2 described 24.23% and 8.94% of the
variation, respectively. The reference African individuals all clustered together and were clearly separated from
the rest of the populations. The loci in the QIAseq assay could also separate South Asian, European, and East
Asian individuals. The Middle Eastern individuals typed here were located between the European, and South
Asian individuals (Supplementary Fig. S5). The British individuals were clustered within the European reference
populations as expected (Supplementary Fig. S4).
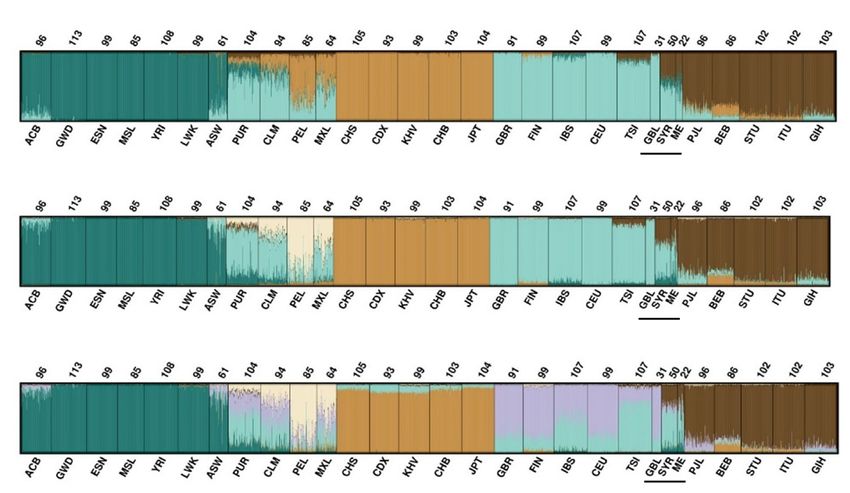
The same test and reference data were analysed with STRUCTURE38–41 to investigate the ancestry of the
individuals. Figure 5 shows the STRUCTURE results for K = 4 to K = 6 for 163 loci included in the QIAseq
custom assay where K = 6 was the most likely number of clusters. At K = 5, clustering was observed between
individuals from African, American, East Asian, European, and South-Central Asian populations. The Central
and South American populations had high levels of European admixture. The British individuals shared cluster
membership with the European reference population. Syrian and the Middle Eastern individuals primarily
displayed European and South-Central Asian ancestry components. At K = 6, a new component was observed,
that subdivided European individuals, reflecting northern (Great Britain and Finland) and southern European
populations (Spanish and Italian).
The assay included a subset of loci that were previously tested (reference 15 and 24). The assay had fewer loci
for European/Middle East differentiation compared to that of the EUROFORGEN NAME panel15, but on the
other hand included more loci informative for differentiation of South-Central Asians. Differentiation between
South-Central Asian populations and European populations was observed at K = 4. Separation of Middle Eastern
populations from its surrounding regions of both Europe and South Asia was harder to obtain. Nevertheless, the
markers in the QIAseq assay provided a better separation of the Middle Eastern cluster from the European and
South-Central Asian clusters compared to those of global p anels4,19,42. The STRUCTURE and PCA plots dem-
onstrated the admixed nature of the Middle Eastern individuals analysed here. The Middle Eastern individuals
shared the greatest affinity with the Southern than the Northern European components as seen by o thers13,42,43.
Dividing the European population into Northern and Southern Europeans could potentially provide an increased
differentiation between Northern Europe and the Middle East.
Scientific Reports | (2021) 11:21040 | https://doi.org/10.1038/s41598-021-99933-2 5
Vol.:(0123456789)www.nature.com/scientificreports/
Figure 4. PCA plot of the studied populations and 1000 Genomes reference data. Meta-populations are listed
in Table S2. ‘EASIA’ refers to East Asia and ‘SASIA’ refers to South-Central Asia.
Conclusions
The performance of the QIAseq assay showed consistent results when 10 to 40 ng DNA was used as specified in
the protocol. Reliable results were also obtained with 2 ng DNA though with larger variation in the heterozygote
balance. For DNA input below 2 ng, the assay displayed a high number of allele- and locus drop-outs. Here, the
variation in heterozygote balance was high and around 10% of the genotypes displayed Hb outside the range of
0.3–3.0. Allele- and locus drop-outs were not consistent between replicates of the same concentration or between
laboratories. Even loci that performed well experienced drop-outs, and it was, therefore, difficult to exclude
poorly performing loci in the downstream analysis. The reduced sensitivity and large variation in read depth
was likely due to the library preparation methods. The randomness in locus- and allele drop-outs indicated that
the adapter ligation step was inefficient. The results showed that although the genotyping was reproducible for
high input amounts of DNA, the QIAseq assay was not sufficiently sensitive for the low DNA concentrations
often found in forensic genetics casework.
Samples with DNA from more than one contributor were easily detected by analysing the read counts. A high
number of imbalanced heterozygous genotypes indicated a mixture with almost equal contributions from two
people, whereas a high number of loci with noise above 3% indicated that the sample was a mixture with more
skewed contributions from two people.
Except for three discordances of which two were due to locus drop-outs, there was full concordance between
the SNP types of the Coriell samples typed with the QIAseq assay and the reference data.
Lastly, British and Middle Eastern individuals were typed for the loci in the QIAseq assay. The 163 markers
included in the QIAseq assay provided a better separation of the Middle Eastern individuals than other reported
panels. At K = 4, a South Asian cluster was easily identified. At K = 6, a Northern and Southern European gradient
was identified. No distinct cluster for the Middle Eastern individuals was observed, and the greatest overlap was
with the South European populations.
Materials and methods
The work was performed as a collaboration between The University of Copenhagen (UCPH), University of
Santiago de Compostela (USC), and King’s College, London (KCL).
SNP markers. A custom-made panel consisting of 164 SNPs was used (Supplementary Table S1). The loci
were selected for the differentiation of individuals from Europe, the Middle East, North Africa, and South Asia as
previously described (reference 15 and 24). In addition to the EUROFORGEN NAME P anel15, the QIAseq assay
also included loci for differentiating Europeans from South-Central Asians and North Africans.
Scientific Reports | (2021) 11:21040 | https://doi.org/10.1038/s41598-021-99933-2 6
Vol:.(1234567890)www.nature.com/scientificreports/
K=4
K=5
K=6
Figure 5. STRUCTURE plot with K = 4 to K = 6 using 163 SNPs. Numbers above each population refers to
the sample size. Population abbreviations on the horizontal axis: Gambia, Africa (GWD), Esan, Nigeria (ESN),
Mende, Sierra Leone (MSL), Yoruba, Ibadan, Nigeria (YRI), Luhya, Kenya (LWK), African American SW
USA (ASW), Puerto Rican, Puerto Rico (PUR), Colombian in Medellin, (CLM), Peruvians, Lima, Peru (PEL),
Mexican, Los Angeles (MXL), Southern Han Chinese, China (CHS), Chinese Dai, Xishuangbanna (CDX),
Kinh, Vietnam (KHV), Han Chinese, Beijing, China (CHB), Japanese, Tokyo, Japan (JPT), British, England
and Scotland (GBR), Finnish, Finland (FIN), Iberians, Spain (IBS), Utah residents, North and West European
ancestry (CEU), Toscans, Italy (TSI), British individuals, Great Britain (GBL) from this study, Syrians, Syria
(SYR) from this study, Middle East (ME) from this study, Punjabi, Lahore, Pakistan (PJL), Bengali, Bangladesh
(BEB), Tamil, Sri Lanka, from United Kingdom (STU), Teluga, India, from United Kingdom (ITU), and
Gujarati, India, Houston Texas (GIH). Populations with a black line below the name are the populations
genotyped in this study.
Samples, DNA extraction, and quantification. Sensitivity. To test the sensitivity of the QIAseq Tar-
geted DNA Panel, a DNA dilution series was made from a Danish individual with known genotypes for the
selected loci. The DNA was extracted from blood using the QIAamp DNA Blood Mini kit (Qiagen) following
the manufacturer’s recommendations. The sample was quantified using the Quantifiler Trio DNA Quantifica-
tion kit (Thermo Fisher Scientific) in quadruplicate and diluted to the following concentrations: 1 ng/µL, 0.2 ng/
µL, 0.05 ng/µL, 0.025 ng/µL, and 0.0125 ng/µL. 10 µL of each sample was used for the library preparation. The
dilution series was subsequently quantified using the Quantifiler Trio DNA Quantification kit (Thermo Fisher
Scientific). The dilution series was sequenced once at KCL and in duplicate at UCPH.
Coriell reference and mixture samples. To evaluate the concordance between labs, four Coriell reference samples
(1 ng/µL) with known genotypes and ancestry were analysed; two Europeans (CEU): NA06994 and NA07000,
one African individual (YRI): NA18498, and one Asian individual (HCS): HG00403. Coriell samples are sam-
ples with known genotypes and ancestral background. The samples can be purchased from the Coriell Institute
for Medical Research. USC was responsible for the purchase and distribution of the samples used in this study.
Mixture DNA was prepared from the Coriell samples NA06994 (CEU1) and NA07000 (CEU2) in the follow-
ing ratios: 1:18, 1:6, 1:2, 3:2, and 5:1. DNA was quantified using the Qubit dsDNA High Sensitivity (HS) assay kit
and the Qubit Fluorometer (Thermo Fisher Scientific) or the Quantifiler Trio DNA Quantification kit (Thermo
Fisher Scientific). The Coriell samples and the DNA mixtures were sequenced once in both laboratories.
Population samples. Fifty unrelated Syrian individuals, 31 unrelated British individuals, and 22 unrelated Mid-
dle Eastern individuals were sequenced using the QIAseq custom panel. The Syrian samples were selected from
the Biobank at the Department of Forensic Medicine, University of Copenhagen, Denmark. All samples were
anonymised. The project was notified to the Ethics Committee for the Capital Region of Denmark (journal no.
H-20006810). According to the Danish Act on Research Ethics Review of Health Research Projects, the work did
not require approval by the Ethics Committee. DNA was extracted from buccal swabs on FTA cards (Whatman
Inc., Clifton, NJ) with a BioRobot EZ1 workstation (Qiagen, Hilden, Germany) using the manufacturer’s proto-
Scientific Reports | (2021) 11:21040 | https://doi.org/10.1038/s41598-021-99933-2 7
Vol.:(0123456789)www.nature.com/scientificreports/
col. The concentrations of the Syrian DNA extracts were measured using the Qubit dsDNA High Sensitivity (HS)
assay kit and the Qubit Fluorometer (Thermo Fisher Scientific).
The British and Middle Eastern individuals were typed at KCL using the QIAseq custom panel. DNA was
extracted using either Chelex 100 resin (Bio-Rad) or the QIAamp DNA Investigator Kit (Qiagen). DNA extracts
were quantified using the Quantifiler Trio DNA Quantification kit (Thermo Fisher Scientific). Ethical approval
for the study was granted by King’s College BDM Research Ethics Subcommittee (RESCM-18/19-2989) and all
samples were collected with informed consent. The authors confirm that all methods were performed in accord-
ance with the relevant guidelines and regulations.
A total of 5–10 ng DNA was used in the assay for all population samples.
Library preparation. DNA libraries were built using the QIAseq Targeted DNA Panel kit (Qiagen) follow-
ing the manufacturer’s protocol. The library kit and primer pool were kindly provided for testing by Qiagen. The
DNA was enzymatically fragmented and end-repaired in the same reaction mix consisting of DNA (up to 16.75
µL), 2.5 µL Fragmentation Buffer 10x, 0.75 µL FERA solution, and a variable volume of nuclease-free water. The
final reaction volume was 20 µL. Subsequently, 5 µL of Fragmentation Enzyme mix was added to each reaction.
Samples were incubated for 1 min at 4 °C, 24 min at 32 °C, 30 min at 72 °C, and 4 °C on hold. Immediately
after the fragmentation step, adapter ligation was performed by preparing a mix of 25 µL reaction mix from the
previous step, 10 µL 5× Ligation Buffer, 7.2 µL Ligation solution, 2.8 µL IL-N7## adapter, and 5 µL DNA Ligase.
Adapters were available with 12 different indices (IL-N701–N715), which combined with the 8 different Index
primers (IL-S502–S511) gave a multiplex capacity of 96 samples. The reactions were incubated for 15 min at
room temperature. The ligated adapters contain the UMIs and the sample index. After the sequencing run of
the dilution series, a large number of adapter dimers were observed, when the DNA input was lower than speci-
fied in the protocol. To avoid adapter dimers and to maintain a balance between adapters and sample DNA, the
amount of adapters had to be reduced when working with lower input than that specified in the protocol. When
adjusting the amount of adapter for the samples with a lower DNA amount than specified in the protocol, the
adapter dimer formation decreased markedly (Supplementary Fig. S6). To accommodate for this, adapters were
diluted 10 times with nuclease-free water for the 2 ng, 0.5 ng, 0.25 ng, and 0.125 ng input DNA in the sensitivity
study (Supplementary Fig. S6). The adapters were diluted twice for the Syrian individuals.
Following the adapter ligation step, a double clean-up was performed using QIAseq beads. Target enrichment
was performed by preparing: 9.4 µL adapter-ligated DNA from the previous step, 4 µL 5 × TEPCR buffer, 5 µL
QIAseq Targeted DNA Panel, 0.8 µL IL-Forward primer, and 0.8 µL HotStarTaq DNA Polymerase (Qiagen). The
following cycling conditions were used for the first PCR: initial denaturation for 13 min at 95 °C and 2 min at
98 °C, 8 cycles of 15 s at 98 °C and 10 min at 68 °C, 1 cycle of 5 min at 72 °C, 1 hold cycle for 5 min at 4 °C, and
hold at 4 °C. Following the target enrichment, a clean-up was performed using QIAseq beads. The second PCR, a
universal PCR, was performed by adding a mix of 4 µL 5× UPCR buffer, 1 µL HotStarTaq DNA Polymerase, and
1.6 µL nuclease-free water to each of the target-enriched libraries. A total of 20 µL PCR products were transferred
to the QIAseq 96-index I set A plate, which contained the pre-dispensed sample index primer (IL-S502–S511)
and the universal primer. The following cycling conditions were used for the second PCR: initial denaturation
13 min at 95 °C and 2 min at 98 °C, 22 cycles for 15 s at 98 °C and 2 min at 60 °C, 1 cycle for 5 min at 72 °C, 1 hold
for 5 min at 4 °C, and hold at 4 °C. Following the Universal PCR, a clean-up was performed using QIAseq beads.
Sequencing. At UCPH, quantification of the purified libraries was performed using the Qubit dsDNA High
Sensitivity (HS) assay kit and the Qubit 2.0 Fluorometer (Thermo Fisher Scientific). At KCL, libraries were
quantified using the Kapa Library Quantification Kit (Roche Sequencing). After quantification, the libraries were
normalized, pooled, and diluted to 2 nM. The pool was further diluted to either 10, 12, or 13 pM. Sequencing was
performed with the Illumina MiSeq according to manufacturer’s recommendations using paired-end sequenc-
ing (2 × 150 bp) with the MiSeq v.2 reagent kit and a custom primer (Custom Read primer 1) provided with the
QIAseq library kit.
Data analysis. Post-sequencing analysis of the FASTQ files was performed using the Genomics Workbench
v. 12.0.3 (Qiagen) with the Biomedical Genomics Analysis Plugin v. 1.2.1, corresponding target and hotspot
BED-files for the hg19 reference genome. Briefly, UMIs were trimmed, and reads were annotated with the cor-
responding UMI. UMI annotated reads were mapped to hg19, and a single consensus read, a UMI read, was cre-
ated from aligned reads that had the same UMI. A minimum of 10 UMI reads per locus was used as threshold.
Subsequently, ligation artefacts (when two DNA sequences were ligated) were removed. Potential structural
variants and indels were detected and annotated. Using the annotation of structural variants and indels, a local
realignment was performed to improve the alignment of the reads. Next, known variants were identified, and a
.csv file with the called variants was inspected. For the KCL data, the UMIs were removed during the ‘Adapter
removal’ analysis step and it was therefore not possible to create consensus UMI reads for this dataset. The
overall read depth was, therefore, higher for the KCL dataset. The workflow for the KCL data was identical to
the UCPH workflow with the exception that all UMI processing steps were removed. The UMIs are used to col-
lapse all reads with the same UMI into consensus UMI reads. The number of UMIs per locus for the sensitivity
study can be found in Supplementary Table S6. Even though the addition of UMIs to DNA fragments is part of
the library preparation in the QIAseq assay, they are not relevant to the analyses performed in this study as the
genotypes were known in advance.
Genotype calling parameters were: minimum read depth = 20 reads, acceptable homozygote genotype calls
with less than 10% noise, and acceptable heterozygote balance (Hb) was 0.3 to 3.0. Hb was calculated as the num-
ber of reads for one nucleotide divided by the number of reads for the other nucleotide in the called genotype in
Scientific Reports | (2021) 11:21040 | https://doi.org/10.1038/s41598-021-99933-2 8
Vol:.(1234567890)www.nature.com/scientificreports/
the order A, C, G, and T. All genotypes that did not meet these requirements were changed to NN. A maximum
noise level of 3% was used in the mixture analysis. The noise was estimated as the number of reads that were
different from the called genotype divided by the total number of reads for the marker in question.
Population genetics analysis. Deviations from Hardy–Weinberg expectations were estimated using
Arlequin v.3.5.2.244 and 1,000,000 Markov chain steps. Arlequin was also used to test for pairwise linkage dis-
equilibrium (LD) using an exact test. Alpha was adjusted according to the Bonferroni c orrection45.
Principal component analysis (PCA) was performed with a custom script written in R v. 3.5.0 and the ‘ade-
genet’ and the ‘ade4’ R p ackages46,47. STRUCTURE38–41 analysis was carried out to assess how good the selected
markers were at inferring ancestry components of each sample. ‘Admixture’ and ‘correlated allele frequency’
models were employed with the labelling of reference populations by the use of POPFLAG = 1. The STRUCTU
RE analysis was performed using 100,000 steps of burn-in followed by 100,000 MCMC steps. Three to seven
clusters (K) were considered with five independent runs per K. Structure Harvester was used to find the most
likely number of K 48. The software CLUMPP v.1.1.2.49 was used to combine the information from several inde-
pendent STRUCTURE runs for the same number of clusters. The output matrix is a mean of the permuted
matrices across replicates. This output from CLUMPP was visualised by Distruct v.1.150. Reference data were
obtained from the 1000 Genomes d atabase51 (Supplementary Table S2). Marker rs10907192 was not considered
in the analysis since no reference data were available.
Received: 3 February 2021; Accepted: 29 September 2021
References
1. Phillips, C. Forensic genetic analysis of bio-geographical ancestry. Forensic Sci. Int. Genet. 18, 49–65 (2015).
2. Børsting, C. & Morling, N. Next generation sequencing and its applications in forensic genetics. Forensic Sci. Int. Genet. 18, 78–89
(2015).
3. Daniel, R. et al. A SNaPshot of next generation sequencing for forensic SNP analysis. Forensic Sci. Int. Genet. 14, 50–60 (2015).
4. Pereira, V., Mogensen, H. S., Børsting, C. & Morling, N. Evaluation of the precision ID ancestry panel for crime case work: A SNP
typing assay developed for typing of 165 ancestral informative markers. Forensic Sci. Int. Genet. 28, 138–145 (2017).
5. Themudo, G. E., Mogensen, H. S., Børsting, C. & Morling, N. Frequencies of HID-ion ampliseq ancestry panel markers among
greenlanders. Forensic Sci. Int. Genet. 24, 60–64 (2016).
6. Nassir, R. et al. An ancestry informative marker set for determining continental origin: Validation and extension using human
genome diversity panels. BMC Genet. 10, 39 (2009).
7. Kidd, K. K. et al. Progress toward an efficient panel of SNPs for ancestry inference. Forensic Sci. Int. Genet. 10, 23–32 (2014).
8. Guo, F., Yu, J., Zhang, L. & Li, J. Massively parallel sequencing of forensic STRs and SNPs using the Illumina ® F orenSeqTM DNA
signature prep kit on the MiSeq F GxTM forensic genomics system. Forensic Sci. Int. Genet. 31, 135–148 (2017).
9. Ramani, A., Wong, Y., Tan, S. Z., Shue, B. H. & Syn, C. Ancestry prediction in Singapore population samples using the Illumina
ForenSeq kit. Forensic Sci. Int. Genet. 31, 171–179 (2017).
10. King, J. L. et al. Increasing the discrimination power of ancestry- and identity-informative SNP loci within the F orenSeqTM DNA
signature prep kit. Forensic Sci. Int. Genet. 36, 60–76 (2018).
11. Hussing, C. et al. Sequencing of 231 forensic genetic markers using the MiSeq F GxTM forensic genomics system—An evaluation
of the assay and software. Forensic Sci. Res. 3, 111–123 (2018).
12. Jäger, A. C. et al. Developmental validation of the MiSeq FGx forensic genomics system for targeted next generation sequencing
in forensic DNA casework and database laboratories. Forensic Sci. Int. Genet. 28, 52–70 (2017).
13. Bulbul, O., Cherni, L., Khodjet-el-khil, H., Rajeevan, H. & Kidd, K. K. Evaluating a subset of ancestry informative SNPs for dis-
criminating among Southwest Asian and circum-Mediterranean populations. Forensic Sci. Int. Genet. 23, 153–158 (2016).
14. Soundararajan, U., Yun, L., Shi, M. & Kidd, K. K. Minimal SNP overlap among multiple panels of ancestry informative markers
argues for more international collaboration. Forensic Sci. Int. Genet. 23, 25–32 (2016).
15. Pereira, V. et al. Development and validation of the EUROFORGEN NAME (North African and Middle Eastern) ancestry panel.
Forensic Sci. Int. Genet. 42, 260–267 (2019).
16. Cavalli-Sforza, L. L., Menozzi, P. & Piazza, A. The History and Geography of Human Genes (Princeton University Press, 1994).
17. Grugni, V. et al. Ancient migratory events in the middle east: New clues from the Y-chromosome variation of modern Iranians.
PLoS ONE 7, e41252 (2012).
18. Badro, D. A. et al. Y-Chromosome and mtDNA genetics reveal significant contrasts in affinities of modern middle eastern popula-
tions with European and African populations. PLoS ONE 8, e54616 (2013).
19. Truelsen, D. M. et al. Typing of two middle eastern populations with the precision ID ancestry panel. Forensic Sci. Int. Genet. Suppl.
Ser. 6, e301–e302 (2017).
20. Al-Asfi, M. et al. Assessment of the precision ID ancestry panel. Int. J. Legal Med. 5, 1–14 (2018).
21. Skoglund, P. & Mathieson, I. Ancient genomics of modern humans: The first decade. Annu. Rev. Genomics Hum. Genet. 19, 381–404
(2018).
22. Metspalu, M. et al. Most of the extant mtDNA boundaries in South and Southwest Asia were likely shaped during the initial set-
tlement of Eurasia by anatomically modern humans. BMC Genet. 5, 1–25 (2004).
23. Truelsen, D. M., Pereira, V., Phillips, C., Morling, N. & Børsting, C. The EUROFORGEN NAME AmpliseqTM custom panel: A
second tier panel developed for differentiation of individuals from the Middle East/North Africa. Forensic Sci. Int. Genet. Suppl.
Ser. 7, 846–848 (2019).
24. Truelsen, D., Pereira, V., Phillips, C., Morling, N. & Børsting, C. Evaluation of a custom GeneReadTM massively parallel sequencing
assay with 210 ancestry informative SNPs using the Ion S 5TM and MiSeq platforms. Forensic Sci. Int. Genet. 50, 102411 (2021).
25. Hussing, C., Børsting, C., Mogensen, H. S. & Morling, N. Testing of the Illumina® F orenSeqTM kit. Forensic Sci. Int. Genet. Suppl.
Ser. 5, e449–e450 (2015).
26. Churchill, J. D., Schmedes, S. E., King, J. L. & Budowle, B. Evaluation of the Illumina® beta version F orenSeqTM DNA signature
prep kit for use in genetic profiling. Forensic Sci. Int. Genet. 20, 20–29 (2016).
27. Grandell, I., Samara, R. & Tillmar, A. O. A SNP panel for identity and kinship testing using massive parallel sequencing. Int. J.
Legal Med. 130, 905–914 (2016).
28. Sim, W. C. et al. Non-invasive detection of actionable mutations in advanced non-small-cell lung cancer using targeted sequencing
of circulating tumor DNA. Lung Cancer 124, 154–159 (2018).
Scientific Reports | (2021) 11:21040 | https://doi.org/10.1038/s41598-021-99933-2 9
Vol.:(0123456789)www.nature.com/scientificreports/
29. Hu, C. et al. Association between inherited germline mutations in cancer predisposition genes and risk of pancreatic cancer. J.
Am. Med. Assoc. 319, 2401–2409 (2018).
30. Xu, C., Nezami Ranjbar, M. R., Wu, Z., DiCarlo, J. & Wang, Y. Detecting very low allele fraction variants using targeted DNA
sequencing and a novel molecular barcode-aware variant caller. BMC Genomics 18, 5 (2017).
31. Børsting, C., Mogensen, H. S. & Morling, N. Forensic genetic SNP typing of low-template DNA and highly degraded DNA from
crime case samples. Forensic Sci. Int. Genet. 7, 345–352 (2013).
32. Buchard, A., Kampmann, M.-L., Poulsen, L., Børsting, C. & Morling, N. ISO 17025 validation of a next-generation sequencing
assay for relationship testing. Electrophoresis 37, 2822–2831 (2016).
33. Ludeman, M. J. et al. Developmental validation of G lobalFilerTM PCR amplification kit: A 6-dye multiplex assay designed for
amplification of casework samples. Int. J. Legal Med. 132, 1555–1573 (2018).
34. Moura-Neto, R. et al. Evaluation of Promega P owerSeqTM Auto/Y systems prototype on an admixed sample of Rio de Janeiro,
Brazil: Population data, sensitivity, stutter and mixture studies. Forensic Sci. Int. Genet. 53, 102516 (2021).
35. Børsting, C., Rockenbauer, E. & Morling, N. Validation of a single nucleotide polymorphism (SNP) typing assay with 49 SNPs for
forensic genetic testing in a laboratory accredited according to the ISO 17025 standard. Forensic Sci. Int. Genet. 4, 34–42 (2009).
36. Børsting, C. & Morling, N. Single-nucleotide polymorphisms. In Encyclopedia of Forensic Sciences (eds Børsting, C. & Morling,
N.) 233–238 (Elsevier, 2013).
37. Børsting, C., Mikkelsen, M. & Morling, N. Kinship analysis with diallelic SNPs—Experiences with the SNP for ID multiplex in an
ISO17025 accreditated laboratory. Transfus. Med. Hemother. 39, 195–201 (2012).
38. Pritchard, J. K., Stephens, M. & Donnelly, P. Inference of population structure using multilocus genotype data. Genetics 155,
945–959 (2000).
39. Falush, D., Stephens, M. & Pritchard, J. K. Inference of population structure using multilocus genotype data: Linked loci and cor-
related allele frequencies. Genetics 164, 1567–1587 (2003).
40. Falush, D., Stephens, M. & Pritchard, J. K. Inference of population structure using multilocus genotype data: Dominant markers
and null alleles. Mol. Ecol. Notes 7, 574–578 (2007).
41. Hubisz, M. J., Falush, D., Stephens, M. & Pritchard, J. K. Inferring weak population structure with the assistance of sample group
information. Mol. Ecol. Resour. 9, 1322–1332 (2009).
42. Pakstis, A. J. et al. Genetic relationships of European, Mediterranean, and SW Asian populations using a panel of 55 AISNPs. Eur.
J. Hum. Genet. 27, 1885–1893 (2019).
43. Bulbul, O. et al. Improving ancestry distinctions among Southwest Asian populations. Forensic Sci. Int. Genet. 35, 14–20 (2018).
44. Excoffier, L. & Lischer, H. E. L. Arlequin suite ver 3.5: A new series of programs to perform population genetics analyses under
Linux and Windows. Mol. Ecol. Resour. 10, 564–567 (2010).
45. Bonferroni, C. E. Teoria statistica delle classi e calcolo delle probabilità. In Pubbl. del R Ist. Super. di Sci. Econ. e Commer. di Firenze
(1936).
46. Jombart, T. adegenet: A R package for the multivariate analysis of genetic markers. Bioinformatics 24, 1403–1405 (2008).
47. Dray, S. & Dufour, A.-B. The ade4 package: Implementing the duality diagram for ecologists. J. Stat. Softw. 22, 128–129 (2007).
48. Earl, D. A. & VonHoldt, B. M. Structure harvester: A website and program for visualizing STRUCTURE output and implementing
the Evanno method. Conserv. Genet. Resour. 4, 359–361 (2012).
49. Jakobsson, M. & Rosenberg, N. A. CLUMPP: A cluster matching and permutation program for dealing with label switching and
multimodality in analysis of population structure. Bioinformatics 23, 1801–1806 (2007).
50. Rosenberg, N. A. Distruct: A program for the graphical display of population structure. Mol. Ecol. Notes 4, 137–138 (2003).
51. Auton, A. et al. A global reference for human genetic variation. Nature 526, 68–74 (2015).
Acknowledgements
The library kit and primer pool were kindly provided by Qiagen. We thank Holger Karas and Ben Turner from
Qiagen for bioinformatical support with analysing the data using the Genomics Workbench v. 12.0.3 (Qiagen)
with the Biomedical Genomics Analysis Plugin v. 1.2.1. DT thanks Anja Jørgensen for laboratory assistance.
Author contributions
D.T., A.F.A., D.B., C.P., V.P. and C.B. designed the study. D.T., M.N. and A.A. did the laboratory work. D.T.,
A.F.A. and D.B. carried out the data analysis under the supervision of V.P. and C.B. D.T. wrote the manuscript
and A.F.A., D.B., C.P., N.M., V.P. and C.B. revised it.
Funding
The funding was provided by Consellería de Cultura, Educación e Ordenación Universitaria, Xunta de Galicia
(Modalidade B, ED481B 2018/010).
Competing interests
The authors declare no competing interests.
Additional information
Supplementary Information The online version contains supplementary material available at https://doi.org/
10.1038/s41598-021-99933-2.
Correspondence and requests for materials should be addressed to D.T.
Reprints and permissions information is available at www.nature.com/reprints.
Publisher’s note Springer Nature remains neutral with regard to jurisdictional claims in published maps and
institutional affiliations.
Scientific Reports | (2021) 11:21040 | https://doi.org/10.1038/s41598-021-99933-2 10
Vol:.(1234567890)www.nature.com/scientificreports/
Open Access This article is licensed under a Creative Commons Attribution 4.0 International
License, which permits use, sharing, adaptation, distribution and reproduction in any medium or
format, as long as you give appropriate credit to the original author(s) and the source, provide a link to the
Creative Commons licence, and indicate if changes were made. The images or other third party material in this
article are included in the article’s Creative Commons licence, unless indicated otherwise in a credit line to the
material. If material is not included in the article’s Creative Commons licence and your intended use is not
permitted by statutory regulation or exceeds the permitted use, you will need to obtain permission directly from
the copyright holder. To view a copy of this licence, visit http://creativecommons.org/licenses/by/4.0/.
© The Author(s) 2021
Scientific Reports | (2021) 11:21040 | https://doi.org/10.1038/s41598-021-99933-2 11
Vol.:(0123456789)You can also read