Eutrophication and Hypoxia in Tropical Negombo Lagoon, Sri Lanka
←
→
Page content transcription
If your browser does not render page correctly, please read the page content below
ORIGINAL RESEARCH
                                                                                                                                      published: 06 September 2021
                                                                                                                                    doi: 10.3389/fmars.2021.678832

                                            Eutrophication and Hypoxia in
                                            Tropical Negombo Lagoon, Sri Lanka
                                            Hsueh-Han Hsieh 1 , Ming-Hsiu Chuang 1 , Yung-Yen Shih 1,2 , W. Sanjaya Weerakkody 1,3 ,
                                            Wei-Jen Huang 1 , Chin-Chang Hung 1* , François L. L. Muller 1 , R. R. M. K. P. Ranatunga 4
                                            and D. S. Wijethunga 4
                                            1
                                             Department of Oceanography, National Sun Yat-sen University, Kaohsiung, Taiwan, 2 Department of Applied Science,
                                            Republic of China Naval Academy, Kaohsiung, Taiwan, 3 Department of Fisheries and Aquaculture, Faculty of Fisheries and
                                            Marine Sciences & Technology, University of Ruhuna, Matara, Sri Lanka, 4 Center for Marine Science and Technology,
                                            University of Sri Jayewardenepura, Nugegoda, Sri Lanka

                                            Hypoxic events are becoming frequent in some estuaries and coastal waters due to
                                            over-enrichment of anthropogenic nutrients, organic matter, and/or due to restricted
                                            water circulation. The coastal lagoons and estuaries of Sri Lanka are facing high
                                            population pressure and lacking sufficient infrastructure. Coastal lagoons may receive
                                            high anthropogenic inputs of natural or untreated nitrogen and phosphorus wastes,
                                            and consequently result in hypoxic conditions while sluggish circulation occurred. In
                        Edited by:
               Jesper H. Andersen,          this study, we examined the spatiotemporal variability of eutrophication and hypoxia in
      NIVA Denmark Water Research,          the Negombo Lagoon, one of the most productive and sensitive coastal ecosystems
                          Denmark
                                            in Sri Lanka. Based on seasonal measurements of dissolved oxygen, nutrients,
                       Reviewed by:
                                            chlorophyll-a (Chl-a), particulate and dissolved organic carbon (POC and DOC),
                       Helena Galvão,
    Universidade do Algarve, Portugal       we concluded that eutrophication and hypoxia occurred in both the dry and wet
                 Michelle Jillian Devlin,   seasons. The main contributing factors were high seawater temperature and poor water
     Centre for Environment, Fisheries
   and Aquaculture Science (CEFAS),         circulation in the dry season and high nutrient loading combined with elevated POC and
                      United Kingdom        DOC inputs in the wet season.
                 *Correspondence:
                                            Keywords: hypoxia, eutrophication, organic pollution, nutrients pollution, Negombo Lagoon
                   Chin-Chang Hung
           cchung@mail.nsysu.edu.tw

                   Specialty section:
                                            INTRODUCTION
         This article was submitted to
          Marine Ecosystem Ecology,         Sensitive coastal ecosystems such as wetlands, lagoons, and barrier-built estuaries are threatened by
               a section of the journal     a combination of both marine and/or river discharge factors such as elevated seawater temperature,
          Frontiers in Marine Science       nutrient pollution, organic matter loading, and/or sediment inputs from turbid river waters
          Received: 11 March 2021           (Hoegh-Guldberg and Smith, 1989; Hoegh-Guldberg et al., 2007; Mayfield et al., 2013; Breitburg
        Accepted: 05 August 2021            et al., 2018; Cziesielski et al., 2019). Anthropogenic loading of nitrogen and phosphorus in
     Published: 06 September 2021           particular has led to the proliferation of pelagic and benthic algal species that are not readily
                             Citation:      consumed and thus represent a burden in terms of their eutrophication potential (Andersen et al.,
            Hsieh H-H, Chuang M-H,          2006; Yan et al., 2021). In turn, the microbial respiration and decomposition of this biomass leads
           Shih Y-Y, Weerakkody WS,         to increasing rates of oxygen consumption (Kemp et al., 2005) and oxygen concentrations decrease
  Huang W-J, Hung C-C, Muller FLL,          to less than 2 mg L−1 , the level not suitable for fish, shrimp, or crab (Renaud, 1986). In many of
             Ranatunga RRMKP and
                                            these ecosystems, hypoxia has indeed become a frequent seasonal or persistent feature.
 Wijethunga DS (2021) Eutrophication
    and Hypoxia in Tropical Negombo
                                                Most hypoxic zones in coastal habitats can be directly linked to population growth and
                   Lagoon, Sri Lanka.       increasing industrial and tourism activity which generates industrial and municipal wastes and
           Front. Mar. Sci. 8:678832.       results in increased terrestrial fluxes of nutrients (Diaz and Rosenberg, 1995; Steckbauer et al.,
    doi: 10.3389/fmars.2021.678832          2011). This type of eutrophication is most commonly seen in estuaries, coastal and marginal sea

Frontiers in Marine Science | www.frontiersin.org                                 1                                      September 2021 | Volume 8 | Article 678832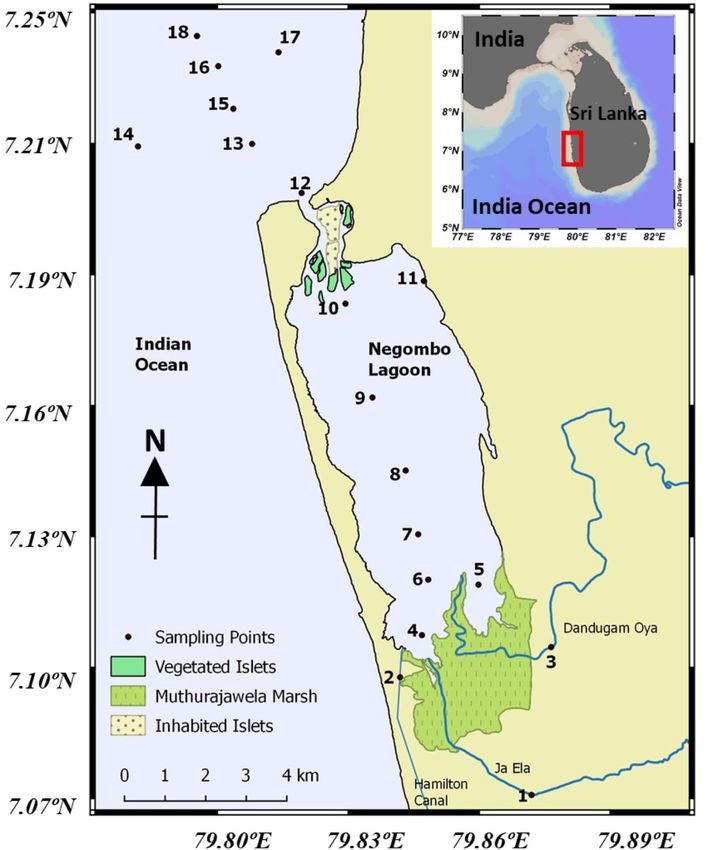
Hsieh et al.                                                                                          Eutrophication, Hypoxia in Negombo Lagoon

areas such as the Changjiang estuary (Wei et al., 2007), the East          Here we report on the results of three seasonal surveys
China Sea (Chen, 2008; Chen and Guo, 2020; Chen et al., 2020,           conducted along the main axis of the lagoon and extending
2021), the Shenzhen Bay (Yan et al., 2021) and the Gulf of Mexico       into the adjacent coastal zone. We examined hydrodynamics,
(Rabalais et al., 2001; Bianchi et al., 2010). In most of these         dissolved oxygen, nutrients, dissolved and particulate organic
regions, anthropogenic eutrophication has results in hypoxia.           carbon across the full salinity mixing gradient between freshwater
    The Negombo Lagoon is a shallow basin estuary running               and seawater in order to investigate the eutrophication and
parallel to the west coast of Sri Lanka. It has an average              hypoxia events in the dry and wet seasons. This study was
water depth of less than 2 m and covers an area of                      focused on studying potential factors currently responsible for
approximately 32 km2 . At its northern end, it connects to              the development of eutrophication and hypoxia in the Negombo
the Indian Ocean through a narrow channel (Figure 1). At                Lagoon and to assess the extent to which long-term, global
its southern end, it is connected to the Muthurajawela marsh            changes may affect the lagoon in the future.
(Samarakoon and Van Zon, 1991; IUCN, 2013). Negombo
Lagoon receives freshwater from Attanagalu Oya as well as
from Ja-Ela. In addition, the Hamilton canal brings freshwater          MATERIALS AND METHODS
from the Kelani River into the lagoon. The total freshwater
discharge ranges from 20 to 225 m3 s−1 , with the Attanagalu            Sampling Site and Hydrographic
Oya contributing over 70% (Rajapaksha, 1997; Amarasinghe                Parameter Analysis
et al., 1999). Negombo receives rainfall from the South-western         Water samples were collected from 18 stations chosen to
monsoon from April to June and September to December                    encompass the full salinity gradient from freshwater to coastal
(>200 mm/month, wet season) and there is little precipitation           seawater. The only exception was Station 11, a private deck
(less than 100 mm/month) during the remaining months (dry               of a waterfront hotel (Figure 1) selected for real-time data
season) (Department of Meteorology, Sri Lanka and Devendra,             recording purposes. Sampling took place in two dry seasons
2002; Figure 2A).                                                       (February 2019 and 2020) and one wet season (October 2019).
    Negombo Lagoon is a part of a larger coastal wetland                Precipitation was major in April to June and September to
along with Muthurajawela marsh. The lagoon and its associated           December, two rain seasons in southwest of Sri Lanka. The
sensitive habitats such as mangrove and sea grass beds provide          higher precipitation was shown in May in first rain season,
an array of ecosystem services also serves as a shrimp and              and shown in October in second wet season. Dry season was
fish nursery and a nutrient source for the coastal waters. The          regarded in inter wet season period, which monthly precipitation
Negombo lagoon has been one of the most productive coastal              was lower than 100 mm day−1 . Sampling was conducted in
ecosystems which support important fishery (DFAR, 2012a).               the morning and repeated in the evening in the wet season.
Negombo has an active fishery industry and it contributes 16%           Salinity, pH, dissolved oxygen, and temperature were measured
for Sri Lanka fish production with 80% of marine fish and 20%           by conductivity meter (WTW Cond 3310, Germany), a pH meter
of lagoon fish (Urban Development Authority, 2019; Figure 2B).          (WTW pH 3110, Germany) and a dissolved oxygen meter (WTW
The Negombo fish market, situated in the lagoon, is a potential         Oxi 3310, Germany). Subsamples were filtered immediately in the
pollution source within the lagoon, but organic wastes from the         shore-based laboratory and stored until analysis. Nitrite (NO2 ),
fish market are discharged directly into the estuary and the data       nitrate (NO3 ), silicate (SiO3 ), phosphate (PO4 ), total suspended
are not measured.                                                       matter (TSM), chlorophyll-a (Chl-a), particulate organic carbon
    The population in Negombo area is continuously increasing           (POC), and dissolved organic carbon (DOC) were determined
from 60,000 in 1950 to 161,484 in 2020 (Figure 2C). The area            according to the methods described in Hung et al. (2000, 2013).
around the Negombo Lagoon attracts nearly 350,000 tourists              The methods used for the determination of nutrients (nitrite,
annually and concentrates 32% of all domestic tourist visits in         nitrate, phosphate, and silicate) were based on the standard
Sri Lanka (Urban Development Authority, 2019; Figure 2D).               dye methods which have been adapted for use with a flow
Food waste and untreated human waste from heavily populated             injection analyzer by Gong et al. (1996). Chl-a concentrations
areas as well as from hotels situated in the Negombo Lagoon             were measured with a Turner Designed 10-AU-005 fluorometer
catchment (Malawaraaratchi, 2003) add up to very significant            using the non-acidification method (Gong et al., 1996; Shih
inputs of nutrients and organic matter which contribute to the          et al., 2019). Concentrations of TSM and POC were measured
overall degradation of water quality.                                   following the methods of Hung et al. (2013) while DOC was
    The presence of these pollutants and the subsequent eutrophic       measured by the method of Hung et al. (2016). The ecological
conditions may result in depletion of dissolved oxygen which            water quality state (European Commission, 2000) was used to
is thought to be responsible for the fish kill events reported          classify the conditions of water in Negombo lagoon. Different
in the lagoon and surrounded waters (Dahanayaka et al.,                 levels of nutrients were corresponded to different state from “very
2012; Narangoda et al., 2015; National Aquatic Resources                good” to “bad,” the threshold of each category was presented
Research and Development Agency, 2019). Dahanayaka et al.               in Table 1.
(2012) reported elevated chlorophyll-a (Chl-a) concentrations
in the dry season as evidence for the above sequence                    Statistical Analysis
of events, but nutrient and dissolved oxygen (DO) data                  A trophic state index (TSI) for brackish water lagoon (Kratzer
were not available.                                                     and Brezonik, 1981) was used in this study to understand the

Frontiers in Marine Science | www.frontiersin.org                   2                                 September 2021 | Volume 8 | Article 678832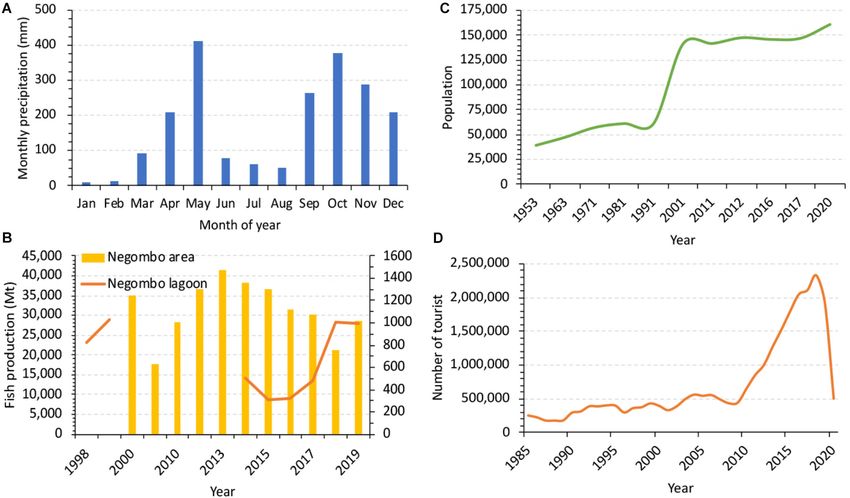
Hsieh et al. Eutrophication, Hypoxia in Negombo Lagoon
FIGURE 1 | Sampling locations in the Negombo Lagoon and the adjacent coastal waters.
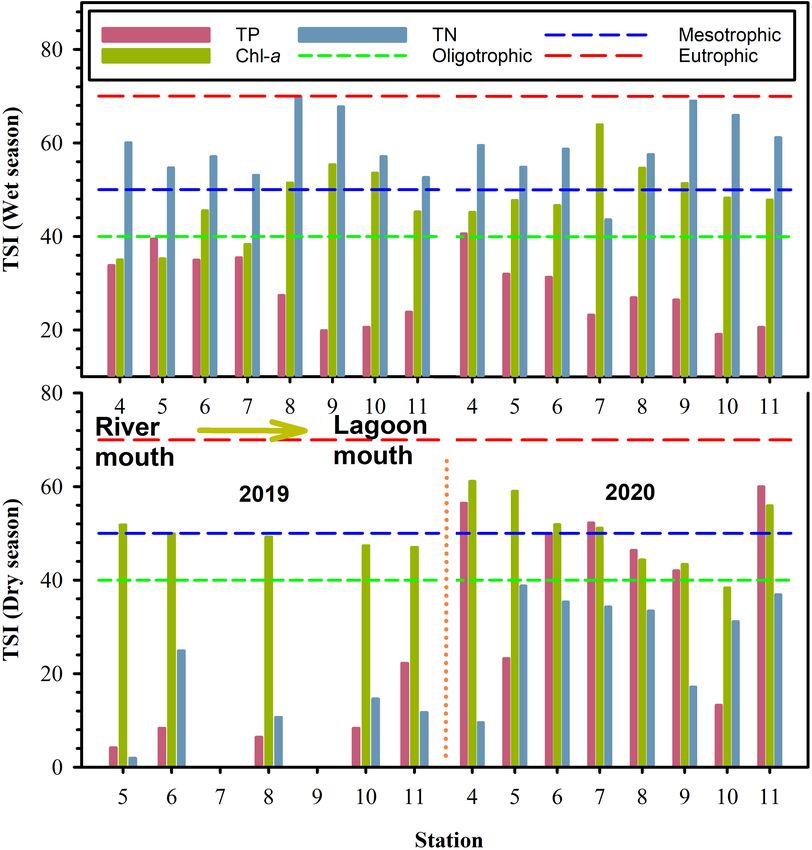
trophic state in Negombo lagoon in dry and wet seasons. TSI of RESULTS
the lagoon water was calculated using TSITP , TSITN , and TSIChl- a .
The equations are described as follows: Hydrographic Settings, DO, DOC, and
TSITP = 14.42 ln(TP) + 4.15 POC in the Dry Season
Sea surface temperatures showed a relatively uniform
TSITN = 14.43 ln(TN) + 54.45 distribution along the entire transect and fell within the
previously reported range of 27.5–31.7◦ C (Malawaraaratchi,
TSIChl = 9.81 ln(Chl) + 30.6 2003). Concentrations of dissolved and particulate chemicals
measured in the surface waters are listed in Table 1 and
The units of TP and Chl-a were in µg L−1 , and TN was in mg their distribution along the salinity gradient is shown
L−1 . According to Kratzer and Brezonik (1981), TSI below 40 in Figure 2. Surface salinity gradually increased from the
represents to oligotrophic state, TSI between 40 and 50 represents southern part (stations 1–3) of the lagoon toward the lagoon
to mesotrophic, TSI from 50 to 70 represents to eutrophic, TSI inlet and the Indian Ocean (station 14) (Table 1) except
above 70 represents to hypereutrophic state of the water. one lower salinity (Sal = 28.5) at station 11 compared
A principal components analysis (PCA) was used for to station 10 (Sal = 30.0) in February 2019, suggesting
identifying the data similarities and differences. For example, an input of fresh water from hotels along the northeast
projections considered the principal components 1 and 2 for lagoon. This depressed salinity at station 11 was associated
hydrographic parameters (temperature, salinity, DO, nutrients, with hypoxia (Figure 2B), even though DO concentrations
Chl-a, DOC, and POC etc.) and sampling locations (located at all other stations were above 4 mg l−1 (Table 2). In
in river, lagoon, and ocean) in dry and wet seasons in February 2020, however, DO values at stations 1–3 fell
the Negombo lagoon. below 3 mg l−1 suggesting that oxygen deficient conditions
Frontiers in Marine Science | www.frontiersin.org 3 September 2021 | Volume 8 | Article 678832
Hsieh et al. Eutrophication, Hypoxia in Negombo Lagoon
FIGURE 2 | Information of (A) monthly precipitation, (B) fish production, (C) population, and (D) tourists in the Negombo lagoon and the adjacent area.
were more widespread in February 2020 than in February phytoplankton growth was evaluated as a P limitation in dry
2019 (Table 2). season in 2019 according to Redfield molar ratio, but it was N
As with DO, pH values were lowest in the southern portion of limitation in dry season in 2020 (Table 1 and Figure 5A).
the lagoon (inner lagoon, stations 1–3) and gradually increased The TSI in Negombo lagoon was decreased from river mouth
to typical oceanic values (8.0–8.2) toward the lagoon inlet to lagoon mouth in both 2019 and 2020 (Figure 6). Overall, water
(Figure 3C), following a typical trend. nature was shown as the mesotrophic state overall in 2019, but the
Concentrations of TSM and chlorophyll-a (Chl-a) were trophic state in some sampling stations turned into the eutrophic
highest at low salinities as well as in freshwater, i.e., inner state in 2020 (Figure 6).
lagoon, Ja-Ela and Dandugam Oya rivers, and decreased
steadily toward the lagoon inlet (Figures 3D,E). The Hydrographic Settings, DO, DOC, and
elevated Chl-a concentrations (0.5–22.4 mg m−3 ) were
comparable to previously reported values in the same lagoon by POC in the Wet Season
Gammanpila (2010). The distributions of surface temperature, DO, pH, TSM, Chl-a,
Concentrations of dissolved inorganic phosphate, silicate and POC, and DOC along the salinity gradient are shown in
nitrogen (=nitrite + nitrate) were elevated throughout the Figures 3A–G which combines data of the two surveys conducted
inner lagoon (Figures 3H–J). Some dissolved nitrogen with in the wet season of 2019. Salinity values at all stations were
high concentration values (13–39 µM) were turn the water to generally lower than those recorded in the dry season due to
“poor” in ecological water quality state, and this occurred in seasonal precipitation. Sea surface temperature was relatively
both 2019 and 2020. uniform and lower than in the dry season. In the first survey, DO
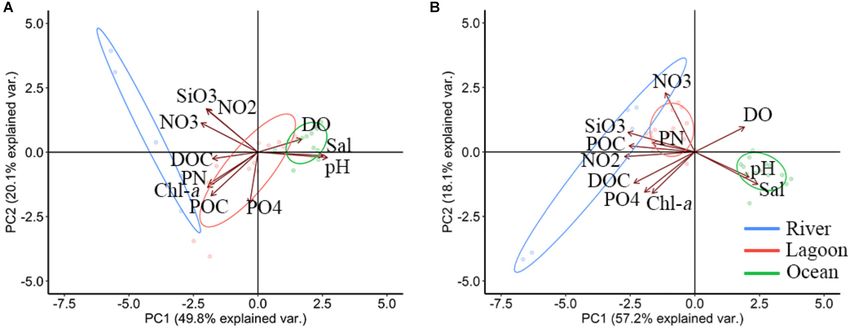
The cumulative explanation of PCA variables in PC1 and
PC2 axis was 69.9% in dry season (Figure 4A). Different
TABLE 1 | Classification of ecological water quality state by concentration
characteristic of water was separated by PC1 and PC2 axis. inorganic nutrients, this table was modified from European Commission (2000).
For example, positive part of PC1 was related to high
salinity, pH and DO in lagoon water. Nutrients and biogenic Water quality state NO2 NO3 PO4 O2
parameters (Chl-a, POC, PN, and DOC) were in negative (µM) (µM) (µM) (%)
part in lagoon water. On PC2 axis, nitrite, nitrate and Very good 3.19 >30
dry season (Figure 5A). Highly biotic activity of phosphate in
Frontiers in Marine Science | www.frontiersin.org 4 September 2021 | Volume 8 | Article 678832
Hsieh et al.                                                                                                              Eutrophication, Hypoxia in Negombo Lagoon

TABLE 2 | Water temperature, salinity, dissolved oxygen (DO), pH, dissolved
nitrogen (NO3+NO2), total suspended matter (TSM) and chlorophyll-a (Chl-a) in
the Negombo Lagoon in the dry season 2019 and 2020.

Station        T   Salinity   DO      pH    DIN     PO4      TSM        Chl-a
           (◦ C)              (µM)          (µM)    (µM)   (mg L−1 )   (mg m−3 )

2019.02.27∼02.28
1          32.0      1.6      143.7   6.9   39.00   0.09     7.80         7.2
3          31.9      4.1      125.3   6.8   22.85   0.11     9.20         8.6
5          32.7     19.2      202.1   7.8   0.57    0.03    13.60         8.7
6          31.9     20.5      206.1   8.0   2.21    0.04     8.60         7.2
8          31.2     23.2      203.0   8.0   0.89    0.04     7.10         6.7
10         30.8     30.0      176.0   8.0   1.09    0.04     6.40         5.5
11         29.6     28.5      27.5    7.3   0.96    0.12     7.70         5.3
12         30.4     31.7      146.5   8.0   3.99    0.22    15.20         4.9
13         29.7     32.6      169.7   8.2   0.85    0.19     1.73         1.3
14         29.6     32.9      185.0   8.2   0.42    0.17     2.00         0.7
15         29.9     32.5      175.1   8.2   1.68    0.18     1.44         1.1
16         29.9     32.4      171.0   8.2   0.32    0.18     1.25         1.3
17         30.4     32.7      175.8   8.2   0.40    0.18     1.70         1.1
18         29.9     32.5      177.1   8.2   0.56    0.19     1.20         1.3
2020.02.05∼02.06
1          30.1      0.2      68.1    7.4   15.03   0.90     8.47         4.3
2          29.6     11.3      91.9    7.2   12.78   1.06    16.70        11.5
3          30.9      3.1      86.3    7.0   27.31   0.54     6.30        14.5
4          30.2     11.5      164.1   7.4   0.74    1.25     9.07        22.4
5          30.3     15.1      169.1   7.5   5.47    0.13     9.09        18.1
6          29.4     15.8      181.9   7.6   4.35    0.79     8.29         8.7
7          28.3     17.3      186.6   7.7   4.04    0.93     8.02         8.1
8          28.1     21.7      174.4   7.8   3.86    0.62     6.36         4.0
9          27.8     23.6      185.3   8.0   1.34    0.46     4.98         3.7
10         28.0     29.1      169.4   8.1   3.25    0.06     5.33         2.2
11         30.5     29.9      121.3   8.0   4.85    1.60    22.10        13.2
12         27.8     31.4      170.0   8.0   2.09    0.21     8.00         3.2
13         28.9     32.9      181.3   8.3   2.77    0.65     2.05         1.7
14         28.7     33.5      205.3   8.2   7.76    0.05     1.68         0.5
15         28.8     33.2      178.8   8.2   1.43    1.24     2.23         1.2
16         29.0     33.5      174.1   8.3   2.29    0.76     2.24         0.6
17         28.8     33.4      173.8   8.2   2.10    1.01     2.68         0.8
18         28.8     33.4      181.9   8.2   3.22    0.67     1.76         1.0

                                                                                        FIGURE 3 | The distribution of (A) surface temperature, (B) DO, (C) pH, (D)
                                                                                        TSM, (E) Chl-a, (F) POC, (G) DOC, (H) PO4, (I) SiO3, and (J) DIN along the
values were above 5 mg l−1 at most stations (Table 3) although                          salinity gradient in dry season.

lower values were recorded in the inner lagoon (0.7–3.8 mg l−1 at
stations 1–4) and also at station 11 (4.8 mg l−1 ). The same pattern
was observed in the second survey, i.e., DO values were generally
above 5 mg l−1 , but four lower values (
Hsieh et al.                                                                                                               Eutrophication, Hypoxia in Negombo Lagoon

  FIGURE 4 | Results from the principal component analysis (PCA) analysis, showing the principal components 1 and 2 for hydrographic parameters and sampling
  locations in dry season (A) and wet season (B) in Negombo lagoon from 2019 to 2020.

  FIGURE 5 | Molar ratio of Si:N:P in Negombo lagoon in dry season (A) and wet season (B). The potentially limited nutrients are divided from Redfield ratio
  (Si:N:P = 16:16:1). Different area in the plot was characterized by potentially limited nutrients in order of priority (Rocha et al., 2002).

the notion that they had been washed off the land by freshwater                        state suggesting that nutrient supply is quite sufficient for marine
runoff, like the nutrients.                                                            organisms in wet season as compared to in dry season.
   The cumulative explanation of variables of PCA in PC1 and
PC2 axis in wet season was 75.3% (Figure 4B). PC1 and PC2
axes were similar to those at dry season. However, the POC and                         DISCUSSION
PN were shown in positive part of PC2, and they (POC and PN)
were not related to observed Chl-a suggesting there was external                       Nutrient Dynamics the Negombo Lagoon
source of particulate matters.                                                         We observed a negative relationship between dissolved nitrogen
   The molar ratio (Si:N:P) in different waters in wet season was                      and salinity (Figures 3J, 7J) during both the dry and wet
presented in Figure 5B. Similar to in dry season, phosphate in                         seasons, which suggests that the sources of nitrogen were
both PCA result and Si:N:P plot was evaluated as a P limitation                        mainly from freshwater sources. This is consistent with previous
in wet season. One can easily see elevated N:P ratios in wet                           work (Malawaraaratchi, 2003) indicating that Negombo Lagoon
season (Figure 5B).                                                                    receives large quantities of wastewater containing high levels
   The TSI in Negombo lagoon in wet season was between                                 of nutrients and organic matter originating from its heavily
mesotrophic and eutrophic conditions (Figure 6) and the trophic                        populated catchment. At the same time, Negombo is rated as

Frontiers in Marine Science | www.frontiersin.org                                  6                                        September 2021 | Volume 8 | Article 678832
Hsieh et al.                                                                                                           Eutrophication, Hypoxia in Negombo Lagoon

  FIGURE 6 | Trophic state index from TP, TN, and Chl-a in dry season and wet season in Negombo lagoon. Short dash line represents oligotrophic, medium dash line
  represents transition from oligotrophic to mesotrophic, long dash line represents transition from mesotrophic to eutrophic.

the third most popular tourist destination in Sri Lanka due to                      Some of the pollutions are from these FRP boats and pollutants
its gorgeous lagoon, bountiful fishery resources and attractive                     are directly released to the estuary or the lagoon. In addition,
coastal scenery. Nearly 32% of tourists from Sri Lanka visit the                    waste water discharge from the small scale shrimp farms, crab
Negombo lagoon every year. Most of the hotels are located along                     fattening in estuary and the waste from the dry fish production
the shore and the lagoon. Hotels may become point source if                         have estimated negative effect to the lagoon water quality
wastewater is discharged to the lagoon without advance treatment                    (Pahalawattaarachchi and Siriwardena, 2003; Pathmi et al., 2003).
systems. This is a matter of great concern, not least because there                     A negative relationship between phosphate and salinity was
is growing evidence (Halkos and Matsiori, 2018; Schuhmann                           also observed within the lagoon (Figures 3H, 7H). However,
et al., 2019) that water quality is the single most important factor                phosphorus as a strong bioactive element, it usually depleted in
contributing to the decision of tourists to revisit a particular                    the water. A remarkable difference of N:P ratio altered nitrogen
seaside location.                                                                   become limited factor in dry season in 2020 (Figure 5B). High
    Furthermore, it has been reported that unproper management                      concentration of phosphate shown in Negombo lagoon in dry
planning, fecal pollution and solid waste pollution may be                          season in 2020, might result from remineralization of sediment
important problems in Negombo lagoon due to direct discharge                        or discharge of anthropogenic wastewater from coastal of lagoon.
of sewage, solid waste into water (Panagoda et al., 2016).                          Besides, some elevated phosphate values were also found at high
Joseph (2011) estimated that nearly 250 kg/day of raw faces                         salinity stations revealing other sources of phosphate input, but it
are released to the lagoon through channel segment and neatly                       is difficult to trace their sources based on limited information.
50 % uncollected solid waste are discharge to the surrounding                           It is worth noting that the main freshwater sources, i.e.,
environment illegally (Karunarathana et al., 2019). Therefore,                      the Dandugam Oya and Ja-Ela, brought enormous amounts of
the water quality of Negombo Lagoon is critical for the coastal                     dissolved silicate and TSM to the lagoon in both seasons, while
communities and lagoon ecosystem.                                                   the Hamilton canal also brought large amounts of silicate in
    Moreover, brackish water fishery is one of the major activity                   wet season only.
in the Negombo lagoon by using engine FRP boats which are                               Nutrient supply to coastal lagoon habitats tends to play an
anchored along the estuary bank (Joseph, 2011; DFAR, 2012b).                        important role in their primary production which in turn plays an

Frontiers in Marine Science | www.frontiersin.org                               7                                      September 2021 | Volume 8 | Article 678832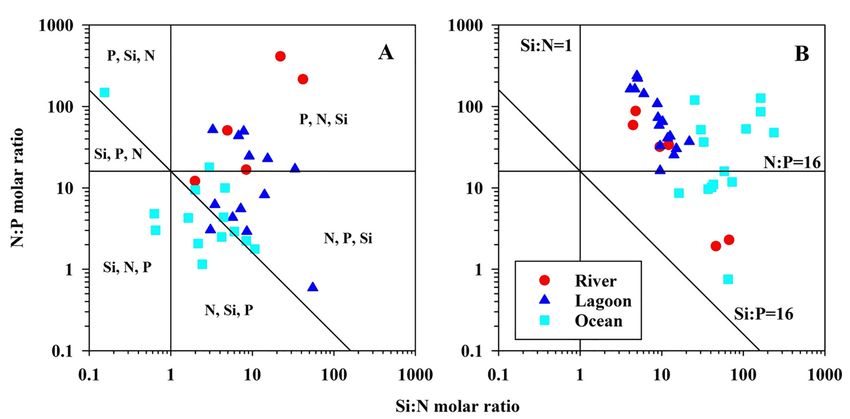
Hsieh et al.                                                                                                         Eutrophication, Hypoxia in Negombo Lagoon

TABLE 3 | Water temperature, salinity, dissolved oxygen (DO), pH, dissolved            Eutrophication in the Negombo Lagoon
nitrogen (NO3+NO2), total suspended matter (TSM) and chlorophyll-a (Chl-a) in
the Negombo Lagoon in the wet season 2019.
                                                                                       According to the European Commission (2000), nitrate
                                                                                       concentrations in excess of 24.2 µM indicate bad quality water.
Station        T   Salinity   DO      pH    DIN     PO4      TSM        Chl-a          Based on these criteria, the water quality status of the lagoon
           (◦ C)              (µM)          (µM)    (µM)   (mg L−1 )   (mg m−3 )       was “poor” in the wet season but switched to “good” in the dry
2019.10.15∼10.17
                                                                                       season when concentrations were less than 8 µM. With respect
(First Cruise)
                                                                                       to phosphorus concentrations, the status of lagoon waters was
1          29.0      0.0      118.8   6.4   22.96   0.26    27.87         1.5
                                                                                       consistently “good” to “medium,” with concentrations less than
2          29.1      1.1      21.4    7.7   3.73    1.95     8.20        34.6
                                                                                       1 µM. These findings are in agreement with those of Mendis
3          29.1      0.0      103.8   6.3   11.45   0.34    19.40         4.3
                                                                                       et al. (2015). Only in the Hamilton canal could the phosphorus
4          28.8      0.0      109.1   7.6   14.09   0.87    16.87         1.6
                                                                                       quality status be rated as “bad,” with concentrations consistently
5          29.0      0.0      132.2   7.9   9.81    0.39    21.80         1.6
                                                                                       higher than 1.7 µM.
6          28.5      0.6      157.6   7.8   11.51   0.28    18.00         4.6
                                                                                          In this study, Chl-a concentrations were persistently higher
7          28.6      0.7      160.0   7.2   8.84    0.29    18.47         2.2
                                                                                       than 2 µg L−1 throughout the entire lagoon and Chl-a was
8          29.2      1.9      189.2   7.2   27.37   0.17    11.87         8.4
                                                                                       always slightly higher in the dry season than that in the wet
9          29.4      4.2      202.7   7.5   23.62   0.10    10.73        12.5
                                                                                       season (Figures 3E, 7E). These observations are likely the
10         29.8     12.7      176.1   7.6   11.30   0.10     4.70        10.4
                                                                                       result of plankton blooms fueled by the abundance of nutrients
11         31.5     10.4      149.0   7.4   8.54    0.13     4.27         4.4          coming from freshwater inputs. Negombo lagoon was between
12         30.5     32.0      163.1   7.9   1.26    0.15     8.80         4.7          mesotrophic and eutrophic status in both dry and wet seasons
13         30.1     19.6      197.3   8.7   7.51    0.06     4.42         6.0          based on the trophic index (Figure 7). In comparison our result
14         29.4     29.9      195.2   8.5   0.58    0.06     1.78         1.7          to previous investigations, we observed that water quality in
15         30.3     25.2      189.8   9.1   3.25    0.06     2.60         3.8          Negombo lagoon has been declined since 2009 (Table 4). We
16         30.1     25.8      185.1   9.4   9.27    0.07     2.06         3.5          cannot give a real answer what mechanisms result in mesotrophic
17         30.0     24.8      162.9   9.0   4.23    0.09     3.53         3.8          and eutrophic status in Negombo lagoon because previous
18         28.8     24.2      179.6   8.7   3.59    0.07     5.00         2.5          sampling locations and time period might be different from
(Second Cruise)                                                                        this study. However, water quality in the wet season is more
1          29.3      0.0      140.9   6.3   22.21   0.38    18.33         3.2          worsen than dry season based on current study. The observations
2          31.4      1.2      107.4   6.7   2.27    0.99     4.00        75.5          may be affected by temporal-spatial variation in wet season.
3          29.1      0.0      98.4    6.4   14.01   0.44    16.13         1.3          It is likely that flood water, storm water runoff and effluent
4          30.6      0.1      128.7   6.5   13.66   0.42    10.60         4.4          discharge into the inner lagoon provided additional sources
5          31.7      0.7      175.9   6.6   9.91    0.23    18.33         5.7          of biologically available nutrients and organic matter from
6          32.4      1.1      164.6   7.1   12.84   0.22    10.73         5.1          watershed of main rivers. However, it needs further investigations
7          32.6      4.5      221.3   7.9   4.65    0.13    15.53        29.9          to trace their sources of nutrients and organic matter at different
8          32.6      3.7      229.7   7.9   11.84   0.16    17.07        11.6          time scales in the future.
9          32.8      3.7      240.4   8.2   25.64   0.16    14.40         8.3
10         33.1      4.4      227.3   7.7   20.83   0.09     6.47         6.1
                                                                                       Hypoxia and pH Variation in the
11         32.3      6.3      197.1   7.5   14.92   0.10    26.20         5.8
12         30.8     33.5      170.2   8.2   0.72    0.95     2.20         6.2
                                                                                       Negombo Lagoon
13         29.8     21.5      196.9   8.7   3.06    0.08     3.17         6.1
                                                                                       The metabolic activity of all aquatic organisms increases
14         29.5     31.3      203.2   7.3   0.69    0.06     1.43         3.1          exponentially with temperature. The main consequence of these
15         29.9     25.5      192.9   8.8   1.01    0.06     2.79         3.9          elevated rates of physiological processes in the context of water
16         30.0     31.8      203.3   9.1   0.45    0.05     1.53         1.4          quality is the consumption of oxygen by aerobic heterotrophs,
17         30.1     31.8      198.1   9.2   0.49    0.04     1.33         1.5          mainly bacteria (Sokolova and Lannig, 2008). Another effect of
18         29.0     21.1      202.8   9.2   10.82   0.13     5.40         1.4          increasing temperature is the decreasing solubility of oxygen
                                                                                       in seawater (Garcia and Gordon, 1992). Higher sea surface
                                                                                       temperatures also lead to density stratification which may
                                                                                       severely reduce vertical mixing and hence prevent the transport
indirect role in providing a variety of habitats such as feeding and                   of oxygen into the subsurface layer (Howarth et al., 2011). In
nursery ground for juvenile marine organisms (Vasconcelos et al.,                      the present study, surface water temperatures were in the range
2011). However, tropical lagoon worldwide has been damaged                             27.8–33.1◦ C, with a mean value of 30.1 ± 1.0, i.e., similar to
by human activity such as shoreline modifications and coastal                          previously reported results for this lagoon (Gammanpila, 2010).
works for tourists (Pérez-Ruzafa et al., 2019), sea salt extraction                    Such high temperatures, coupled with the slow water circulation
(Pérez-Ruzafa et al., 2011), fisheries and aquaculture, water sports                   resulting from the very narrow connection to the Indian Ocean
etc. All of these factors affect nutrient and organic matter inputs                    (Dahanayaka et al., 2012), mean that the Negombo Lagoon is at
as well as sediment resuspension in such a way as to shift                             risk of experiencing hypoxic events (Hearn and Robson, 2001;
the ecosystems and the lagoon waters toward eutrophication                             Tyler et al., 2009). Moreover, the mean DO concentration we
(Pérez-Ruzafa et al., 2019).                                                           recorded in the Dandugam Oya river outflow (2.76 mg l−1 ) was

Frontiers in Marine Science | www.frontiersin.org                                  8                                 September 2021 | Volume 8 | Article 678832
Hsieh et al. Eutrophication, Hypoxia in Negombo Lagoon
been experiencing hypoxia in the waters immediately above the
sediments on a daily or seasonal basis. Besides, the fish would
avoid low DO water in usual (Claireaux and Chabot, 2016),
however, shallow water restrict movement of fish in Negombo
lagoon result in fish kill events.
High level of nutrients discharged into Negombo lagoon can
trigger microorganism growth in both dry and wet seasons.
During dry season, phytoplankton in Negombo lagoon produce
large amounts of particulate organic carbon and consumed
nutrients and oxygen in the water column. Oxygen depletion
(Hsieh et al. Eutrophication, Hypoxia in Negombo Lagoon
FIGURE 8 | The concentration of POC and DOC vs. DO in (A,B) dry season and (C,D) wet season.
as a contributing factor, especially in view of the documented across the inlet is likely to be more pronounced during spring
evidence for unregulated and untreated waste discharge along tides than during neap tides.
the shore of the lagoon. The main sources of septic wastewater In recent years, mangroves have been planted around
effluent to the Negombo lagoon are local settlements, municipal the lagoon by local residents for the purpose of subsequent
sewage carried with the freshwater inflows and tourist industry landfill. The area of mangrove vegetation in some areas has
along its coastal area (Malawaraaratchi, 2003). Finally, the illegal increased to form new islets consequently narrowing the
dumping of solid wastes along the banks of the populated area channels (Dahanayaka et al., 2012). This has also led to
and shoreline closer to the mouth (Malawaraaratchi, 2003) as well sediment deposition, further enhance choking the channels.
as waste from fish processing and fish landing sites may also be a If left unchecked, it will ultimately lead to the destruction
contributing factor (DFAR, 2012a). of the Negombo estuarine lagoon as a productive ecosystem
(IUCN, 2011). Besides encouraging sedimentation and restricting
water exchange, mangrove forests can naturally lead to bottom
Driving Forces of Eutrophication in the water hypoxia during low tide (Dubuc et al., 2019). The
Negombo Lagoon major cause of hypoxia in mangrove swamps is the buildup of
Water exchange between the Negombo Lagoon and the Indian monosulfides and pyrites in the organic-rich sediment, creating
Ocean occurs through a channel which is 150 m wide and less a monosulfidic black ooze (Knight et al., 2013). Therefore, this
than 2 m deep on average. The mean tidal range on the ocean may be another possible cause for very low DO concentrations
side of the inlet is 30 cm and that inside the lagoon is only 10 cm. in the Negombo lagoon, as it comprises several mangrove
This decrease across the inlet is due to tidal choking (Rydberg and swamps and borders on the largest saline coastal salt marsh
Wickbom, 1996; Rajapaksha and Jayasiri, 2000; Sivanantha et al., in Sri Lanka, called Muthurajawela, which is underlain by
2016). The extent to which choking occurs depends on the inlet extensive peat deposits.
structure, freshwater supply, size of the basin, and spring neap Dissolved oxygen recorded continuously for 24 h at station 11
tidal ranges. For example, work conducted in another west coast (from the outdoor deck of a waterfront hotel) revealed that severe
lagoon (Wijeratne and Rydberg, 2007) suggests that tidal choking hypoxic episodes occurred at nighttime during the dry season
Frontiers in Marine Science | www.frontiersin.org 10 September 2021 | Volume 8 | Article 678832Hsieh et al. Eutrophication, Hypoxia in Negombo Lagoon
(personal communication, W-JH). This may be due to the poor and water circulation. Going forward, regular hydrographic,
circulation of water in that part of the lagoon, coupled with the biological oxygen demand, heterotrophic respiration, nutrient
long residence time of water in the central part of the lagoon monitoring and phytoplankton assemblages will be essential for
in the dry season. In contrast, during the wet season, nighttime eutrophication and hypoxia trend analysis. If any modification to
DO concentrations did not fall drastically as water replenished at the lagoon’s outline and physiography is to take place, it will be
much higher rates in the lagoon due to shorter residence time. important to characterize the new estuarine mixing behavior of
Rajapaksha and Jayasiri (2000) calculated a mean residence time the lagoon as a function of river discharge variability in order to
for the lagoon as a whole which ranged from 2 to 10 days, the correctly interpret the monitoring data.
shortest time corresponding to the highest recorded river flow
(160 m3 s−1 ) and the longest time to the dry season (20 m3 s−1 ).
Based on the above considerations and a case study from another DATA AVAILABILITY STATEMENT
tropical estuarine lagoon (Hearn and Robson, 2001), it can be
anticipated that dredging the main channel of the Negombo The original contributions presented in the study are included
Lagoon inlet, or a new channel, will a good option to increase in the article/Supplementary Material, further inquiries can be
ocean exchange and improve water quality in the lagoon. directed to the corresponding author/s.
High nutrient loading into the lagoon is a problem that
also needs to be addressed. The anthropogenic sources are well
identified and are associated with a range of intense activities AUTHOR CONTRIBUTIONS
around the lagoon such as local population, tourism, fishery
activities, discharge of poorly treated water, pollution from both C-CH conceived the idea. C-CH, H-HH, and WW wrote
point sources and non-point sources. We provided investigations the manuscript. H-HH, M-HC, Y-YS, WW, W-JH, C-CH,
in both dry and wet seasons, but it indeed provides valuable RR, and DW performed the experiments and created the
data sets about eutrophication and hypoxia formation. It is figures. C-CH and H-HH revised the manuscript. All authors
worthy to note that such a short term study on this unique reviewed the manuscript.
system may not be adequate to describe its whole scenario of
Negombo lagoon and may still miss some considerations. For
example, Sivanantha et al. (2016) reported that most of the water
FUNDING
discharge to the lagoon does not go through a proper purification This research was supported by Sun Yat-sen University and the
system to reduce nutrient pollution. This high nutrient loading Ministry of Sciences and Technology (MOST 107-2911-I-110-
has contributed to a 96% decline of the standing crop of the 301, MOST 108-2911-I-110-301, and MOST 109-2911-I-110-
seagrass in northern, eastern, and western parts of the Negombo 301) of Taiwan.
Lagoon between 1997 and 2004 (De Silva and Amarasinghe,
2007). In turn, the reduction of the seagrass may also contribute
to the present-day low dissolved oxygen concentrations in certain ACKNOWLEDGMENTS
parts of the lagoon.
In summary, elevated levels of nutrients, Chl-a, POC, and We appreciate the assistance of people of the Environmental
DOC were found in the water bodies emptying into the Negombo Change Sciences and Technology Innovation Center at
lagoon as well as in the inner lagoon, in both dry and wet University of Sri Jayewardenepura in collaboration with National
seasons. The inner lagoon and probably some stretches of coast Sun Yat-sen University.
isolated from the main circulation (e.g., Station 11) is facing
hypoxia, not only because of the in situ processes triggered by
the abundance of nutrients and organic matter from sewage, SUPPLEMENTARY MATERIAL
but also because of the already low levels of dissolved oxygen
in river discharge. Therefore, it would be good to significantly The Supplementary Material for this article can be found
reduce nutrient loading while at the same time improving online at: https://www.frontiersin.org/articles/10.3389/fmars.
the existing mouth or new channel to improve water quality 2021.678832/full#supplementary-material
REFERENCES Bianchi, T. S., DiMarco, S. F., Cowan, J. H. Jr., Hetland, R. D., Chapman, P., Day,
J. W., et al. (2010). The science of hypoxia in the Northern Gulf of Mexico: a
Amarasinghe, U. A., Mutuwatta, L., and Sakthivadivel, R. (1999). Water Scarcity review. Sci. Total Environ. 408, 1471–1484. doi: 10.1016/j.scitotenv.2009.11.047
Variations within a Country: A Case Study of Sri Lanka. IWMI Research Reports Breitburg, D., Levin, L. A., Oschlies, A., Gregoire, M., Chavez, F. P., Conley, D. J.,
H024897. Colombo: International Water Management Institute. et al. (2018). Declining oxygen in the global ocean and coastal waters. Science
Andersen, J. H., Schlüter, L., and Ærtebjerg, G. (2006). Coastal eutrophication: 359:eaam7240. doi: 10.1126/science.aam7240
recent developments in definitions and implications for monitoring Chen, C.-C., Gong, G.-C., Chiang, K.-P., Shiah, F.-K., Chung, C.-C., and Hung,
strategies. J. Plankton Res. 28, 621–628. doi: 10.1093/plankt/fb C.-C. (2021). Scaling effects of a eutrophic river plume on organic carbon
l001 consumption. Limnol. Oceanogr. 66, 1867–1881. doi: 10.1002/Ino.11729
Frontiers in Marine Science | www.frontiersin.org 11 September 2021 | Volume 8 | Article 678832Hsieh et al. Eutrophication, Hypoxia in Negombo Lagoon Chen, C.-C., Gong, G.-C., Chou, W.-C., and Shiah, F.-K. (2020). Hypoxia in Hoegh-Guldberg, O., and Smith, G. J. (1989). The effect of sudden changes autumn of the East China Sea. Mar. Pollut. Bull. 152:110875. doi: 10.1016/j. in temperature, light and salinity on the population density and export of marpolbul.2019.110875 zooxanthellae from the reef corals Stylophora pistillata Esper and Seriatopora Chen, C.-C., Gong, G.-C., and Shiah, F.-K. (2007). Hypoxia in the East China Sea: hystrix Dana. J. Exp. Mar. Biol. Ecol. 129, 279–303. doi: 10.1016/0022-0981(89) one of the largest coastal low-oxygen areas in the world. Mar. Environ. Res. 64, 90109-3 399–408. doi: 10.1016/j.marenvres.2007.01.007 Howarth, R., Chan, F., Conley, D. J., Garnier, J., Doney, S. C., Marino, R., Chen, C.-T. A. (2008). Distributions of nutrients in the East China Sea and the et al. (2011). Coupled biogeochemical cycles: eutrophication and hypoxia in South China Sea connection. J. Oceanogr. 64, 737–751. doi: 10.1007/s10872- temperate estuaries and coastal marine ecosystems. Front. Ecol. Environ. 9, 008-0062-9 18–26. doi: 10.1890/100008 Chen, C.-T. A., and Guo, X. (2020). Changing Asia-Pacific Marginal Seas. Hung, C. C., Tseng, C. W., Gong, G. C., Chen, K. S., Chen, M. H., and Hsu, S. C. Singapore: Springer. (2013). Fluxes of particulate organic carbon in the East China Sea in summer. Chou, W.-C., Chu, H.-C., Chen, Y.-H., Syu, R.-W., Hung, C.-C., and Soong, Biogeosciences 10, 6469–6484. doi: 10.5194/bg-10-6469-2013 K. (2018). Short-term variability of carbon chemistry in two contrasting Hung, C. C., Wong, G. T., Liu, K. K., Fuh-Kwo, S., and Gwo-Ching, G. (2000). The seagrass meadows at Dongsha Island: implications for pH buffering and CO2 effects of light and nitrate levels on the relationship between nitrate reductase sequestration. Estuar. Coast. Shelf Sci. 210, 36–44. doi: 10.1016/j.ecss.2018. activity and 15NO3− uptake: field observations in the East China Sea. Limnol. 06.006 Oceanogr. 45, 836–848. doi: 10.4319/lo.2000.45.4.0836 Claireaux, G., and Chabot, D. (2016). Responses by fishes to environmental Hung, C. W., Huang, K. H., Shih, Y. Y., Lin, Y. S., Chen, H. H., Wang, C. C., et al. hypoxia: integration through Fry’s concept of aerobic metabolic scope. J. Fish (2016). Benthic fluxes of dissolved organic carbon from gas hydrate sediments Biol. 88, 232–251. doi: 10.1111/jfb.12833 in the northern South China Sea. Sci. Rep. 6:29597. doi: 10.1038/srep29597 Cziesielski, M. J., Schmidt-Roach, S., and Aranda, M. (2019). The past, present, and IUCN (2011). An Appraisal of Mangrove Management in Micro tidal Estuaries and future of coral heat stress studies. Ecol. Evol. 9, 10055–10066. doi: 10.1002/ece3. Lagoons in Sri Lanka, Vol. viii. Colombo: IUCN Sri Lanka Office, 116. 5576 IUCN (2013). Proceedings of the Workshop on Ecological Considerations in Coastal Dahanayaka, D., Tonooka, H., Wijeyaratne, M., Minato, A., and Ozawa, S. (2012). Development, Held at the Sequel, Cinnamon Grand, Colombo, Sri lanka, 22 Monitoring land use changes and their impacts on the productivity of Negombo November 2013. Colombo: IUCN, xiv–80. Estuary, Sri Lanka using time series satellite data. Asian Fish. Sci. 25, 97–112. Joseph, L. (2011). Fisheries and Environmental profile of Negombo lagoon, De Silva, K., and Amarasinghe, M. (2007). Substrate characteristics and species Sri Lanka: A Literature Review. Regional Fisheries Livelihoods Programme diversity of marine angiosperms in a micro tidal basin estuary on the west coast for South and Southeast Asia (GCP/RAS/237/SPA) Field Project Document of Sri Lanka. Sri Lanka J. Aquat. Sci. 12, 103–114. doi: 10.4038/sljas.v12i0.2217 2011/LKA/CM/04. Rome: FAO. Devendra, A. (2002). Hydrodynamics of Muthurajawela Marsh & Negombo lagoon Karunarathana, A., Singh, R. K., Rajapaksha, T., Gamaralalage, D., Premakumara, coastal wetland ecosystem. Effective Management for Biodiversity Conservation J., Onogawa, K., et al. (2019). State of Municipal Solid Waste Management in in Sri Lankan Coastal Wetlands. Portsmouth: University of Portsmouth, 9–10. Negombo, Sri Lanka. Hayama: Institute for Global Environmental Strategies. DFAR (2012a). Fisheries Development and Management Plan of Negombo lagoon. Kemp, W. M., Boynton, W. R., Adolf, J. E., Boesch, D. F., Boicourt, W. C., Brush, G., Regional Fisheries Livelihoods Programme for South and Southeast Asia et al. (2005). Eutrophication of Chesapeake Bay: historical trends and ecological (GCP/RAS/237/SPA): Field Project Document 2012/LKA/CM/12. Colombo: interactions. Mar. Ecol. Prog. Ser. 303, 1–29. doi: 10.3354/meps303001 Department of Fisheries and Aquatic Resources. Knight, J. M., Griffin, L., Dale, P. E. R., and Sheaves, M. (2013). Short-term DFAR (2012b). Rapid Fisheries Frame Survey Report of Coastal and Brackish Water dissolved oxygen patterns in sub-tropical mangroves. Estuar. Coast. Shelf Sci. Fisheries in the Fisheries District of Negombo. Regional Fisheries Livelihoods 131, 290–296. doi: 10.1016/j.ecss.2013.06.024 Programme for South and Southeast Asia (GCP/RAS/237/SPA): Field Project Kratzer, C. R., and Brezonik, P. L. (1981). A carlson-type trophic state index for Document 2012/LKA/CM/01. Colombo: Department of Fisheries and Aquatic nitrogen in florida lakes. Water Resour. Bull. 17, 713–715. doi: 10.1111/j.1752- Resources. 1688.1981.tb01282.x Diaz, R. J., and Rosenberg, R. (1995). Marine benthic hypoxia: a review of Malawaraaratchi, R. (2003). A Study of the Negombo Lagoon with Respect to the its ecological effects and the behavioural responses of benthic macrofauna. Salinity Variation and Pollution of the Lagoon Water and Effects of Proposed Oceanogr. Mar. Biol. 33, 245–303. Dredging Activities. Moratuwa: University of Moratuwa. Dubuc, A., Baker, R., Marchand, C., Waltham, N. J., and Sheaves, M. (2019). Mayfield, A. B., Chen, M. N., Meng, P. J., Lin, H. J., Chen, C. S., and Liu, P. J. Hypoxia in mangroves: occurrence and impact on valuable tropical fish habitat. (2013). The physiological response of the reef coral Pocillopora damicornis Biogeosciences 16, 3959–3976. doi: 10.5194/bg-16-3959-2019 to elevated temperature: results from coral reef mesocosm experiments in European Commission (2000). Water framework directive, directive 2000/60/EEC Southern Taiwan. Mar. Environ. Res. 86, 1–11. doi: 10.1016/j.marenvres.2013. of 22 December 2000 establishing a framework for community action in the 01.004 field of water policy. Off. J. Eur. Communities 327, 1–72. Mendis, B., Najim, M., Kithsiri, H., and Azmy, S. (2015). “Assessment of water Gammanpila, M. (2010). Hydrography, nutrients and abundance and distribution quality and identification of pollution status of Negombo estuary in Sri Lanka,” of zooplankton in Negombo Lagoon, Sri Lanka. Sri Lanka J. Aquat. Sci. 15, in Proceedings of the 21st Scientific Sessions of the Sri Lanka Association for 13–24. doi: 10.4038/sljas.v15i0.5447 Fisheries and Aquatic Resources, May, 2015. Sri Lanka Association for Fisheries Garcia, H. E., and Gordon, L. I. (1992). Oxygen solubility in seawater: better fitting and Aquatic Resources, Colombo. equations. Limnol. Oceanogr. 37, 1307–1312. doi: 10.4319/lo.1992.37.6.1307 Narangoda, S. R. C., Maddumage, M. D. S. R., Wickramaarachchi, D. N., Gong, G.-C., Lee Chen, Y.-L., and Liu, K.-K. (1996). Chemical hydrography and Weerasekara, K. A. W. S., Hettige, N. D., et al. (2015). “Water quality status chlorophyll a distribution in the East China Sea in summer: implications in of selected aquatic environments in Sri Lanka during fish kill incidents,” in nutrient dynamics. Cont. Shelf Res. 16, 1561–1590. doi: 10.1016/0278-4343(96) Proceedings of 21st Annual Scientific Sessions of Sri Lanka Association for 00005-2 Fisheries and Aquatic Resources (SLAFAR), 22 May 2015, Nara, 17. Halkos, G., and Matsiori, S. (2018). Environmental attitudes and preferences for National Aquatic Resources Research and Development Agency (2019). coastal zone improvements. Econ. Anal. Policy 58, 153–166. doi: 10.1016/j.eap. Preliminary Report on Investigation of Fish in Hamilton Canal. Nara: National 2017.10.002 Aquatic Resources Research and Development Agency. Hearn, C. J., and Robson, B. J. (2001). Inter-annual variability of bottom hypoxia Pahalawattaarachchi, V., and Siriwardena, P. (2003). “Effect of shrimp farm effluent in shallow mediterranean estuaries. Estuar. Coast. Shelf Sci. 52, 643–657. doi: on seagrass beds in Negombo Lagoon,” in Proceeding of the 1st Scientific Sessions 10.1006/ecss.2001.0773 on Inland Aquatic Resources and Aquaculture, National Aquatic Resources Hoegh-Guldberg, O., Mumby, P. J., Hooten, A. J., Steneck, R. S., Greenfield, P., Research and Development Agency, (Colombo). Gomez, E., et al. (2007). Coral reefs under rapid climate change and ocean Panagoda, P. A. B. G., Dissanayake, D. M. S. N., Nawalage, N. M. S. K., Silva, acidification. Science 318, 1737–1742. doi: 10.1126/science.1152509 H. K. A. D., Tharaka, L. K. D. N., Weerasinghe, H. W. G. A. S., et al. (2016). Frontiers in Marine Science | www.frontiersin.org 12 September 2021 | Volume 8 | Article 678832
Hsieh et al.                                                                                                                        Eutrophication, Hypoxia in Negombo Lagoon

   “Sustainable tourism development in Negombo coastline: an option for co-                   Sivanantha, N., Wijesinghe, M., and Wijesekara, R. (2016). Distribution of five
   management,” in Proceedings of the International Research Symposium on Pure                   toxic heavy metals in biotic and abiotic constituents of the Negombo Lagoon,
   and Applied Sciences (IRSPAS 2016), Faculty of Science, University of Kelaniya,               Sri Lanka. Sri Lankan J. Biol. 1, 1–14. doi: 10.4038/sljb.v1i1.1
   Kelaniya, 106.                                                                             Sokolova, I. M., and Lannig, G. (2008). Interactive effects of metal pollution
Pathmi, A., Jayamanne, S., Siriwardena, P., and Hirimuthugoda, Y. (2003). “Impact                and temperature on metabolism in aquatic ectotherms: implications of global
   of crab fattening on the lagoon environment and the live hood of fishers                      climate change. Clim. Res. 37, 181–201. doi: 10.3354/cr00764
   in Negombo Lagoon,” in Proceeding of the 1st scientific sessions on Inland                 Steckbauer, A., Duarte, C. M., Carstensen, J., Vaquer-Sunyer, R., and Conley, D. J.
   Aquatic Resources and Aquaculture, National Aquatic Resources Research and                    (2011). Ecosystem impacts of hypoxia: thresholds of hypoxia and pathways to
   Development Agency, Colombo.                                                                  recovery. Environ. Res. Lett. 6:025003. doi: 10.1088/1748-9326/6/2/025003
Pérez-Ruzafa, A., Campillo, S., Fernández-Palacios, J. M., García-Lacunza, A.,                Tyler, R. M., Brady, D. C., and Targett, T. E. (2009). Temporal and spatial dynamics
   García-Oliva, M., Ibañez, H., et al. (2019). Long-term dynamic in nutrients,                  of biel-cycling hypoxia in estuarine tributaries. Estuar. Coast 32, 123–145. doi:
   chlorophyll a, and water quality parameters in a coastal Lagoon during a process              10.1007/s12237-008-9108-x
   of eutrophication for decades, a sudden break and a relatively rapid recovery.             Urban Development Authority (2019). Negombo Development Plan – 2019 - 2030,
   Front. Mar. Sci. 6:26. doi: 10.3389/fmars.2019.00026                                          Vol. I. Colombo: Urban Development Authority.
Pérez-Ruzafa, A., Marcos, C., Pérez-Ruzafa, I. M., and Pérez-Marcos, M. (2011).               Vasconcelos, R. P., Reis-Santos, P., Costa, M. J., and Cabral, H. N. (2011).
   Coastal lagoons:“transitional ecosystems” between transitional and coastal                    Connectivity between estuaries and marine environment: integrating metrics
   waters. J. Coast. Conserv. 15, 369–392. doi: 10.1007/s11852-010-0095-2                        to assess estuarine nursery function. Ecol. Indic. 11, 1123–1133. doi: 10.1016/j.
Rabalais, N. N., Turner, R. E., and Wiseman, W. J. Jr. (2001). Hypoxia in the Gulf               ecolind.2010.12.012
   of Mexico. J. Environ. Qual. 30, 320–329. doi: 10.2134/jeq2001.302320x                     Wei, H., He, Y., Li, Q., Liu, Z., and Wang, H. (2007). Summer hypoxia adjacent to
Rajapaksha, J. K. (1997). Low Frequency Tidal Response and Water Exchange in a                   the Changjiang Estuary. J. Mar. Syst. 67, 292–303. doi: 10.1016/j.jmarsys.2006.
   Restricted Lagoon: The Negombo Lagoon, Sri Lanka. M.Sc. thesis. Gothenburg:                   04.014
   University of Gothenburg.                                                                  Wijeratne, E. M. S., and Rydberg, L. (2007). Modelling and observations of
Rajapaksha, J. K., and Jayasiri, H. B. (2000). Restricted water exchange in the                  tidal wave propagation, circulation and residence times in Puttalam Lagoon,
   Negombo Lagoon on the west coast of Sri Lanka. J. Natl. Aquat. Resour. Res.                   Sri Lanka. Estuar. Coast. Shelf Sci. 74, 697–708. doi: 10.1016/j.ecss.2007.05.012
   Dev. Agency 36, 35–46.                                                                     Yan, Q., Cheng, T. T., Song, J., Zhou, J., Hung, C.-C., and Cai, Z. (2021). Internal
Renaud, M. L. (1986). Detecting and avoiding oxygen deficient sea water by brown                 nutrient loading is a potential source of eutrophication in Shenzhen Bay, China.
   shrimp, Penaeus aztecus (Ives), and white shrimp Penaeus setiferus (Linnaeus).                Ecol. Indic. 127:107736. doi: 10.1016/j.ecolind.2021.107736
   J. Exp. Mar. Biol. Ecol. 98, 283–292. doi: 10.1016/0022-0981(86)90218-2
Rocha, C., Galvao, H., and Barbosa, A. (2002). Role of transient silicon limitation           Conflict of Interest: The authors declare that the research was conducted in the
   in the development of cyanobacteria blooms in the Guadiana estuary, south-                 absence of any commercial or financial relationships that could be construed as a
   western Iberia. Mar. Eco. Prog. Ser. 228, 35–45. doi: 10.3354/meps228035                   potential conflict of interest.
Rydberg, L., and Wickbom, L. (1996). Tidal choking and bed friction in Negombo
   Lagoon, Sri Lanka. Estuaries 19, 540–547. doi: 10.2307/1352516                             Publisher’s Note: All claims expressed in this article are solely those of the authors
Samarakoon, J., and Van Zon, H. (1991). Environmental Profile of Muthurajawela                and do not necessarily represent those of their affiliated organizations, or those of
   and Negombo Lagoon. Colombo: Euroconsult/Greater Colombo Economic                          the publisher, the editors and the reviewers. Any product that may be evaluated in
   Commission.                                                                                this article, or claim that may be made by its manufacturer, is not guaranteed or
Schneeberger, C. L., O’Driscoll, M., Humphrey, C., Henry, K., Deal, N., Seiber, K.,           endorsed by the publisher.
   et al. (2015). Fate and transport of enteric microbes from septic systems in a
   coastal watershed. J. Environ. Health 77, 22–30.                                           Copyright © 2021 Hsieh, Chuang, Shih, Weerakkody, Huang, Hung, Muller,
Schuhmann, P., Skeete, R., Waite, R., Bangwayo-Skeete, P., Casey, J., Oxenford,               Ranatunga and Wijethunga. This is an open-access article distributed under the
   H. A., et al. (2019). Coastal and marine quality and tourists’ stated intention to         terms of the Creative Commons Attribution License (CC BY). The use, distribution
   return to Barbados. Water 11:1265. doi: 10.3390/w11061265                                  or reproduction in other forums is permitted, provided the original author(s) and
Shih, Y.-Y., Lin, H.-H., Li, D., Hsieh, H.-H., Hung, C.-C., and Chen, C. T. A. (2019).        the copyright owner(s) are credited and that the original publication in this journal
   Elevated carbon flux in deep waters of the South China Sea. Sci. Rep. 9:1496.              is cited, in accordance with accepted academic practice. No use, distribution or
   doi: 10.1038/s41598-018-37726-w                                                            reproduction is permitted which does not comply with these terms.

Frontiers in Marine Science | www.frontiersin.org                                        13                                          September 2021 | Volume 8 | Article 678832
You can also read