European Quarterly ING Monthly - October 2022 3 October 2022
←
→
Page content transcription
If your browser does not render page correctly, please read the page content below

Monthly Economic Update October 2022
                                              THINK Economic and Financial Analysis

ING Monthly
3 October 2022
                                     European Quarterly
October 2022

Bracing

         for a tough winter

www.ing.com/THINK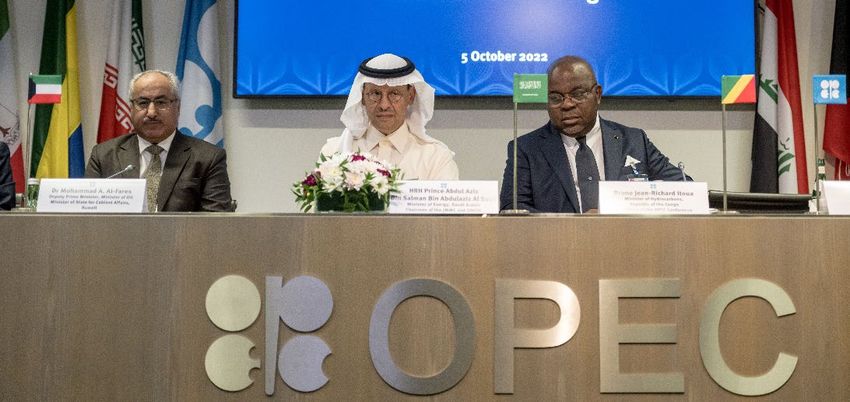
Monthly Economic Update October 2022

                                   Bracing for a tough winter
                                   As the global economy slides into a winter recession, Europe is in the eye of the
                                   storm. High energy costs caused by the war in Ukraine and rising interest rates
                                   have sent a cold chill through the region, which is only set to get worse. And as
                                   ING's Carsten Brzeski explains, there is no easy way out

                                   The global economy has clearly not turned for the better in recent weeks. On the
                                   contrary, our earlier fears of a looming recession seem to have become a reality. All
                                   sentiment indicators point to a slowing of the global economy; the only question is how
                                   severe this slowdown will be. The deceleration in activity is being driven by high energy
                                   and commodity prices but increasingly also by higher interest rates. Let’s not forget that
                                   over the last 70 years, the most common trigger for a global recession has indeed been
                                   too aggressive monetary policy tightening.

                                   It is no surprise that Europe remains in the eye of the storm. The war in Ukraine
                                   continues to rage on and the risk of further escalation seems higher than a peace deal
                                   being reached any time soon. High energy prices have increasingly found their way into
                                   the real economy, denting private consumption, industrial production and shrinking
                                   profit margins. The silver lining of filled national gas reserves has recently become
                                   clouded again by the stoppage of the Nordstream 1 pipeline and the cold September
                                   weather. The risk of energy supply disruptions is back again. Even worse, there is an
                                   increasing awareness that high energy prices will not only be a problem for this winter
                                   but also for next.

                                   While everyone is still assessing the depth of a potential winter recession, another risk
                                   has not yet received sufficient attention; the eurozone may be witnessing the end of the
                                   business cycle as we knew it. Energy prices are very likely to remain high – very high – in
                                   the coming years. This will be a structural, not just cyclical burden on companies’ cost
                                   competitiveness and households’ purchasing power. It is a structural shift that could be
                                   compared with the deleveraging many eurozone countries saw after the financial crisis
                                   and which led to subdued growth for many years. Consequently, the risk is high that the
                                   eurozone economy will not experience a V-shaped or U-shaped recovery but rather, a J-
                                   shaped recovery.

                                   This distinction between a rather traditional cyclical recession and a recession at the
                                   start of a structural change is important as it has implications for the right policy
                                   answer. Currently, many governments have started to support the demand side of the
                                   economy with large fiscal stimulus packages. It is a recipe that worked well during the
                                   pandemic. However, the history of previous crises or downturns in the eurozone shows
                                   that such fiscal stimulus only works in the absence of structural issues. In the case of
                                   highly needed structural change and transition, fiscal stimulus aimed at the demand
                                   side of the economy rather runs the risk of delaying change at the cost of surging
                                   government debt.

                                   It is not easy to be a European policymaker these days. The potential economic fallout
                                   of the looming recession could be painful and in a worst-case scenario runs the risk of
                                   destroying production capacity for good. At the same time, the European economy is
                                   facing a structural energy shock which actually requires a policy answer aimed at the
                                   supply side of the economy. Currently, however, most efforts are aimed at the demand
                                   side, and monetary and fiscal policy are clearly not in sync. While the European Central
                                   Bank is hiking interest rates to fight inflation and inflation expectations, implicitly
                                   accepting a weakening of the demand side, governments are actually supporting the
                                   demand side. Delivering fiscal stimulus that is both aimed at the supply and demand

                                                                                                                              2
Monthly Economic Update October 2022

                                   side of the economy is possible in theory, but in practice, there are clear limits to such
                                   stimulus in the form of too high government debt, as the recent market reaction to the
                                   UK government’s fiscal stimulus plans showed.

                                   An uncomfortable truth is that the current crisis in Europe cannot be quickly and easily
                                   resolved. Indeed, it increasingly appears that it cannot be resolved without accepting
                                   economic damage. We are bracing for a tough winter.

                                                                                                      carsten.brzeski@ing.de

                                   Our key calls this month
                                   • The US economy is likely to deteriorate in 2023 with consumer spending and
                                       business capital expenditure set to fall, while unemployment is likely to rise. We
                                       expect a 75bp rate hike from the Federal Reserve in November and a further 50bp in
                                       December. But mounting concerns about growth and the housing market are likely
                                       to lead to rate cuts from the third quarter of 2023.

                                   • The Eurozone is entering a recession and we expect a deeper downturn over the
                                       winter months. But inflation has hit double-digits and we don’t expect headline
                                       inflation to fall to the ECB’s 2% target until 2024. We expect a 75bp hike in October,
                                       followed by 50bp in December and 25bp in February 2023, bringing the deposit rate
                                       to 2.25%.

                                   • The UK government has U-turned on part of its controversial tax plan but markets
                                       are looking for further measures to reduce borrowing requirements. We expect a
                                       100bp rate hike in November but think the Bank of England is reaching the limits of
                                       how far it can realistically tighten. Mortgage rates have already spiked and together
                                       with higher (albeit capped) energy prices, a mild recession still looks likely.

                                   • China’s economy has recovered slightly due to more flexible Covid measures. But the
                                       real estate crisis will put pressure on economic growth if home sales do not pick up.
                                       Infrastructure stimulus has yet to impact growth as local government spending has
                                       been split between finishing uncompleted homes and infrastructure investment.

                                   • For FX, three quarters of negative growth into 2Q23 and a still hawkish Fed is a
                                       bearish cocktail for EUR/USD. This pair is not particularly cheap and a pick-up in gas
                                       prices this winter will keep the eurozone trade balance under pressure. This could see
                                       EUR/USD falling towards the lower end of a 0.90-0.95 range over the next 3-6
                                       months.

                                   • There is a big fall in market rates to come, but not till the Fed is much closer to being
                                       done. Until then, don’t be too surprised to see a 4% 10-year Treasury yield again in
                                       the weeks ahead. And in the eurozone, the German 10-year back above 2% and the
                                       10-year swap rate above 3%, are all entirely possible.

                                                                                                                                3
Monthly Economic Update October 2022

ING global forecasts
                                                            2022                                    2023                                    2024
                                            1Q22    2Q22    3Q22    4Q22      FY    1Q23 2Q23       3Q23    4Q23      FY    1Q24    2Q24    3Q24    4Q24      FY

United States
GDP (% QoQ, ann)                            -1.6    -0.6     1.4     0.6      1.7     -2    -1.6     1.3     2.3     -0.3    2.7     2.6     2.3     2.2      2.1
CPI headline (% YoY)                         8.0     8.6     8.3     7.2      8.0    5.6     3.4     2.6     2.2      3.5    1.8     1.6     1.6     1.8      1.7
Federal funds (%, eop)                      0.50    1.75    3.25    4.50     4.50   4.50    4.50    4.00    3.50     3.50   3.00    2.50    2.50    2.50     2.50
3-month interest rate (%, eop)              0.65     2.1     3.5     4.6      4.6    4.4    4.25     3.8    3.25     3.25   2.75     2.5     2.4    2.45     2.45
10-year interest rate (%, eop)              2.40    3.00    3.75    4.00     4.00   3.50    3.00    2.75    2.50     2.50   2.50    2.50    2.75    3.00     3.00
Fiscal balance (% of GDP)                                                    -4.2                                    -4.6                                    -3.9
Gross public debt / GDP                                                     100.2                                   101.7                                   101.8

Eurozone
GDP (% QoQ, ann)                              2.7     3.1   -0.8    -3.2      2.9   -2.4     0.4     1.2     1.4     -0.8    1.7     1.6     1.6     1.4      1.5
CPI headline (% YoY)                          6.0     8.0    9.3    10.0      8.3    9.1     6.4     4.4     2.6      5.6    2.3     2.2     1.9     1.9      2.1
Refi minimum bid rate (%, eop)               0.00    0.00   1.25    2.50     2.50   2.75    2.75    2.75    2.75     2.75   2.50    2.50    2.50    2.50     2.50
3-month interest rate (%, eop)              -0.45   -0.35   1.17    2.20     2.20   2.40    2.40    2.40    2.30     2.30   2.10    2.10    2.20    2.30     2.30
10-year interest rate (%, eop)               0.60    1.40   2.10    2.25     2.25   1.80    1.80    1.90    1.90     1.90   2.00    2.10    2.30    2.40     2.40
Fiscal balance (% of GDP)                                                    -5.1                                    -4.5                                    -3.5
Gross public debt/GDP                                                        99.9                                    97.7                                      97

Japan
GDP (% QoQ, ann)                              0.2     3.5     2.0     1.6     1.6     0.4     0.4     0.8     0.8     1.1     1.2     1.2     1.2     1.2     1.0
CPI headline (% YoY)                          0.9     2.5     2.9     3.4     2.4     3.1     2.4     1.9     1.4     2.2     1.2     1.2     1.2     1.2     1.2
Interest Rate on Excess Reserves (%)        -0.10   -0.10   -0.10   -0.10   -0.10   -0.10   -0.10   -0.10   -0.10   -0.10   -0.10   -0.10   -0.10   -0.10   -0.10
3-month interest rate (%, eop)               0.00   -0.04   -0.01   -0.01   -0.01   -0.01   -0.01   -0.01   -0.01   -0.01   -0.01   -0.01   -0.01   -0.01   -0.01
10-year interest rate (%, eop)               0.25    0.20    0.25    0.25    0.25    0.25    0.25    0.20    0.20    0.20    0.20    0.20    0.15    0.15    0.15
Fiscal balance (% of GDP)                                                     -10                                      -7                                      -5
Gross public debt/GDP                                                       270.0                                   265.0                                   260.0

China
GDP (% YoY)                                  4.8     0.4     4.4     4.6      3.6    5.4     9.3     3.9     6.3      6.2    5.0     3.4     6.1     4.0      4.6
CPI headline (% YoY)                         1.1     2.3     2.5     2.6      2.1    2.8     2.6     2.6     2.6      2.1    2.8     2.6     2.0     1.8      2.3
PBOC 7-day reverse repo rate (% eop)        2.10    2.10    2.00    2.00     2.00   2.00    2.00    2.00    2.00     2.00   2.00    2.00    2.10    2.20     2.20
3M SHIBOR (% eop)                           2.38    2.20    1.45    1.50     1.50   1.60    1.80    1.65    1.30     1.30   1.20    1.30    1.50    1.70     1.70
10-year T-bond yield (%, eop)               2.80    2.75    2.51    2.55     2.55    2.6    2.67    2.51    2.55     2.55   2.60    2.67    2.73    2.75     2.75
Fiscal balance (% of GDP)                                                    -5.2                                    -5.5                                    -2.8
Public debt (% of GDP), incl. local govt.                                   142.0                                   152.0                                   154.0

UK
GDP (% QoQ, ann)                             2.8     0.9     0.1    -2.1      4.4   -1.0     0.0     1.0     1.0     -0.4    1.3     1.5     1.5     1.5      1.2
CPI headline (% YoY)                         6.2     9.2    10.1    10.4      9.0    9.8     6.4     4.8     3.0      6.0    2.3     1.9     2.0     2.0      2.1
BoE official bank rate (%, eop)             0.75    1.25    2.25    3.75     3.75   3.75    3.75    3.75    3.50     3.50   3.00    2.50    2.25    2.25     2.25
3-month interest rate (%, eop)              2.70    2.70    3.35    3.70     3.70   3.70    3.70    3.70    3.40     3.40   2.85    2.35    2.20    2.20     2.20
10-year interest rate (%, eop)              2.50    2.25    4.10    4.25     4.25   3.75    3.75    3.50    3.25     3.25   3.00    3.00    3.25    3.25     3.25
Fiscal balance (% of GDP)                                                     4.0                                     7.8                                     4.5
Gross public debt/GDP                                                        99.3                                   104.1                                   106.1

EUR/USD (eop)                               1.11    1.05    0.97    0.92     0.92   0.92    0.95    0.98    1.00     1.00   1.02    1.05    1.08    1.10     1.10
USD/JPY (eop)                               122     132     145     148      148    148     145     143     140      140    138     135     133     130      130
USD/CNY (eop)                               6.34    6.69    7.11    7.35     7.35    7.3    7.10    6.95    6.90     6.90    6.8    6.65    6.50    6.30     6.30
EUR/GBP (eop)                               0.84    0.86    0.88    0.92     0.92   0.92    0.90    0.88    0.88     0.88   0.88    0.88    0.88    0.88     0.88

ICE Brent -US$/bbl (average)                  98     112      98      97     101      94      92      98     102      97      95      87      85      80      87

GDP forecasts are rounded to the nearest whole/half number, given the large magnitude and uncertainty surrounding our estimates
Source: ING forecasts

                                                                                                                                                                4
Monthly Economic Update October 2022

                                          Three scenarios for the global
Carsten Brzeski
Global Head of Macro and Chief
Economist, Eurozone, Germany, Austria
                                          economy and energy prices as
carsten.brzeski@ing.de

James Smith
                                          winter beckons
Economist, Developed Markets
james.smith@ing.com                       It's no secret that the global economic outlook hinges on energy prices this winter, but
                                          every country faces a unique cocktail of challenges ranging from central bank
Peter Vanden Houte
                                          tightening to Covid-19. Our team have built three new scenarios for each of the major
Chief Economist, Belgium, Luxembourg,
Eurozone                                  economies we cover
peter.vandenhoute@ing.com

James Knightley
Chief International Economist, Americas
james.knightley@ing.com
                                            Three scenarios for the global economy and energy prices
Iris Pang
Chief Economist, Greater China              With the global economy in the grips of various crises and uncertainties, it once
iris.pang@asia.ing.com
                                            again makes sense to view the outlook through scenarios. But unlike during Covid -
Warren Patterson                            where most countries were up against a common set of challenges – each economy
Head of Commodities Strategy                is typically facing a unique cocktail of several key issues. A one-size-fits-all approach
warren.patterson@asia.ing.com
                                            to scenario planning no longer makes sense. This article outlines three scenarios for
                                            each of the major economies we cover, and delves into what they imply for growth,
                                            inflation and central bank policy.

   Every economy is facing a different cocktail of challenges

   Source: ING

                                                                                                                                        5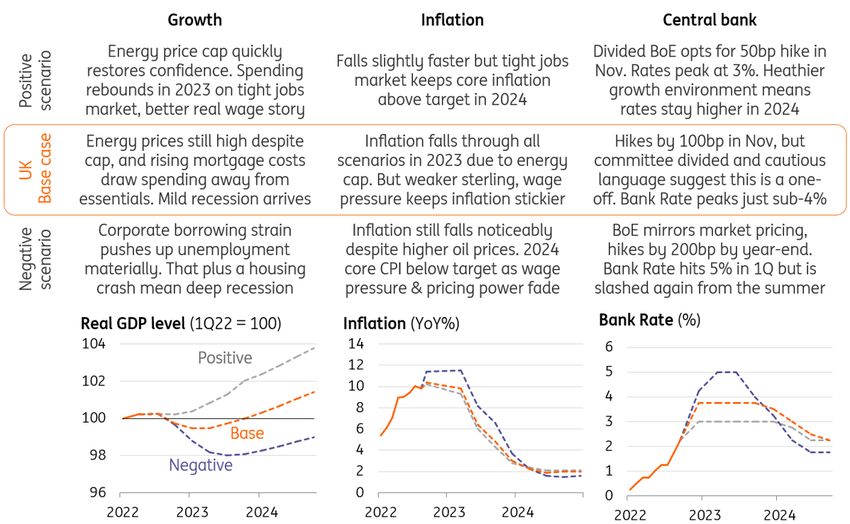
Monthly Economic Update October 2022

Three scenarios for energy prices

Source: Macrobond, ING

Three scenarios for the US economy

Source: Macrobond, ING

                                       6
Monthly Economic Update October 2022

Three scenarios for the Eurozone economy

Source: Macrobond, ING

Three scenarios for the UK economy

Source: Macrobond, ING

                                           7
Monthly Economic Update October 2022

Three scenarios for China’s economy

Source: Macrobond, ING

                                       8
Monthly Economic Update October 2022

October 2022 - Scenario forecasts
                             3Q22      4Q22    FY22   1Q23    2Q23    3Q23    4Q23    FY23   1Q24    2Q24   3Q24   4Q24    FY24

United States
Real GDP (QoQ ann%)
Upside scenario                1.4      1.5     1.8    -0.5     0.5     2.0     3.0    0.8     3.5    3.5    3.0    2.7     2.9
Base case                      1.4      0.6     1.7    -2.0    -1.6     1.3     2.3   -0.3     2.7    2.6    2.3    2.2     2.1
Downside scenario              1.4      0.2     1.7    -2.0    -3.0    -3.0    -2.0   -1.4    -1.0    0.5    3.0    3.5    -0.5
Inflation (YoY%)
Upside scenario                8.3      7.0     8.0    5.3     3.0     2.0     1.7     3.0    1.5     1.5    1.8     2.0    1.7
Base case                      8.3      7.2     8.0    5.6     3.4     2.6     2.2     3.5    1.8     1.6    1.6     1.8    1.7
Downside scenario              8.3      8.0     8.2    7.5     6.5     5.8     5.0     6.2    3.5     2.0    0.5    -1.0    1.3
Fed Funds Rate (%)
Upside scenario               3.25     4.25    4.25   4.25    3.75    3.25    2.75    2.75   2.25    2.00   2.00   2.00    2.00
Base case                     3.25     4.50    4.50   4.50    4.50    4.00    3.50    3.50   3.00    2.50   2.50   2.50    2.50
Downside scenario             3.25     4.75    4.75   6.00    6.00    6.00    5.00    5.00   4.00    3.00   2.00   1.50    1.50

Eurozone
Real GDP (QoQ ann%)
Upside scenario               -0.7      -0.5    3.1     2.0     2.3    3.0      2.0    1.4    1.5     1.0    1.1    1.2     1.7
Base case                     -0.8      -3.2    2.9    -2.4     0.4    1.2      1.4   -0.8    1.7     1.6    1.6    1.4     1.6
Downside scenario             -1.4      -4.8    2.7    -4.3    -0.9    0.8     -0.5   -2.1    0.2     1.7    2.0    1.8     0.7
Inflation (YoY%)
Upside scenario                9.3      8.0     7.8    4.0     3.5     2.5     2.0     3.0    2.3     2.3    2.2    2.1     2.2
Base case                      9.3     12.0     8.3    9.1     6.4     4.4     2.6     5.6    2.3     2.2    1.9    1.9     2.1
Downside scenario              9.3     11.5     8.6   11.0    10.0     7.0     6.0     8.5    4.0     3.0    2.5    2.0     2.9
ECB Main Refi Rate (%)
Upside scenario               1.25     2.50    2.50   3.00    3.00    3.00    3.00    3.00   3.00    2.75   2.50   2.25    2.25
Base case                     1.25     2.50    2.50   2.75    2.75    2.75    2.75    2.75   2.50    2.50   2.50   2.50    2.50
Downside scenario             1.25     2.00    2.00   1.50    1.50    1.50    1.50    1.50   1.50    1.50   1.50   1.50    1.50

United Kingdom
Real GDP (QoQ ann%)
Upside scenario                0.1      -0.2    4.6     0.6     1.8     1.9    2.9     0.9    1.4     1.8    1.8    1.8     1.9
Base case                      0.1      -2.1    4.4    -1.0     0.0     1.0    1.0    -0.4    1.3     1.5    1.5    1.5     1.2
Downside scenario              0.1      -2.3    4.4    -3.5    -2.4    -0.6    0.2    -1.8    0.7     1.0    1.0    1.0     0.4
Inflation (YoY%)
Upside scenario               10.1     10.2     8.9    9.3     6.0     4.3     2.8     5.6    2.4     2.1    2.1    2.1     2.2
Base case                     10.1     10.4     9.0    9.8     6.4     4.8     3.0     6.0    2.3     1.9    2.0    2.0     2.1
Downside scenario             10.1     11.4     9.2   11.5     8.2     6.6     3.7     7.5    2.3     1.6    1.5    1.6     1.8
Bank Rate (%)
Upside scenario               2.25     3.00       -   3.00    3.00    3.00    3.00       -   2.75    2.25   2.25   2.25       -
Base case                     2.25     3.75       -   3.75    3.75    3.75    3.50       -   3.00    2.50   2.25   2.25       -
Downside scenario             2.25     4.25       -   5.00    5.00    4.00    3.25       -   2.25    1.75   1.75   2.00       -

China
Real GDP (YoY%)
Upside scenario                6.0       7.5    5.3    8.1    12.0     6.2     8.0     8.6    7.3     5.5    8.3    7.8     7.2
Base case                      4.4       4.6    3.6    5.4     9.3     3.9     6.3     6.2    5.0     3.4    6.1    4.0     4.6
Downside scenario             -1.0      -1.0   -0.1    3.5     4.0     2.0     3.0     3.1    2.5     1.5    4.5    2.0     2.6
Inflation (YoY%)
Upside scenario                3.5      4.0     3.5    4.2     4.5     4.0     3.5     4.1    3.5     3.3    3.0    3.0     3.2
Base case                      2.5      2.6     2.1    2.8     2.6     2.6     2.6     2.1    2.8     2.6    2.0    1.8     2.3
Downside scenario              1.8      2.0     1.8    2.0     1.8     1.8     1.8     1.9    1.5     1.2    1.0    1.0     1.2
7-day reverse repo (%)
Upside scenario               2.10     2.20    2.20   2.30    2.30    2.30    2.30    2.30   2.30    2.30   2.30   2.30    2.30
Base case                     2.00     2.00    2.00   2.00    2.00    2.00    2.00    2.00   2.00    2.00   2.10   2.20    2.20
Downside scenario             1.80     1.60    1.60   1.40    1.20    1.00    1.00    1.00   1.00    1.00   1.00   1.00    1.00

Energy
Brent crude (USD/bbl)
Upside scenario                98        85      98     82      80      78      75      79     75      78     76     72      75
Base case                      98        97     101     94      92      98     102      97     95      87     85     80      87
Downside scenario              98       105     103    108     110     118     122     115    105      96     94     88      96
Dutch TTF (EUR/MWh)
Upside scenario               205       195     151    150     130     110     120     128    120      90     95    105     103
Base case                     205       225     158    180     160     210     250     200    210     150    130    140     158
Downside scenario             205       250     164    200     180     230     280     223    230     170    145    155     175

Source: ING estimates

                                                                                                                             9
Monthly Economic Update October 2022

                                          Central banks: what next from the
                                          Fed, ECB and Bank of England?
                                          The Federal Reserve is closing in on the top of its tightening cycle as the European
James Knightley
Chief International Economist, Americas   Central bank gets started. The Bank of England could hike by 100bp in November but is
james.knightley@ing.com                   likely to undershoot market expectations thereafter
Carsten Brzeski
Global Head of Macro and Chief
Economist, Eurozone, Germany, Austria
carsten.brzeski@ing.de

James Smith
Economist, Developed Markets
james.smith@ing.com

                                          ING's latest central bank forecasts

                                          Source: Macrobond, ING

                                          Federal Reserve
                                          The Fed’s belated attempts to get a grip on inflation have resulted in the most rapid and
                                          aggressive interest rate increases since the 1980s. Borrowing costs are surging
                                          throughout the economy and are already causing significant pain, particularly in the
                                          housing market which has just posted the first monthly price fall in more than 10 years
                                          in the wake of plunging mortgage applications and rising supply.

                                          Construction activity is already capitulating while the cost-of-living crisis and plunging
                                          equity and bond markets and a softening housing market are set to weigh more
                                          intensely on consumer spending in the months ahead. At the same time, businesses are
                                          becoming more cautious with survey evidence suggesting corporate investment plans
                                          are being scaled back and a growing proportion of companies are freezing hiring plans.
                                          Nonetheless, inflation pressures are lingering with core (excluding food and energy
                                          rates) rising once again. As such, we favour a fourth consecutive 75bp hike in November,
                                          but we expect a more muted 50bp hike in December given the weakening backdrop.

                                                                                                                                  10
Monthly Economic Update October 2022
We are increasingly convinced that the US will experience substantial falls in inflation in
2023. Used car auction prices are down 15% while falling home prices are set to
intensify and will drag down the key shelter components within inflation in the second
half of the year. Surveys of corporate price plans have weakened markedly, energy costs
are lower and recessionary forces will only intensify these trends. This should allow the
Fed to pivot to rate cuts in the second half of 2023.
European Central Bank
Since the late summer and probably marked by Isabel Schnabel’s Jackson Hole speech,
the ECB’s reaction function has clearly and drastically changed. Following in the Fed’s
footsteps, the ECB has increasingly focused on actual inflation and, to a lesser extent,
inflation expectations.
What started off as a gradual normalisation process has become a hardcore fight
against actual inflation. Not too long ago, the ECB’s forward guidance hinted at no rate
hikes in 2022, or only a 25bp rate hike in July. It’s all history. With eurozone inflation at
10%, it is hard to see how the ECB cannot move again by 75bp at the October meeting.
In this context, the discussion on whether or not the ECB can actually bring down actual
headline inflation is no longer relevant for the ECB.
Even an increasingly unfolding recession is not enough to slow down the ECB. It clearly is
an experiment with a risk of turning into a policy mistake, particularly if the economy
falters much more than the ECB currently expects, but for the time being the central
bank looks fully determined to continue on the path of aggressive rate hikes.
The first real test of how sustainable the consensus within the ECB is will only come at
the December meeting. A new round of staff projections is likely to show further
downward revisions to growth and could show 2025 inflation at 2%, tempting some of
the newly self-declared tough inflation fighters to blink. However, we currently see the
ECB hiking by another 50bp in December and 25bp in February 2023. We sense that it
would like to go even further but we fear that the recession could be nasty enough to
even second-guess the February hike.
Bank of England
Markets are expecting a lot from the Bank of England over the coming months. Though
the situation has calmed in recent days, investors are still pricing the Bank Rate to go
above 5% by March 2023 (currently 2.25%). Over 100bp worth of hikes are priced for the
November meeting alone.
That puts policymakers in a tricky position. If the Bank follows through with this amount
of tightening, then there’s a clear risk of turbulence for borrowers. Two-year mortgage
rates are already tipping over 5%, and at the very least that’s likely to see a dramatic
slowdown in housing transactions.
Consumer fundamentals – be it employment or savings levels – remain solid, so it’s not
clear whether a material number of homeowners are pressured to sell. But at the very
least, the rise in monthly repayments as consumers re-fix will take money away from
other non-essential spending categories. For corporates, previous Bank of England
analysis has suggested that the percentage of firms experiencing low interest coverage
ratios would hit a record high should rates go north of 4%.
We therefore expect the Bank to err on the side of caution. We expect a sizable hike at
the November meeting, and it’s a bit of a coin toss between 75bp and 100bp (we’ve
pencilled in the latter). Market pricing may force the BoE’s hand, and we know the hawks
are worried about sterling weakness.
But the committee is undeniably divided, and the newest member – Swati Dhingra –
voted for just 25bp at the most recent September meeting. Even if the Bank does hike by
100bp next month, subsequent tightening is likely to be less aggressive. We expect the
Bank Rate to peak a little below 4% in December.
11Monthly Economic Update October 2022
Macro concerns vs commodity
supply constraints
Commodity markets have come under pressure due to a strengthening US dollar and a
Warren Patterson
Head of Commodities Strategy
raft of central banks hiking interest rates recently. This has clouded the macro outlook.
warren.patterson@asia.ing.com However, the supply picture for a number of commodities remains fragile
Gerben Hieminga
Senior Sector Economist
gerben.hieminga@ing.com
The OPEC+ put
Oil prices came under pressure in September, with ICE Brent falling by almost 9% over
the month and trading to the lowest levels since January. US dollar strength and central
bank tightening have weighed on prices and clouded the demand outlook.
From a supply perspective, the oil market has been in a more comfortable position.
Russian oil supply has held up better than most were expecting due to China and India
stepping in to buy large volumes of discounted Russian crude oil. The demand picture
has also been weaker than expected.
However, we believe there is a good floor for the market not too far below current levels.
Firstly, the EU ban on Russian oil comes into force on 5 December, followed by a refined
products ban on 5 February. This should eventually lead to a decline in Russian supply, as it
is unlikely that China and India would be able to absorb significantly more Russian oil.
Secondly, US Strategic Petroleum Reserve releases are set to end later this year. If not
extended, we could start to see large drawdowns in US commercial inventories, which
are very visible to the market and could provide more support.
Potential OPEC+ intervention should also provide a good floor to the market. Already this
week, OPEC+ announced a 2MMbbls/d supply cut through until the end of 2023.
However, it is important to remember that given OPEC+ is cutting output from target
production levels, the actual cut will be smaller given that most OPEC+ members are
already producing well below their target levels. Our numbers suggest that the group’s
paper cut of 2MMbbls/d will work out to an actual cut of around 1.1MMbbls/d.
Price caps and price forecasts
As for the proposed G7 price cap on Russian oil, the EU now appears to have agreed on
the mechanism. However, once implemented, there is still plenty of uncertainty over
whether it will have the desired effect of keeping Russian oil flowing and limiting Russian
oil revenues. Without the participation of big buyers, such as China and India, it is
difficult to see the price cap being very successful. In addition, there is always the risk
that Russia reduces output in response to the price cap.
12Monthly Economic Update October 2022
We currently expect Brent to trade largely within the US$90 area for the remainder of
this year and into the first half of 2023, before strengthening over the second half of
2023. However, given the large supply cut recently announced by OPEC+, the global
market will likely be in deficit through the whole of 2023, suggesting that there is upside
to our current forecasts.
Even tighter times ahead for European gas
European natural gas prices have come off their highs in August, falling more than 40%
from the recent peak. Comfortable inventory levels have helped, with storage 89% full
already. The EU has also managed to build storage at a quicker pace than originally
planned. In addition, intervention from the EU is likely to leave some market participants
on the sidelines, given the uncertainty over how policy may evolve.
It also appears that the EU is moving towards a price cap on natural gas in some shape
or form. Whilst this will offer some relief to consumers, it does not solve the
fundamental issue of a tight market for the upcoming winter. We need to see demand
destruction in order to balance the market through the high demand months of the
winter, but capping prices will do little to ensure this. It will be difficult to get through this
period unless we see demand falling aggressively, and this becomes more of a challenge
when we see seasonally higher demand. The latest numbers from Eurostat show that
EU gas consumption was 11% below the five-year average over July, falling short of the
15% reduction the EU is targeting. In recent weeks, consumption has also come under
further pressure as a result of industrial shutdowns.
EU gas storage above target levels while demand comes under pressure
Source: GIE, Eurostat, ING Research
It is looking increasingly likely that the trend for Russian gas flows is lower in the months
ahead. At the moment, the EU is only receiving Russian pipeline natural gas via Ukraine
and through TurkStream, and there is the risk that we will see these flows decline as
well. Recently, Gazprom warned that Russia could sanction Ukraine’s Naftogaz due to
ongoing arbitration. This would mean that Gazprom would be unable to pay transit fees
to Naftogaz, which puts this supply at risk. At the moment, volumes transiting Ukraine
are in the region of 40mcm/day. Meanwhile, total daily Russian flows via pipeline to the
EU are down in the region of 75-80% year-on-year.
The EU should be able to get through the upcoming winter if demand declines by 15%
from the five-year average between now and the end of March. The bigger concern,
however, will be for the following winter in 2023/24. Earlier this year, we saw some
decent flows of Russian gas, which helped with rebuilding inventory. Next year, Russian
flows are likely to be minimal, which means that the EU may build inventories at a
slower pace. We therefore expect to go into winter in 2023/24 with very tight
inventories, which suggests the risk of even higher prices over this period.
13Monthly Economic Update October 2022
US: a cold wind is blowing
This has been a disappointing year for the US economy with two consecutive quarters
James Knightley
of falling output. It will be worse in 2023. Consumer spending and business capital
Chief International Economist, Americas
james.knightley@ing.com expenditure look set to fall and unemployment will rise in response to the rapidly
tightening financial conditions caused by dollar strength, rising rates and widening
credit spreads
Tougher conditions ahead for consumers and businesses
The Federal Reserve’s delayed response to the obvious inflation threat means it is
playing catch-up and raising interest rates faster than at any time since the late 1980s.
This is contributing to considerable dollar strength while prompting rapid rises in
borrowing costs throughout the economy. This significant tightening of financial
conditions is a clear headwind to growth and comes at a time when consumer and
business confidence is already under immense pressure from the rising cost of living and
falling equity, bond and real estate prices.
Housing market set for sustained weakness
Unfortunately, our worst fears about falling transactions and the prospect of sharp price
falls in the US residential property market appear to be coming true. Mortgage rates
have doubled since the start of the year leading to a 36% collapse in mortgage
applications for home purchases while the supply of new and existing homes is up 64%
and 50% from their respective lows.
Ratio of US existing home prices to median household income ratios (1999-2022)
Source: Macrobond, ING
This rapidly changing dynamic means the 45% jump in home prices since the start of
the pandemic looks unsustainable. After all, the median house price-to-income ratio is
14Monthly Economic Update October 2022
more stretched than at the peak of the 2005/06 housing bubble. Consequently, July’s
first monthly price fall in more than 10 years looks set to be the start of many with even
Fed Chair Jerome Powell publicly acknowledging the need for a correction. This will be
bad news for construction activity as well as spending on furniture, furnishings,
electronics and building supplies.
Labour market shows signs of softening
Consumer weakness is already spreading beyond the property market. We had hoped
the plunge in gasoline prices would free up cash that would translate into stronger
consumer activity elsewhere. There was a temporary lift to restaurant dining numbers,
air passenger traffic and google mobility data, but it hasn’t shown up in consumer
spending more broadly.
On top of this, we are seeing a growing number of firms freeze hiring plans with job
vacancies falling by more than one million in August. The one consolation is that most
firms are experiencing labour shortages so there will be a reluctance to fire staff. The Fed
is predicting a 0.9pp rise in the unemployment rate over the next year, which would
work out as 1.2 million people losing their jobs assuming the labour supply remains
unchanged.
Inflation will soon turn lower
While core inflation rates have been moving higher recently, we are increasingly
confident in our call that we could see inflation head towards 2% by the end of 2023 as
recessionary forces erode corporate pricing power. The chart below of the National
Federation of Independent Businesses’ price plan series is already offering very
encouraging news for a potential slowdown in US inflation with fewer firms anticipating
price hikes due to weakening sales growth and rising inventories.
Corporate pricing power appears to be weakening: NFIB price plans and the core PCE
deflator inflation measure
Source: Macrobond, ING
Moreover, weightings for shelter costs and vehicle prices are far, far higher in the US
inflation calculation than in Europe – a combined 40% for the US basket of goods and
services versus 12% for Europe. With the US housing rent components lagging house
price changes by around 12-14 months, we expect to see shelter go from contributing
more than 2pp to the headline inflation rate to contributing nothing next year.
Meanwhile, auction prices for used cars are down 15% from their peak and are set to fall
sharply as the supply of new vehicles ramps up now as supply chain strains are easing.
15Monthly Economic Update October 2022
Fed rate hikes to give way to cuts in the second half of 2023
We are forecasting that the Federal Reserve will raise the policy rate by another 75bp in
November, but the intensifying economic headwinds look set to result in a more modest
50bp hike in December which will mark the peak at 4.25-4.5%. This would mean real
interest rates turning positive in the second quarter based on our inflation forecast – a
key metric that the Fed wants to achieve.
Once the Fed has hit the pause button on rate hikes the market will swiftly move to
anticipate rate cuts. We expect them to start coming through from the third quarter of
2023 as the Fed seeks to prevent a more prolonged downturn that could result in
inflation falling well below 2% over the medium term. Robust household balance sheets
and a still-tight labour market offer hope that once lower borrowing costs materialise
and risk assets stabilise, the recovery can come relatively quickly and vigorously.
16Monthly Economic Update October 2022
There’s no denying it anymore: the
eurozone is in recession
Peter Vanden Houte
After a growth deceleration over the summer months, eurozone indicators strongly
Chief Economist, Belgium, Luxemb
Eurozone deteriorated in September, suggesting the start of the recession. Meanwhile, inflation
peter.vandenhoute@ing.com
has reached double-digit figures, setting the European Central Bank on a more
aggressive tightening path
According to the latest weather analyses, the risk of a cold winter has risen
Headwinds intensify
The challenges that the eurozone economy has been facing over the last few months
have not disappeared. If anything, they have got worse. The war in Ukraine seems to be
far from over with Russia deciding on a partial mobilisation after a rather successful
Ukrainian counter-offensive. Natural gas exports from Russia to the European Union
have been cut further and the sabotage of the Nord Stream 1 and 2 pipelines has
created some fears regarding the safety of the gas pipelines from Norway.
Unfortunately, according to the latest weather analyses, the risk of a cold winter has
risen. We continue to expect very tight natural gas markets over the winter months,
keeping prices at uncomfortably high levels. Moreover, because of the lack of natural gas
imports from Russia, prices are not likely to fall significantly in 2023. This will hurt the
supply side of the economy, with a growing number of European companies reducing
production. And while governments have stepped up their support for households and
businesses, we still believe that consumption will contract. At the same time,
increasingly tight financial conditions are another headwind for growth.
European natural gas prices are likely to remain at historically high levels
Source: Refinitiv Datastream
17Monthly Economic Update October 2022
Negative growth in 2023
While the deceleration of economic activity seemed to be limited during the holiday
season, the September data now clearly screams recession. The Composite PMI indicator
stood at 48.2 in September, clearly below the 50 boom-or-bust-level. With inventories
building on the back of slowing sales, eurozone manufacturers reduced their purchases
of inputs for the third month in a row. Consumer confidence fell in September to the
lowest level since the survey started, with households especially worried about their
financial situation over the next 12 months.
The ECB’s assessment that households will reduce their savings to maintain their level of
consumption looks illusory to us, as European consumers tend to save more in times of
great uncertainty. The Eurocoin indicator, a gauge of the underlying growth pace,
perfectly illustrates the strong deterioration of the economic environment in September:
it fell from 0.23% to -0.73%. We therefore stand with our forecast of a small negative
growth figure for the third quarter of 2022 and a deeper downturn over the winter
months. With the ECB in a tightening mode, we also anticipate a more subdued recovery
over the course of 2023. For next year, we now anticipate a 0.8% GDP contraction, after
a 2.9% expansion in 2022.
Eurozone consumer confidence falls to a very low level
Source: Refinitiv Datastream
Double-digit inflation
Meanwhile, the inflation rate has hit double-digit figures: it rose to 10% in September.
Energy prices remain the main culprit, but core inflation also rose to 4.8%. However,
according to the models of the national central banks, the indirect effects of higher
energy costs are currently contributing around one-third to core inflation. This means
that once energy prices stabilise, core inflation will also come down. That said, this is
likely to be a very gradual process. We still expect 5.6% headline inflation for 2023 and
we believe it will take until the second half of 2024 before inflation reaches the ECB’s 2%
target.
A more hawkish ECB
Since the Jackson Hole conference in August, the ECB has become more aggressive. As it
seems to have lost confidence in its medium-term inflation forecast, it is now focusing
much more on current inflation. Quite a change! That explains why the bank now wants
to get rates back to neutral as fast as possible and is even willing to go a bit further, as
long as the recession is not creating too much unemployment. We therefore see a 75bp
hike in October, followed by 50bp in December and 25bp in February 2023, bringing the
deposit rate to 2.25%. The ECB might also decide to stop the reinvestment of its asset
purchase programme (APP) portfolio somewhere in the first half of next year. However,
the pandemic emergency purchase programme (PEPP) portfolio is likely to be reinvested
until the end of 2024. As for bond yields, some further limited upward potential is still on
the cards, but around the turn of the year, the yield curve is very likely to invert in the
wake of the significant economic downturn.
18Monthly Economic Update October 2022
UK: recession likely amid mounting
market turmoil
James Smith
Economist, Developed Markets The UK government has U-turned on part of its controversial tax plan but markets are
james.smith@ing.com looking for further measures to reduce borrowing requirements over the next couple of
years. The prospect of further Bank of England tightening means higher mortgage rates,
which coupled with expensive (though capped) energy bills likely means recession
British Prime Minister Liz Truss and Chancellor of the Exchequer Kwasi Kwarteng at the opening session of
Conservative Party Conference, London, UK - 02 Oct 202
The UK's fiscal event has prompted a wave of volatility in markets
The British government’s not-so-mini Budget a couple of weeks ago sparked chaos in UK
financial markets. Investors are worried both about the amount of extra borrowing
markets will need to absorb as a result of the government’s energy price guarantee and
unfunded tax cuts, and the inflationary impact and resulting Bank of England reaction.
Any resolution to the current crisis needs to be seen through that lens.
The government has since rowed back on a plan to cut the top rate of income tax, and
will also bring forward the publication of its ‘medium-term fiscal plan’. The latter likely
involves spending cuts to offset the tax rises, and it’ll also be coupled with a forecast
from the Office for Budget Responsibility. Investors are reading this both as a sign that
the government is prepared to compromise in the face of market (and political)
pressure, and that it is seeking to restore the role of the UK’s independent OBR in the
process. The lack of an independent forecast with the mini-Budget had added to investor
concerns.
19Monthly Economic Update October 2022
The cost of fixing household energy bills has tumbled - but that could change if gas
prices surge once more
Source: Ofgem Methodology, Refinitiv, ING calculations - Without the government's guarantee, the unit prices for
energy bills are set by the regulator Ofgem. We have estimated what these unit prices would have been based on
wholesale gas and electricity futures now, and as of 26 August when gas prices peaked. The cost to the
government is calculated as the difference between these unit prices, and the government's price guarantee
(£2500) over a period of two years
Markets want further reassurances on tax cuts and the BoE's QT plans
These are first steps, however, and neither U-turn addresses the central issue for
investors described earlier. Scrapping the 45% tax bracket made up only £2bn out of the
total £45bn tax cuts package. Spending cuts are likely, but these may prove both
politically and practically challenging. Many government departments are already set to
face real-terms cuts in budgets while reducing public-sector investment goals looks
inconsistent with ambitions to improve the supply side of the economy.
Fortunately, gas futures prices have fallen sharply since August, and the aggregate cost
of fixing household energy bills has more than halved. The 'energy price guarantee' will
fix the average household energy bill at £2500, which is roughly where it has been since
April once additional discounts are added in.
Still, the government may find it needs to look again at a broader windfall tax covering
certain types of energy producers – something that is politically popular, would likely
raise tens of billions, and would provide a natural hedge should energy prices surge once
again (raising the government's bill for capping consumer/business costs).
“Our base case for the economy is still recession”
For now, some limited order has been restored to both the pound and the government
bond (gilt) market – though the latter heavily relies on the Bank of England’s verdict on
whether to plough ahead with active bond sales later this month, as part of its
quantitative tightening process. Together with a decision earlier this year to stop
reinvesting the proceeds of maturing bonds in its portfolio, selling gilts would add
roughly £80bn of extra supply for the market to absorb over 12 months. In such a
volatile environment that’s a hard sell – and we suspect the BoE will put its plans to sell
gilts on ice for a little while longer.
Higher mortgage and energy costs point to a mild recession
Our base case for the economy is still recession – albeit perhaps a mild one by historical
comparison. Despite the mounting fiscal concerns, we shouldn’t underestimate the
difference the government’s energy price cap will make to the outlook. It will save £1500
on average over the next 12 months.
20Monthly Economic Update October 2022
Still, households will still be paying more than twice as much for energy as they were
two years ago, and it’s a similar story for mortgages. The average monthly payment on
a two-year fix looks set to top £1600, up from around £900 in 2020, looking at the
current rates available. Households inevitably need to cut back on non-essential
spending, and that likely means negative GDP growth rates through the winter.
21Monthly Economic Update October 2022
China: recovery derailed by real
estate crisis
Iris Pang The economy has recovered slightly due to more flexible Covid measures. But the real
Chief Economist, Greater China
iris.pang@asia.ing.com estate crisis will put pressure on economic growth if home sales do not pick up.
Infrastructure stimulus has yet to impact growth as local government spending has
been split between finishing uncompleted homes and infrastructure investment
China finally show signs of a slight recovery
More flexible Covid measures have resulted in shorter quarantine periods and more
localised lockdowns, which have had less impact on the labour force than the measures
imposed a few months back. Consumers have shown a willingness to buy electric
vehicles with government subsidies and are also eating out more. But they are still
reluctant to buy luxury items. Overall, retail sales grew 5.4% year-on-year in August
after 2.7% growth in July.
Industrial production also picked up to 4.2% YoY in August from 3.8% in July as more
flexible Covid measures enabled more people to go to work.
As such, the People's Bank of China did not cut interest rates in September.
China retail sales show recovery (%YoY)
Source: ING, Bloomberg
Real estate crisis
In the real estate market, some local governments have been pairing with property
developers to finish uncompleted projects. But an improvement in market sentiment will
22Monthly Economic Update October 2022
only happen if some of the larger projects are finished to a high standard. Home buying
activity should then pick up.
The market is now seeing genuine demand. The government is trying to fully unleash
this demand by implementing policies such as cutting taxes for home upgrades. There
are also policies for first-time buyers with lower mortgage rates. This fresh demand
seems to be re-activating existing home sales, which were sluggish in the past due to a
lot of new builds coming onto the market. This shift could reduce demand for new
homes as buyers may worry that houses bought off-plan may not be completed. This, in
turn, does not help housing starts. But at least some buyers are back in the market.
The long delay of fiscal stimulus
Facing both a Covid crisis and a real estate crisis, local governments with limited fiscal
resources have had to prioritise what to deal with first. For most of them, the more
urgent problem has been the stagnation in housing starts - and thus the drop in land
auctions, which have traditionally provided local governments with the revenue they
need to run their governments properly.
This explains the delay in infrastructure projects even as local government special bonds
have been issued for this year. Even though the central government has called for an
increase in infrastructure investment, only a few local governments have actually
accelerated spending and they are mainly investing in existing projects, not new ones.
Source: ING, CEIC
Double whammy is coming
External demand could be weaker in 2023. If the real estate crisis and decisions over
Covid measures cannot be resolved (at least partially) China could face a tough year
ahead, especially in manufacturing.
23Monthly Economic Update October 2022
Asia: this is not 1997
Despite some superficial similarities, there are really very few parallels between
today's markets and the Asian financial crisis of 1997/98
Rob Carnell
Regional Head of Research, Asia- Pacific
rob.carnell@ing.com
Currency trader watches monitors at a foreign exchange dealing room in Seoul, South Korea
Things were very different (worse) in 1997 Asia
Being old enough to have been covering the Asia-Pacific region during the financial crisis
in 1997/98, I can speak with some authority in saying that it was nothing like what we
are experiencing today. Indeed, the Asia region as a whole was in far worse shape then
than it is now.
Let's break it down.
Asian FX: A relative outperformer
Perhaps the most important difference between now and then is in the exchange rate
regimes being run by Asian economies. For the most part, these were fixed exchange
rates pegged to the USD. There is a concise description of the causes and effects of the
Asian financial crisis from the IMF in 1998 here. In a nutshell, Asian economies back then
combined high interest rates to attract capital inflows to finance investment and
currencies pegged to the US dollar at favourable rates to achieve rapid export-led
growth. Hot money was often channelled into unproductive property investments rather
than raising the productive capital of these economies, which worsened the side effects
when the bubble finally popped.
About the only similarity between then and now is what ultimately broke the currency
pegs: hot money outflows attracted back to the US as the Federal Reserve raised rates
to curb inflation upon emerging from recession in the mid-1990s. This caused the USD to
appreciate along with Asian currencies as they were pegged, losing competitiveness.
The Thai baht collapsed first, and contagion then pulled down the Philippine peso,
Indonesian rupiah, and eventually the Korean won. The foreign debt that had helped
finance the earlier rapid growth then became a massive debt-service headache,
requiring IMF assistance and bailouts to prevent default.
So the first and rather glaring point to make is that across the region, exchange rates
are not currently pegged to the USD. They may not all be the purest floats, and not all
currencies are freely convertible, but they are not fixed. Nevertheless, as the chart below
24Monthly Economic Update October 2022
shows, their depreciation (year-to-date and quarter-to-date 3Q22) is for the most part
not as severe as the benchmark EUR/USD, or many other G-10 currencies (British pound,
Swedish krona, Norwegian krone).
Put another way, Asian currencies aren't collapsing; the USD is strengthening.
Relative Asian FX performance year and quarter-to-date (3Q22)
Source: CEIC, ING
FX reserves much fatter buffers
One of the remedies prescribed by the IMF to fix the broken Asian economies in the late
90s was that they needed to bolster themselves by accruing much bigger FX reserves.
The two charts below show the extent of these reserves with reference to 1) months of
import cover and 2) gross external debt (really, net external debt is the relevant metric,
but gross debt serves its purpose here).
In almost all cases, export-cover is considerably better today than in 1997 or is very high
anyway if not. Six months of cover is generally considered a decent buffer, so anything
over that should not result in market nervousness. Malaysia is the main exception to
this, and even then, import cover is almost double what it was back in 1997. The ringgit
took a different path to salvation from other Asian currencies during this period. But for
the record, Bank Negara Malaysia Governor Nor Shamsiah Mohd Yunus ruled out a
return to capital controls or currency pegs a little more than a week ago.
The second chart shows reserves as a ratio to gross external debt. Like import cover,
reserves relative to external debt are now much more substantial. Where they remain
low (Japan, Singapore), the gross debt position is negligible anyway, and the net position
is a substantial surplus, so it is irrelevant.
The only caveat we would make to this discussion that hints that everything is fine is
that although the levels look comfortable, they have been declining. Central banks
across the region have recently started intervening to limit the amount of currency
depreciation, or at least to smooth its volatility. Reserves have been dropping, and the
value of imports is rising due to inflation, so this is definitely a space worth watching. It
isn't all good.
25Monthly Economic Update October 2022
Import cover (months)
Source: CEIC, ING
Reserves to external debt ratio
Source: World Bank, ING
Current accounts good, but not as good as they were
The other thing that isn't quite as good now as it was before Covid and before Russia
invaded Ukraine is Asia's current account environment. Of course, this is the main way
to replenish depleted FX reserves. China used to account for a large proportion of Asia's
inbound tourism, but as its zero Covid policies effectively keep these flows close to zero,
tourism centres like Thailand have been hit extremely hard. As a result, their current
account surplus has been turned into a deficit.
Secondly, most of Asia is a net importer of energy (exceptions are Malaysia and
Indonesia, as well as Australia). So, with natural gas prices spiking on increased
competition with Europe for available non-Russian LNG, much of Asia has seen long-
standing trade surpluses turn into deficits. Fortunately, large net investment income
inflows mean that current accounts have held up better than trade balances.
26Monthly Economic Update October 2022
Current accounts in Asia still strong
Source: CEIC, ING
On balance, things still look OK
We wouldn't want to finish this note by hinting that everything is fine in Asia. It isn't.
Growth is slowing as inflation bites on spending power and increasing policy rates are
beginning to raise debt service burdens. China's lacklustre activity and European
demand weakness are weighing on regional export strength, and a US recession is likely
before too long. On top of this, there is also a downturn in the important semiconductor
sector.
However, while all of this probably implies further currency weakness ahead, this is the
safety valve that means a more abrupt break should be avoided. Never say never, but
we don't see this ending like in 1997.
27Monthly Economic Update October 2022
CEE: central banks face tough policy
decisions amid persistent inflation
The economies of Central and Eastern Europe are slowing, but the picture in most cases
Rafal Benecki is not that bad. However, global conditions suggest it will be a hard winter. Central
Chief Economist, Poland
banks are trying to end the hiking cycle against market expectations, although the
rafal.benecki@ing.pl
peak in inflation is not clear and fiscal policy has become more expansionary
Frantisek Taborsky
EMEA FX&FI Strategist
frantisek.taborsky@ing.com
Péter Virovácz
Senior Economist, Hungary
peter.virovacz@ing.com
Valentin Tataru
Chief Economist, Romania
valentin.tataru@ing.com
Countries in Central and Eastern Europe continue to grapple with high inflation. Pictured: Brasov, Romania
Poland: To end the hiking cycle or not?
Poland faces persistently rising inflation and zloty (PLN) weakness. The National Bank of
Poland’s (NBP) forecast of CPI stabilising after the summer holidays has failed to
materialise. In September, CPI rose to 17.2% year-on-year, a 25-year high. Upward
pressure from energy prices is being accompanied by second-round effects. Core
inflation continues to grow strongly. This throws Monetary Policy Council calls to end, or
at least pause, hiking into question. We expect at least two 25bp rate hikes by the
central bank in the fourth quarter of 2022. The rate hike cycle should conclude at 7.5%,
or lower, in the first quarter of 2023. Proposed fiscal measures targeted at cushioning
increases in electricity and gas prices for households should allow for a CPI slowdown
and the NBP to ease in the second half of 2023. But the end of these measures could
then cause CPI to rise above 10% year-on-year in 2024. For a more detailed outlook,
check our latest Monitoring Poland.
The economy is on track to expand by 0.6% quarter-on-quarter, seasonally adjusted in
the third quarter, after a decline of 2.1% QoQ, avoiding a technical recession in mid-
2022. Annual growth may slightly exceed 3% in the third quarter, and 2022 full-year
GDP should reach 4%, before slowing to 1.5% in 2023 amid the intensifying energy
shock, deteriorating external conditions and elevated inflation. High inflation is projected
to cool down consumer demand, while high interest rates hamper investment activity.
The zloty remains under pressure. Sentiment is unlikely to change given the
unfavourable external environment (especially mounting tensions between Russia and
the West) and the NBP signalling a prompt end to its tightening cycle. Still, positioning
against PLN is already significant and should offer some scope for a recovery of the zloty
if external factors improve. However, EUR/PLN is unlikely to move significantly below 4.8
in the fourth quarter regardless.
28Monthly Economic Update October 2022
General government balance (% of GDP)
Source: Macrobond, ING forecast
Czech Republic: All work has been done
While leading indicators continue to disappoint - the PMI has fallen to its lowest level
since 2020 and consumer confidence is at a record low due to rising inflation - the hard
data has been more upbeat, with GDP surprising on the upside in the second quarter.
Thus, the overall picture is better than expected but confirms a slowing economy. In
terms of inflation, we have seen downside surprises in the last two months. However,
this does not change the inflation trajectory, in our view. We expect a peak in the next
few months, probably in the September number at 17.6% year-on-year.
Fiscal policy remains very unclear given the ongoing discussions at the government level
on measures to counter energy prices. The government has approved an increase in the
state budget deficit from CZK280bn to CZK330bn (4.9% of GDP), but MPs are proposing a
further increase to CZK370bn (5.4% of GDP), which should be decided in the coming
weeks. Monetary policy remains unchanged. The Czech National Bank confirmed the
end of the hiking cycle at its last meeting in September and we don't see many triggers
that would force the central bank to deliver an additional rate hike.
On the FX side, things are getting more interesting given the increase in the cost of
central bank interventions during the September meeting, which puts the potential early
exit of this regime back on the table. In the baseline scenario, we expect the koruna to
remain near intervention levels of 24.60-70 EUR/CZK until at least year-end, however, we
see a higher risk that the Czech National Bank will be forced to make a change to the
current regime sooner.
Hungary: We see relief rallies despite gathering clouds
Anecdotal evidence and economic rationality suggest that the Hungarian economy is
already navigating through recessionary territory. Households are facing higher energy
bills after the change in the utility bill support scheme. Eurostat’s harmonised index of
consumer prices (HICP) is showing an 18.6% year-on-year inflation rate mainly driven by
food and utility prices. These should affect consumption negatively. High interest rates
and the cloudy outlook will take their toll on investment activity.
On the other hand, hard data regarding the third quarter has been limited. July readings
haven’t shown any major issues, so our gloomy view of the economy is based more on a
hunch than real evidence. August data is coming soon and we will probably see the first
set of hard data evidencing the downturn. We see a technical recession during the third
and fourth quarters of 2022, providing a major headwind for 2023, where we see only
0.4% GDP growth alongside 15% average inflation. For a more detailed outlook, check
our latest Monitoring Hungary.
29You can also read