Effects of multi-charge on aerosol hygroscopicity measurement by a HTDMA
←
→
Page content transcription
If your browser does not render page correctly, please read the page content below
Atmos. Meas. Tech., 14, 1293–1301, 2021
https://doi.org/10.5194/amt-14-1293-2021
© Author(s) 2021. This work is distributed under
the Creative Commons Attribution 4.0 License.

Effects of multi-charge on aerosol hygroscopicity
measurement by a HTDMA
Chuanyang Shen1 , Gang Zhao1,2 , and Chunsheng Zhao1
1 Department    of Atmospheric and Oceanic Sciences, School of Physics, Peking University, Beijing 100871, China
2 College   of Environmental Sciences and Engineering, Peking University, Beijing 100871, China

Correspondence: Chunsheng Zhao (zcs@pku.edu.cn)

Received: 20 August 2020 – Discussion started: 8 September 2020
Revised: 2 December 2020 – Accepted: 22 December 2020 – Published: 18 February 2021

Abstract. The humidified tandem differential mobility ana-       1   Introduction
lyzer (HTDMA) is widely used to measure the hygroscopic
properties of submicron particles. The size-resolved aerosol
hygroscopicity κ measured by a HTDMA will be influenced          Atmospheric particles can scatter solar radiation and absorb
by the contribution of multiply charged aerosols, but this       longwave radiation, which directly affects the Earth’s radi-
effect on field measurements has seldom been discussed           ation balance (Haywood and Boucher, 2000; Bond et al.,
for previous field measurements. Our calculations demon-         2013). They can also indirectly affect the climate by acting
strate that the number ratio of multiply charged particles is    as cloud nuclei and modifying the optical properties and life
quite considerable for some specific sizes between 100 and       cycle of clouds (Albrecht, 1989; Twomey, 1974; Charlson et
300 nm, especially during a pollution episode. The presence      al., 1992). Both of these effects are closely related to aerosol
of multiple charges will lead to a compression effect on the     particle hygroscopicity, which describes the ability of a par-
aerosol hygroscopicity in HTDMA measurements. There-             ticle to absorb water under sub- or supersaturated conditions
fore, we propose a new algorithm that performs multi-charge      (e.g., McFiggans et al., 2006). Aerosol hygroscopicity also
correction of the size-resolved hygroscopicity κ, taking both    plays a vital role in aspects of environmental science. It is
the compression effect and the multi-charge number contri-       reported to be an important influence on environmental visi-
bution into consideration. Application of the algorithm to       bility because it can greatly enhance particle light scattering
field measurements showed that the relatively high hygro-        efficiency and degrade visibility when the relative humidity
scopicity in the accumulation size range leads to the over-      is high (Chen et al., 2012; Xu et al., 2020). It can increase the
estimation of the hygroscopicity of particles smaller than       liquid water content of aerosol particles, affect multiphase
200 nm. The low hygroscopicity of coarse-mode particles          chemistry and local photochemistry, and facilitate particle
leads to the underestimation of the hygroscopicity of accu-      formation and aging processes (Wu et al., 2018; Herrmann
mulation particles between 200 and 500 nm in size. The dif-      et al., 2015; Ervens et al., 2011). In human health, the de-
ference between the corrected and measured κ values can be       position pattern of inhaled particles in the human respiratory
as large as 0.05, highlighting that special attention must be    tract depends on the size of the particles, which is influenced
paid to the multi-charge effect when a HTDMA is used for         by their hygroscopicity (Heyder et al., 1986; Löndahl et al.,
aerosol hygroscopicity measurements.                             2007). In general, the hygroscopicity of an aerosol particle is
                                                                 one of the most important properties to consider when quan-
                                                                 tifying its climatic and environmental effects. It is also useful
                                                                 to characterize the chemical properties of the particle in de-
                                                                 tail. Therefore, correct and detailed measurements of aerosol
                                                                 hygroscopicity are required.
                                                                    While many instruments are currently used to characterize
                                                                 the hygroscopicity of aerosol particles, the humidified tan-

Published by Copernicus Publications on behalf of the European Geosciences Union.
1294 C. Shen et al.: Multi-charge effects
dem differential mobility analyzer (HTDMA) is one of the 2 Multi-charge effects
most widely used (Swietlicki et al., 2008; Tang et al., 2019).
As it can directly provide the particle size distribution af- 2.1 Number contribution from multiply charged
ter water uptake, a HTDMA can be employed to obtain both particles
the mixing state and the bulk mean hygroscopic properties of
ambient aerosol particles. Two differential mobility analyz- In the DMA sizing process, only particles within a narrow
ers (DMAs; Swietlicki et al., 2008) are used in this technique electrical mobility (Zp ) range can pass through the classi-
to quantify the changes in particle size upon exposure to dif- fier exit slit and reach the humidification and size distribution
ferent relative humidities (RHs). The measured distribution measurement system downstream. The electrical mobility is
function (MDF) is skewed from the actual particle growth defined as
factor probability density function (GF-PDF) and smoothed. veC(Dp )
Several inversion algorithms have therefore been developed Zp = , (1)
3π µDp
to retrieve the true GF-PDF (Cubison et al., 2005; Gysel et
al., 2009; Stolzenburg and McMurry, 2008; Voutilainen et where C(Dp ) is the Cunningham slip correction, e is the el-
al., 2000), including the TDMAfit algorithm, the optimal es- ementary charge, v is the number of elementary charges on
timation method (OEM), and the TDMAinv algorithm. How- the particle, µ is the gas viscosity, and Dp is the physical di-
ever, these algorithms are based on the assumption that the ameter of the particle. From Eq. (1), we can see that the same
sampled particles are predominantly singly charged particles. electrical mobility can be achieved using different combina-
Under this condition, the forward function can be simplified tions of particle diameter and charge, and this is where multi-
and data analysis can be limited to the particle size of interest charge effects come from.
(it will not be influenced by other particle sizes). If the num- The range that can pass through the DMA is termed the
ber fraction of multiply charged particles with the selected mobility bandwidth 1Zp , defined as
dry diameter becomes significant, the measured results will
be affected by contributions from other dry particle sizes. In qa ∗
1Zp = Z , (2)
this case, appropriate data inversion is quite complicated. qsh p
However, in some special cases, accurate data inversion
where Zp∗ is the set mobility and qa and qsh are the aerosol
for multiply charged particles can be achieved when the sam-
flow rate and sheath air flow rate, respectively. This equation
pled particles are exclusively doubly or triply charged. Gy-
does not account for diffusion broadening.
sel et al. (2009) obtained the kernel functions for multiply
We can calculate the particle charge distribution at each
charged particles, and Duplissy et al. (2008) applied them in
size using a theoretical model developed by Wiedensohler et
the data inversion to retrieve the correct growth factors (GFs).
al. (1986). The probability that a particle will pass through
The dry sizes he selected are dominated by doubly or triply
a DMA classifier can then be determined using the kernel
charged particles. However, in most field measurements, this
function
assumption is invalid. As far as we are aware, no previ- X∞
ous studies have performed multi-charge correction of HT- G Dp∗ , x = F (x, v)(x, v, Dp∗ ), (3)
v=1
DMA measurements of atmospheric aerosol particles. Also,
the effect of multi-charge correction on the size-resolved hy- where Dp∗ is the diameter set in the DMA, x is the scale pa-
groscopicity has not been fully evaluated for atmospheric rameter, and F (xv) is the charge distribution of the particles
aerosols. that exit from a neutralizer with v elementary charges at the
In this paper, we first analyze the number contributions scale parameter x. (x, v, Dp∗ ) is the probability that parti-
from particles carrying different charges. Then we present cles will pass through the DMA when the set diameter is Dp∗ .
the compression effect of multiply charged particle hygro- In this study, the maximum value of v was set to 10.
scopicity on HTDMA measurements. These two effects were Therefore, given a particle number size distribution
included in an algorithm that can perform multi-charge cor- (PNSD) n(x), the number of particles that can pass through
rection of the size-resolved particle hygroscopicity. After a DMA with a set diameter Dp∗ is
that, the effects of multi-charge correction using the algo-
rithm on the particle hygroscopicity are discussed. Z∞
N (Dp∗ ) = G Dp∗ , x n (x) dx. (4)
0
If the number of particles that are carrying a specific charge
is needed, the kernel function in Eq. (4) should be replaced
with
Gv Dp∗ , x = F (x, v)(x, v, Dp∗ ), (5)
Atmos. Meas. Tech., 14, 1293–1301, 2021 https://doi.org/10.5194/amt-14-1293-2021C. Shen et al.: Multi-charge effects 1295
2.2 Compression effect on hygroscopicity
Gysel et al. (2009) reported that the center of the kernel func-
tion is systematically offset toward smaller GFs with increas-
ing charge. Figure 2 explains the cause of this compression
effect. For an electrical mobility diameter of 100 nm, dou-
bly and triply charged particles have physical diameters of
about 151 and 196 nm, respectively. When these singly, dou-
bly, and triply charged particles have a true growth factor
of 1.6, they will grow in size to 160, 242, and 314 nm, re-
spectively. Since the charge each particle carries remains un-
changed, their peak sizes in the second DMA are approxi-
mately 160, 154, and 150 nm. Therefore, the growth factors
they display in the HTDMA measurements are 1.6, 1.54 and
1.5, respectively. Thus, it is clear that the growth factor is de-
creased or compressed with increasing charge. We call this
phenomenon the compression effect on the growth factor or
hygroscopicity caused by multi-charge.
When we set a diameter Dp∗ in the DMA, the electrical
Figure 1. (a) Two particle number size distributions (PNSDs) ob- mobility Zp can be calculated via electrical mobility theory
served during field measurements. The black line is the distribution as
during a period of relatively clean air, and the blue line is the distri-
bution during a period of heavy air pollution. (b) The number ratio
eC(Dp∗ )
Zp = . (7)
of particles carrying different charges for each PNSD. For each di- 3π µDp∗
ameter, the left bar corresponds to the PNSD shown in black in (a),
while the right bar corresponds to the PNSD shown in blue. The physical diameter (Dpν ) of particles with the same elec-
trical mobility and a charge number of ν is then
and the corresponding number concentration of particles that veC(Dp∗ ) C(Dpν )
Dpν = = νDp∗ . (8)
can pass through the DMA is 3π µZp C(Dp∗ )
Z∞ We also define the f function such that
Nv (Dp∗ ) = Gv Dp∗ , x n (x) dx. (6)
0
Dpν = f Dp∗ , ν . (9)
The number ratio of particles carrying different charges can The f function describes the physical diameters of multi-
be calculated from Nv (Dp∗ )/N (Dp∗ ). ply charged particles given an electrical mobility diameter.
Two aerosol size distributions discerned from our field The properties of and detailed calculation procedures for this
measurements during a period of relatively clean air and a function can be found in Sect. S2 of the Supplement.
period with air pollution (refer to Sect. 4) are shown in Fig. 1. For a particle of size Dpν with a charge number of ν, if we
In each case, the ratio of particles carrying different charges assume a true growth factor of g0 , the particle will grow in
was calculated from the PNSD using the abovementioned size to g0 Dpν . The virtual growth factor depicted in the DMA
DMA electrical mobility and charging theory. The detailed is expressed as gDMA , such that
calculation procedures are described in Sect. S1 of the Sup-
plement. During the polluted period, when the total parti- g0 Dpν = f gDMA Dp∗ , ν = g0 f Dp∗ , ν . (10)
cle volume concentration is large, an obvious feature of the
PNSD is that the accumulation mode > 100 nm grows very Given f , Dp∗ , and ν, any g0 can be substituted into Eq. (10)
large. The growth of this mode leads to an increase in the to get a corresponding gDMA . If ν = 1, i.e., the particles
proportion of multi-charge particles, especially in the electri- carry only one elementary charge, then gDMA is equal to
cal mobility diameter range 100–300 nm. For example, when g0 . If ν > 1, i.e., the particles are multiply charged, then
we set the diameter to 100 nm in the first DMA, more than gDMA will be lower than g0 . Figure 2b presents an exam-
40 % of the selected particles are multiply charged. This ratio ple with Dp∗ = 100 nm and ν = 2. The x axis is the assumed
is about 30 % and 20 % for electrical mobility diameters of true growth factor g0 , and the y axis is the calculated vir-
200 and 300 nm, respectively. Thus, the HTDMA-measured tual growth factor depicted in the DMA (gDMA ). Generally,
size-resolved hygroscopicity will also be influenced by those the larger the value of g0 , the greater the difference between
multiply charged large particles. gDMA and g0 .
https://doi.org/10.5194/amt-14-1293-2021 Atmos. Meas. Tech., 14, 1293–1301, 20211296 C. Shen et al.: Multi-charge effects
Figure 2. (a) Effects of multiply charged particles on the growth factor. The black, blue, and red lines represent singly, doubly, and triply
charged particles, respectively. The circles represent particles selected by the DMA when the electrical mobility diameter is set to 100 nm.
When the true growth factor is 1.6, these particles grow to the diameters represented by the corresponding crosses. The mode of the MDF
of multiply charged particles peaks at a smaller GF than the true value. (b) The compression effect on the growth factor for doubly charged
particles with an electrical mobility diameter of 100 nm.
Figure 3. (a) The compression effect on the hygroscopicity (at 85 % RH) for doubly charged particles with an electrical mobility diameter of
100 nm. The fitted slope or compression factor is 0.8953. (b) A summary of the compression factors for different electrical mobility diameters
and different charge numbers at 85 % RH.
According to Petters and Kreidenweis (2007), the hygro- tain the hygroscopicity compression factor S(Dp∗ v). The al-
scopic parameter κ for an aerosol particle can be calculated gorithm used to calculate the compression factor is depicted
from the growth factor at a specific RH using κ-Köhler the- in Fig. 4, and the results obtained with it are summarized in
ory. As illustrated in Fig. 3a, all the data points shown in Fig. 3b and Table 1.
Fig. 2b generate corresponding data points in hygroscopic-
ity space. It is clear that a decrease in the growth factor will
results in a decrease in the hygroscopicity, and the compres- 3 Multi-charge correction method
sion effect increases almost linearly with the hygroscopicity
3.1 Multi-charge correction of size-resolved
of the particle. If we fit these data points with a straight line
hygroscopicity
that passes through the origin, the slope of the line can be
considered the compression factor. Figure 3a provides an ex- Multi-charge correction is commonly performed when a
ample of this for Dp∗ = 100 nm and ν = 2. For each combina- DMA is used to scan aerosol particle sizes, especially in
tion of electrical mobility diameter Dp∗ and charge number ν, PNSD measurements. The shape of the PNSD after multi-
we can repeat this calculation and linear fitting process to ob- charge correction can be significantly different from that of
Atmos. Meas. Tech., 14, 1293–1301, 2021 https://doi.org/10.5194/amt-14-1293-2021C. Shen et al.: Multi-charge effects 1297
Table 1. Values of the hygroscopicity compression factor for where K (x) is the true mean κ for the scale parameter
aerosol particles with different electrical mobility diameters at 85 % x, n(x) is the true aerosol number size distribution, and
RH. N (Dp∗ ) is the total number concentration of particles that pass
Dp (nm) 50 100 200 300 400 500 600 through the first DMA. Gs Dp∗ , x is the transformed kernel
(ν)
function G Dp∗ , x of DMA1, which includes the compres-
1 1 1 1 1 1 1 1 sion effect S(Dp∗ , v):
2 0.98 0.90 0.85 0.86 0.87 0.89 0.90
3 0.95 0.82 0.77 0.80 0.83 0.85 0.86 X∞
4 0.92 0.77 0.73 0.77 0.80 0.82 0.84 Gs Dp∗ , x = v=1
F (x, v)(x, v, Dp∗ )S(Dp∗ , v) (12)
5 0.89 0.74 0.71 0.75 0.78 0.81 0.83 Z∞
N (Dp∗ ) = G Dp∗ , x n (x) dx. (13)
0
Equation (5) can then be simplified to the following:
Z∞
∗
K (Dp∗ ) = H Dp∗ , x K (x) (14)
0
or
K ∗ = HK, (15)
where K (x) or K is the true distribution of κ we want to
obtain, K ∗ (Dp∗ ) or K ∗ is the measured κ distribution, and
1
Figure 4. The algorithm for calculating the compression factor. H Dp∗ , x = n (x) G∗ Dp∗ , x dx. (16)
N Dp∗
the raw measured PNSD. Therefore, it is necessary to evalu-
H Dp∗ , x (the H matrix) is the forward function and can be
ate the effect of multi-charge correction on the size-resolved
hygroscopicity obtained by HTDMA. In this study, we de- calculated from the information available. Given a true κ dis-
veloped an algorithm to perform the multi-charge correction tribution, we should be able to calculate the measured κ dis-
of measured values, based on the work of Deng et al. (2011) tribution influenced by the multi-charge effect. The H matrix
and Zhao et al. (2019). accounts for the DMA transfer function, the particle charge
Our correction is based on the assumption that, for each distribution, compression factors, and the number concentra-
electrical mobility diameter set at DMA1, all particles that tion of particles over each size parameter. The detailed steps
pass through DMA1 contribute to the measured mean hy- performed to solve this matrix inverse problem can be found
groscopicity. Each of the contributing particles has the mean in Zhao et al. (2019).
hygroscopicity for its physical size. In reality, when a parti- A hypothetical uncorrected κ distribution K ∗ (Dp∗ ) is
cle with a large dry diameter Dpν and a charge number passes shown along with two examples of a corresponding multi-
through the DMA1 and contributes to the MDF, it is hard to charge-corrected K (x) distribution in Fig. 5a. This κ dis-
elucidate its actual hygroscopicity because there is a prob- tribution represents a common case in the ambient envi-
ability distribution function for hygroscopicity. However, in ronment: relatively low hygroscopicity for ultrafine parti-
our algorithm, this particle is assumed to have the mean hy- cles, high hygroscopicity at accumulation-mode sizes, and
groscopicity for the particle size Dpν . This assumption is sta- coarse-mode particles that are nearly hydrophobic. Multi-
tistically correct and feasible, but may not hold at the single- charge correction was performed using two different PNSDs
particle scale. representing clean and polluted conditions, leading to two
When the scan diameter in the first DMA is set to Dp∗ , the corrected K (x) distributions. It can be seen that when κ
mean hygroscopicity K ∗ observed by the HTDMA can be varies greatly with size, especially among singly, doubly, and
expressed as triply charged particle sizes, large differences will arise be-
tween the pre- and postcorrected κ distributions. For exam-
Z∞ ple, the difference between the measured and corrected κ
∗ 1
K (Dp∗ ) = Gs Dp∗ , x K (x) n (x) dx, (11) values is largest for sizes of 150 and 350 nm. For a singly
N (Dp∗ ) charged particle with an electrical mobility size of 150 nm,
0
https://doi.org/10.5194/amt-14-1293-2021 Atmos. Meas. Tech., 14, 1293–1301, 20211298 C. Shen et al.: Multi-charge effects
the corresponding doubly and triply charged particle sizes are where
around 235 and 314 nm. These three sizes are located in the 1
area of the distribution where κ increases steeply. Similarly, H Dp∗ , x = n (x) G(Dp∗ , x)dx. (22)
for an electrical mobility size of 350 nm, the corresponding N Dp∗
doubly and triply charged particle sizes are about 605 and
852 nm. These three sizes are located in the area where κ H Dp∗ , x (the H matrix) can also be calculated from the
drops greatly. Figure 5a also shows that for regions of the
available information. A hypothetical measured distribution
curve where κ is increasing, the measured κ will be an over-
M ∗ (Dp∗ ) is shown along with two examples of a correspond-
estimate, and for regions of the curve where κ is decreasing,
ing multi-charge-corrected distribution M (x) in Fig. 5b.
the measured κ will be an underestimate.
3.2 Multi-charge correction of the mixing state 4 Application in field measurements
Aside from the size-resolved mean hygroscopicity, other key During the winter of 2019, a comprehensive set of aerosol
information that can be obtained from a HTDMA includes measurements focusing on the hygroscopic properties of par-
the mixing state and the detailed shape of GF-PDF or κ-PDF. ticles in the size range 50–600 nm were conducted at an ur-
The correction of GF-PDF or κ-PDF involves the inversion ban site in Beijing. The measurements were conducted on
of two-dimensional vectors, which is too complicated for this the rooftop of a six-story building on the campus of Peking
study. However, the mixing state can be simply represented University, which is also the location of the AERONET sta-
by the particle number fraction in different GF ranges. Be- tion of BEIJING_PKU (39◦ 590 N, 116◦ 180 E). The sampling
low, we use the number fraction of less hygroscopic particles site was in the northwest of Beijing, surrounded by schools,
as an example. residential buildings, and shopping centers.
The correction of the mixing state is similar in general to During the measurements, a HTDMA instrument was em-
the correction of the mean hygroscopicity, but it differs in ployed to measure the hygroscopic growth factors of parti-
some minor aspects. When the scan diameter in the DMA cles with dry diameters of 50, 100, 200, 300, 400, 500, and
is set to Dp∗ , the number fraction of less hygroscopic (LH) 600 nm at 85 % RH. Before the aerosol sampling, a PM10
particles observed by the HTDMA can be expressed as impactor was used to remove aerosol particles with aerody-
namic diameters larger than 10 µm. Then a dryer was used
Z∞
∗ 1 to decrease the RH to less than 30 %. Next, the dried poly-
M (Dp∗ ) = Gs Dp∗ , x M (x) n (x) dx, (17) disperse particles were guided into a splitter with various in-
N (Dp∗ )
0 struments located downstream, including the HTDMA and a
BMI scanning electrical mobility sizer (BMI SEMS, model
where M ∗ (Dp∗ ) is the measured number fraction of LH parti- 2100). In both of these measurement systems, aerosol par-
cles at the selected diameter Dp∗ in the DMA, and M (x) rep- ticles were first charged by a soft X-ray neutralizer (TSI,
resents the true number fraction at scale parameter x. Also, model 3088) and then those negatively charged particles
X∞ were selected by the DMA. For the HTDMA, the sample
Gs Dp∗ , x = v=1
F (x, v)(x, v, Dp∗ )SM (Dp∗ , v) (18) to sheath ratio in the first DMA was 0.75/4. To calibrate
Z∞ the measurement system, ammonium sulfate particles were
tested and the results were compared with the corresponding
N(Dp∗ ) = G Dp∗ , x n (x) dx, (19)
theoretical values. The calibration included both a dry test
0 and a RH test. To achieve the best working performance, the
where SM (Dp∗ v) represents the correction factor caused by room was air-conditioned at 25 ◦ C and the air was circulated
the compression effect. This factor varies with the GF prob- all the time. Particle number size distributions (PNSDs) for
ability distribution function (GF-PDF) and cannot be simpli- the size range 10–1000 nm were given by the SEMS.
fied to a constant. If we assume that the compression effect To evaluate the effects of multiply charged particles on the
on the LH number ratio can be neglected, then this parameter size-resolved hygroscopicity, we applied multi-charge cor-
is 1, and the equation can be simplified to rection to two weeks of measurement data. The particle num-
ber size distribution and measured size-resolved hygroscop-
Z∞ icity κ are shown in Fig. 6. To facilitate comparison, we
M ∗
(Dp∗ ) = H Dp∗ , x M (x) (20) also present the size-resolved difference between the mea-
sured and corrected hygroscopicity values. Note that, since
0
the upper size limit for the hygroscopicity measurements was
or 600 nm, the hygroscopicity in the higher size range was as-
sumed to decrease linearly to 0 at 1 µm. Also, the hygroscop-
M ∗ = HM, (21) icity of coarse-mode particles was assumed to be 0. In addi-
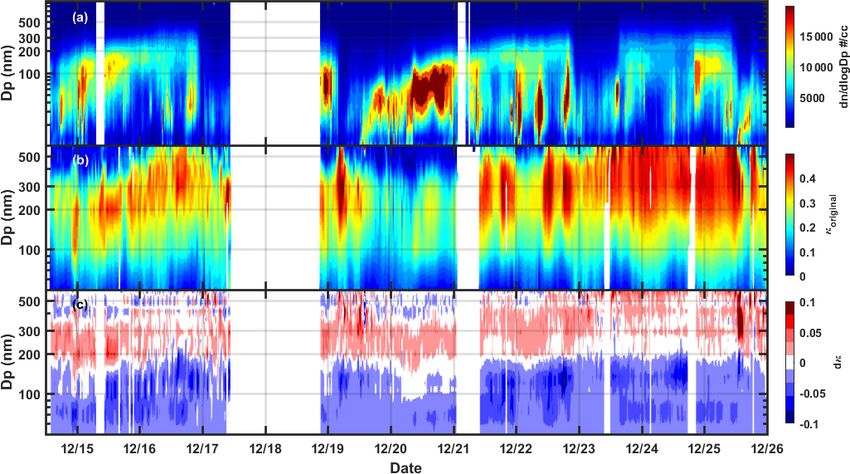
Atmos. Meas. Tech., 14, 1293–1301, 2021 https://doi.org/10.5194/amt-14-1293-2021C. Shen et al.: Multi-charge effects 1299 Figure 5. (a) Multi-charge correction of a hypothetical measured κ distribution. The black line is the measured size-resolved κ, and the dashed lines are multi-charge-corrected κ distributions based on different number size distributions. The PNSDs used are shown in Fig. 1. (b) Multi-charge correction for a mixing state distribution. The black line represents the measured size-resolved number fraction of LH particles, and the dashed lines are the multi-charge-corrected values based on different number size distributions. Figure 6. Field measurements of the PNSD and size-resolved hygroscopicity during a winter in Beijing. (a) The fill color indicates the particle number concentration for a particular diameter Dp . (b) The fill color represents the size-resolved hygroscopicity parameter κ. (c) The fill color indicates the difference dκ between the measured and multi-charge-corrected κ values, i.e., dκ = κcorrected − κmeasured . tion, for particles larger than 1 µm, the number concentration carry multiple charges and sneak into the lower accumula- was assumed to decrease linearly to 0 at 1.2 µm in the multi- tion size set by the DMA, the hygroscopicity for the target charge correction. size region will be lowered. Generally, the hygroscopicity of particles smaller than The difference between the corrected and the measured 200 nm will be overestimated, while the hygroscopicity of size-resolved κ values is generally within 0.05. For the elec- particles larger than 200 nm in size will be underestimated. trical mobility size that was most affected by multi-charge From Fig. 6b, we can see that, in the urban environment, the particles (100 nm), doubly or triply charged particles have hygroscopicity often peaks in the size range 200–400 nm. physical sizes of 151 and 196 nm, respectively. Particles of Because particles in this size range can carry multiple these three sizes normally have similar hygroscopicities, re- charges and be mistakenly treated as smaller sizes in the HT- sulting in only a small effect on the measured κ. However, DMA measurement, their relatively high hygroscopicity will when particles of these three sizes have significantly dif- also be assigned to the smaller sizes, leading to a false in- ferent hygroscopicities, multi-charge correction is necessary. crease in the measured κ. Similarly, most large ambient parti- For particles between 200 and 400 nm, the multi-charge ef- cles have relatively low hygroscopicity. When these particles fect is mostly contributed by particles larger than 400 nm. https://doi.org/10.5194/amt-14-1293-2021 Atmos. Meas. Tech., 14, 1293–1301, 2021
1300                                                                                          C. Shen et al.: Multi-charge effects

Field observations of the hygroscopicity of particles in this          For particle sizes between 200 and 400 nm, the measured
size range are rare, resulting in large uncertainty in the multi-   hygroscopicity is influenced by multiply charged particles
charge correction for this size range. According to our mea-        larger than 400 nm, indicating that hygroscopicity measure-
surements, the variation in hygroscopicity in this size range       ments of these large particles are necessary to obtain the
is relatively large and depends on the pollution conditions         correct hygroscopic properties for accumulation-mode par-
(Shen et al., 2020). On average, the hygroscopicity of parti-       ticles. For particles larger than 400 nm, the multi-charge ef-
cles above 500 nm is lower than it is for other accumulation        fect can be removed by installing an impactor with a cut size
sizes. Because of the assumption that there are few particles       of around 700 nm or lower. Our studies highlight that, in fu-
above 1 µm, the multi-charge effect on particle sizes above         ture, special attention should be paid to multi-charge effects
400 nm is fairly small. In practice, the multi-charge effect        on hygroscopicity measurements, and multi-charge correc-
can be removed for these particles by installing an impactor        tion should be done if accurate size-resolved hygroscopicity
before the inlet of the first DMA.                                  data are needed.

                                                                    Code availability. The code used in this study are available upon
5   Conclusions                                                     request from the authors.

HTDMAs have been extensively used in numerous field mea-
surements to obtain the hygroscopic properties of submicron         Data availability. The data used in this study are available upon
particles. Aerosol particles sampled by a DMA are quasi-            request from the authors.
monodisperse; they have different charges and different di-
ameters. Thus, the size-resolved hygroscopicity measured by
                                                                    Supplement. The supplement related to this article is available on-
a DMA will be influenced by the contribution from multiply
                                                                    line at: https://doi.org/10.5194/amt-14-1293-2021-supplement.
charged aerosols. This effect has seldom been discussed for
field measurements of hygroscopicity using a HTDMA.
    In this study, we first demonstrated that multi-charge in-
                                                                    Author contributions. CS, GZ and CZ discussed the results; CS
fluences the measurement of hygroscopicity through both its         wrote the manuscript.
number contribution and a compression effect. On the one
hand, the number fraction of multiply charged particles is
quite considerable, especially in polluted conditions. Results      Competing interests. The authors declare that they have no conflict
show that 30–40 % of the particles selected by a HTDMA              of interest.
during a pollution episode can be multiply charged. On the
other hand, the growth factor or hygroscopicity measured by
a HTDMA can be smaller than its true value for multiply             Financial support. This research was supported by the National
charged particles, which is called the multi-charge compres-        Key Research and Development Program of China (grant no.
sion effect. The resulting compression factor can be quan-          2016YFC020000: Task 5) and the National Natural Science Foun-
tified using electrical mobility theory and is found to reach       dation of China (grant no. 41590872).
its peak at a size of around 200 nm and to increase with the
charge number of the particle.
    We have also proposed an algorithm that can perform             Review statement. This paper was edited by Mingjin Tang and re-
multi-charge correction of the size-resolved hygroscopicity         viewed by two anonymous referees.
κ and mixing state. This algorithm is based on the principle
of SMPS multi-charge correction, and a knowledge of the
aerosol PNSD is required. The key stages in this algorithm          References
are obtaining the forward function and solving the inverse
problem.                                                            Albrecht, B. A.: Aerosols, Cloud Microphysics, and
    The proposed multi-charge correction was applied to field         Fractional      Cloudiness,     Science,    245,      1227–1230,
measurements to evaluate multi-charge effects. Relatively             https://doi.org/10.1126/science.245.4923.1227, 1989.
                                                                    Bond, T. C., Doherty, S. J., Fahey, D. W., Forster, P. M., Berntsen,
high hygroscopicity in the accumulation size range was
                                                                      T., DeAngelo, B. J., Flanner, M. G., Ghan, S., Kärcher, B., Koch,
found to lead to overestimation of the hygroscopicity for par-
                                                                      D., Kinne, S., Kondo, Y., Quinn, P. K., Sarofim, M. C., Schultz,
ticles smaller than 200 nm, whereas the low hygroscopicity            M. G., Schulz, M., Venkataraman, C., Zhang, H., Zhang, S.,
of coarse-mode particles causes the hygroscopicity to be un-          Bellouin, N., Guttikunda, S. K., Hopke, P. K., Jacobson, M.
derestimated for accumulation particles. The difference be-           Z., Kaiser, J. W., Klimont, Z., Lohmann, U., Schwarz, J. P.,
tween the measured and corrected κ values can be as large as          Shindell, D., Storelvmo, T., Warren, S. G., and Zender, C. S.:
0.05.                                                                 Bounding the role of black carbon in the climate system: A sci-

Atmos. Meas. Tech., 14, 1293–1301, 2021                                               https://doi.org/10.5194/amt-14-1293-2021
C. Shen et al.: Multi-charge effects 1301 entific assessment, J. Geophys. Res.-Atmos., 118, 5380–5552, R., and Weingartner, E.: The effect of physical and chemical https://doi.org/10.1002/jgrd.50171, 2013. aerosol properties on warm cloud droplet activation, Atmos. Charlson, R. J., Schwartz, S. E., Hales, J. M., Cess, R. D., Chem. Phys., 6, 2593–2649, https://doi.org/10.5194/acp-6-2593- Coakley, J. A., Hansen, J. E., and Hofmann, D. J.: Climate 2006, 2006. Forcing by Anthropogenic Aerosols, Science, 255, 423–430, Petters, M. D. and Kreidenweis, S. M.: A single parameter https://doi.org/10.1126/science.255.5043.423, 1992. representation of hygroscopic growth and cloud condensa- Chen, J., Zhao, C. S., Ma, N., Liu, P. F., Göbel, T., Hallbauer, E., tion nucleus activity, Atmos. Chem. Phys., 7, 1961–1971, Deng, Z. Z., Ran, L., Xu, W. Y., Liang, Z., Liu, H. J., Yan, https://doi.org/10.5194/acp-7-1961-2007, 2007. P., Zhou, X. J., and Wiedensohler, A.: A parameterization of Shen, C., Zhao, G., Zhao, W., Tian, P., and Zhao, C.: Measurement low visibilities for hazy days in the North China Plain, At- report: Aerosol hygroscopic properties extended to 600 nm in mos. Chem. Phys., 12, 4935–4950, https://doi.org/10.5194/acp- the urban environment, Atmos. Chem. Phys. Discuss. [preprint], 12-4935-2012, 2012. https://doi.org/10.5194/acp-2020-867, in review, 2020. Cubison, M. J., Coe, H., and Gysel, M.: A modified hygro- Stolzenburg, M. R. and McMurry, P. H.: Equations Governing Sin- scopic tandem DMA and a data retrieval method based gle and Tandem DMA Configurations and a New Lognormal Ap- on optimal estimation, J. Aerosol. Sci., 36, 846–865, proximation to the Transfer Function, Aerosol Sci. Technol., 42, 10.1016/j.jaerosci.2004.11.009, 2005. 421–432, https://doi.org/10.1080/02786820802157823, 2008. Deng, Z. Z., Zhao, C. S., Ma, N., Liu, P. F., Ran, L., Xu, W. Swietlicki, E., Hansson, H. C., Hämeri, K., Svenningsson, B., Y., Chen, J., Liang, Z., Liang, S., Huang, M. Y., Ma, X. C., Massling, A., McFiggans, G., McMurry, P. H., Petäjä, T., Tunved, Zhang, Q., Quan, J. N., Yan, P., Henning, S., Mildenberger, K., P., Gysel, M., Topping, D., Weingartner, E., Baltensperger, U., Sommerhage, E., Schäfer, M., Stratmann, F., and Wiedensohler, Rissler, J., Wiedensohler, A., and Kulmala, M.: Hygroscopic A.: Size-resolved and bulk activation properties of aerosols in properties of submicrometer atmospheric aerosol particles mea- the North China Plain, Atmos. Chem. Phys., 11, 3835–3846, sured with H-TDMA instruments in various environments – a https://doi.org/10.5194/acp-11-3835-2011, 2011. review, Tellus B, 60, 432–469, https://doi.org/10.1111/j.1600- Duplissy, J., Gysel, M., Alfarra, M. R., Dommen, J., Metzger, A., 0889.2008.00350.x, 2008. Prevot, A. S. H., Weingartner, E., Laaksonen, A., Raatikainen, Tang, M., Chan, C. K., Li, Y. J., Su, H., Ma, Q., Wu, Z., Zhang, G., T., Good, N., Turner, S. F., McFiggans, G., and Baltensperger, Wang, Z., Ge, M., Hu, M., He, H., and Wang, X.: A review of ex- U.: Cloud forming potential of secondary organic aerosol under perimental techniques for aerosol hygroscopicity studies, Atmos. near atmospheric conditions, Geophys. Res. Lett., 35, L03818, Chem. Phys., 19, 12631–12686, https://doi.org/10.5194/acp-19- https://doi.org/10.1029/2007GL031075, 2008. 12631-2019, 2019. Ervens, B., Turpin, B. J., and Weber, R. J.: Secondary organic Twomey, S.: Pollution and the planetary albedo, Atmos. Environ., aerosol formation in cloud droplets and aqueous particles (aq- 8, 1251–1256, https://doi.org/10.1016/0004-6981(74)90004-3, SOA): a review of laboratory, field and model studies, Atmos. 1974. Chem. Phys., 11, 11069–11102, https://doi.org/10.5194/acp-11- Voutilainen, A., Stratmann, F., and Kaipio, J. P.: A non- 11069-2011, 2011. homogeneous regularization method for the estimation of nar- Gysel, M., McFiggans, G. B., and Coe, H.: In- row aerosol size distributions, J. Aerosol. Sci., 31, 1433–1445, version of tandem differential mobility analyser https://doi.org/10.1016/S0021-8502(00)00044-6, 2000. (TDMA) measurements, J. Aerosol. Sci., 40, 134–151, Wiedensohler, A., Lütkemeier, E., Feldpausch, M., and https://doi.org/10.1016/j.jaerosci.2008.07.013, 2009. Helsper, C.: Investigation of the bipolar charge distribution Haywood, J. and Boucher, O.: Estimates of the direct and indirect at various gas conditions, J. Aerosol. Sci., 17, 413–416, radiative forcing due to tropospheric aerosols: A review, Rev. https://doi.org/10.1016/0021-8502(86)90118-7, 1986. Geophys., 38, 513–543, https://doi.org/10.1029/1999rg000078, Wu, Z., Wang, Y., Tan, T., Zhu, Y., Li, M., Shang, D., 2000. Wang, H., Lu, K., Guo, S., Zeng, L., and Zhang, Y.: Herrmann, H., Schaefer, T., Tilgner, A., Styler, S. A., Weller, Aerosol Liquid Water Driven by Anthropogenic Inorganic C., Teich, M., and Otto, T.: Tropospheric aqueous- Salts: Implying Its Key Role in Haze Formation over the phase chemistry: kinetics, mechanisms, and its coupling North China Plain, Environ. Sci. Technol. Lett., 5, 160–166, to a changing gas phase, Chem. Rev., 115, 4259–4334, https://doi.org/10.1021/acs.estlett.8b00021, 2018. https://doi.org/10.1021/cr500447k, 2015. Xu, W., Kuang, Y., Bian, Y., Liu, L., Li, F., Wang, Y., Heyder, J., Gebhart, J., Rudolf, G., Schiller, C. F., and Stahlhofen, Xue, B., Luo, B., Huang, S., Yuan, B., Zhao, P., and W.: Deposition of particles in the human respiratory tract in Shao, M.: Current Challenges in Visibility Improvement in the size range 0.005–15 µm, J. Aerosol. Sci., 17, 811–825, Southern China, Environ. Sci. Technol. Lett., 7, 395–401, https://doi.org/10.1016/0021-8502(86)90035-2, 1986. https://doi.org/10.1021/acs.estlett.0c00274, 2020. Löndahl, J., Massling, A., Pagels, J., Swietlicki, E., Vaclavik, E., Zhao, G., Tao, J., Kuang, Y., Shen, C., Yu, Y., and Zhao, C.: and Loft, S.: Size-Resolved Respiratory-Tract Deposition of Fine Role of black carbon mass size distribution in the direct and Ultrafine Hydrophobic and Hygroscopic Aerosol Particles aerosol radiative forcing, Atmos. Chem. Phys., 19, 13175– During Rest and Exercise, Inhalation Toxicology, 19, 109–116, 13188, https://doi.org/10.5194/acp-19-13175-2019, 2019. https://doi.org/10.1080/08958370601051677, 2007. McFiggans, G., Artaxo, P., Baltensperger, U., Coe, H., Facchini, M. C., Feingold, G., Fuzzi, S., Gysel, M., Laaksonen, A., Lohmann, U., Mentel, T. F., Murphy, D. M., O’Dowd, C. D., Snider, J. https://doi.org/10.5194/amt-14-1293-2021 Atmos. Meas. Tech., 14, 1293–1301, 2021
You can also read