Effects of COVID-19-Epidemic-Related Changes in Human Behaviors on Air Quality and Human Health in Metropolitan Parks
←
→
Page content transcription
If your browser does not render page correctly, please read the page content below
atmosphere

Article
Effects of COVID-19-Epidemic-Related Changes in Human
Behaviors on Air Quality and Human Health in
Metropolitan Parks
Wen-Pei Sung * and Chun-Hao Liu

                                          Department of Landscape Architecture, College of Humanities and Creativity, National Chin-Yi University of
                                          Technology, Taichung 411170, Taiwan; 4a734002@gm.student.ncut.edu.tw
                                          * Correspondence: wps@ncut.edu.tw or drwpsung@gmail.com; Tel.: +886-963-179-668

                                          Abstract: The outbreak of the new coronavirus pneumonia (Coronavirus disease 2019, COVID-19)
                                          created a serious impact on the lives of people around the world. Humans, affected by the COVID-19
                                          virus, must reduce related activities to suppress the spread of this disease. However, the pandemic
                                          had a positive impact on the environment due to reduced outdoor activities. The correlation between
                                          reduced human outdoor activities and health effects was investigated in this study through two
                                          Metropolitan parks in Taichung, Taiwan. The developed low-cost air quality sensors were installed
                                          in these two parks to detect the variances in PM2.5 concentrations during the epidemic outbreak.
                                          Experimental results indicated that PM2.5 concentrations in these two parks were reduced from
                                          about 23.25 and 22.96 µg/m3 to 8.19 and 8.48 µg/m3 , respectively, the median absolute deviations
                                          (MAD) decreased from 4.21 and 4.57 to 1.71 and 1.35, respectively after the epidemic outbreak,
                                          and the calculated standard deviation of all normal-to-normal interval (SDNN) and the ratio of
                                          low-frequency power to high-frequency (LF/HF) indicated that the drops of PM2.5 concentrations
                                          caused the increased health-related benefits by 73.53% with the variances being low. These results
                                showed that the PM2.5 concentrations displayed high correlations with human activities, which also

                                          played important roles in human health effects.
Citation: Sung, W.-P.; Liu, C.-H.
Effects of
                                          Keywords: air quality; metropolitan parks; arduino device; statistical analysis
COVID-19-Epidemic-Related
Changes in Human Behaviors on Air
Quality and Human Health in
Metropolitan Parks. Atmosphere 2022,
13, 276. https://doi.org/10.3390/
                                          1. Introduction
atmos13020276                                  In early years, humans burned dry branches and fallen leaves for heat and cooked
                                          food, which created air pollution. However, in those early years, the earth had enough
Received: 5 December 2021
Accepted: 4 February 2022
                                          green cover rate such that, through the earth’s self-purification function, these activities
Published: 7 February 2022
                                          would not cause environmental pollution problems. More recently, humans have con-
                                          sumed fossil fuels unconscionably to produce a large amount of carbon dioxide following
Publisher’s Note: MDPI stays neutral      the industrial revolution, resulting in a greenhouse effect. Therefore, the global warm-
with regard to jurisdictional claims in
                                          ing effect has become more serious, leading to an increase in the size of the hole in the
published maps and institutional affil-
                                          ozone layer and the phenomenon of acid rain. Similarly, large-scale tracts of land have
iations.
                                          been urbanized rapidly, leading to negative problems such as air pollution and environ-
                                          mental noise. Therefore, in recent years, climate anomalies, earth desertification, urban
                                          high temperature, and ozone layer destruction have become the norm, which not only
Copyright: © 2022 by the authors.
                                          threatens the survival of mankind, but also devastates the biodiversity of the environment
Licensee MDPI, Basel, Switzerland.
                                          in a unprecedented manner. In addition, with the expansion of cities, the anthropogenic
This article is an open access article    destruction of biological habitats has led to serious ecological imbalances. In particular,
distributed under the terms and           the permafrost on Earth is gradually unfrozen to release frozen virus and bacteria in the
conditions of the Creative Commons        permafrost, causing many emerging infectious diseases. Humanity has undergone five
Attribution (CC BY) license (https://     pandemics, which have changed human history and civilization. Notably, several difficult
creativecommons.org/licenses/by/          diseases have emerged in the last 20 years, such as Severe Acute Respiratory Syndrome
4.0/).                                    (SARS), Middle East Respiratory Syndrome (MERS), and the new coronavirus pneumonia

Atmosphere 2022, 13, 276. https://doi.org/10.3390/atmos13020276                                          https://www.mdpi.com/journal/atmosphere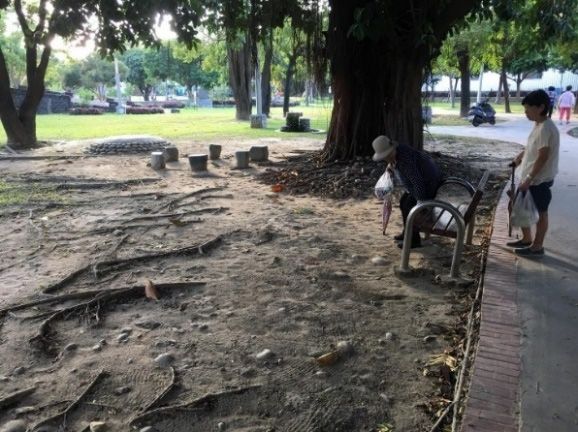
Atmosphere 2022, 13, 276                                                                                           2 of 19

                           (Coronavirus disease 2019, COVID-19). Since December 2019, Wuhan City, China has seen
                           unexplained symptoms of pneumonia, and initially thought that the cases were related
                           to the history of seafood market activities in south China [1]. Severe acute respiratory
                           syndrome coronavirus 2 (SARS-CoV-2) was detected from the environment during a public
                           health survey, and the world health organization (WHO) has not yet determined the source
                           on this infection. The COVID-19 outbreak has spread rapidly around the world because of
                           the frequent global exchanges for the global village. As of 24 October 2021, there were more
                           than 263 million confirmed patients worldwide, of which more than 5 million died, with an
                           average mortality rate of 2.34%, affecting 194 countries and regions around the world [2].
                                 The COVID-19 outbreak spread rapidly throughout the world, and the large number
                           of infected people has caused the health care system to be overburdened and even collapse.
                           To cope with the development on the epidemic, most countries have been offering to lock
                           up countries and seal cities in order to break the transmission chain, which has also caused
                           an economic impact. The first large-scale COVID-19 outbreak was in May 2021 in Taiwan.
                           An epidemic prevention alert was raised quickly from the first level, requiring masks at
                           all times when entering and leaving public places, to the third level, which required social
                           distancing of no more than five people indoors and ten people outdoors [3]. According
                           to the development of the epidemic, it should be upgraded to the fourth level epidemic
                           prevention standards, which is the lockdown of the city. Considering the daily life of the
                           people, Taiwan maintained a three-level alert until the epidemic gradually calmed down.
                           Therefore, this study investigated the correlation between people’s life and air quality
                           in metropolitan areas. Low-cost PM2.5 detectors were developed and installed in two
                           metropolitan parks, Dunha Park and 823 Memorial Park in Taichung City, Taiwan to detect
                           changes of PM2.5 concentration before the COVID-19 outbreak and until the epidemic
                           outbreak was gradually stabilized. These detected data were investigated to determine
                           the relationship between the decrease in people’s activities, air quality, and the impact on
                           human health by statistical analysis methods.
                                 Some studies have discussed the changes in epidemic conditions and changes in air
                           quality [4–7]. These results showed that air pollution was improved by reducing human
                           activity, including the reduction of automobile and locomotive transportation as well as
                           reducing oil fumes in the catering trade. Further, high quantities of air pollution can
                           lead to serious lung disease. Otherwise, long-term air pollution can cause additional
                           complications with COVID-19 infection. These studies also showed the influence of PM2.5
                           concentrations on health [8–10], illustrating that exposure to high concentrations of airborne
                           particulates PM10 and PM2.5 could increase mortality and reduce life expectancy. Exposure
                           could also cause damage to the cardiovascular, respiratory, and reproductive systems,
                           which was also associated with diabetes, and can even cause cancer and affect the central
                           nervous system. The deviations of the standard deviation of all normal-to-normal intervals
                           (SDNN) and the ratio of low-frequency power to high-frequency (LF/HF) could be used
                           to determine the extent of the impacts. The heart rate variability (HRV) often uses SDNN
                           as the basis for analysis. The standard deviation of the normal heartbeat spacing of
                           24 h is usually calculated, that is, the method of measuring the degree of change in the
                           continuous heartbeat rate. The R waves in the electrocardiogram are commonly used to
                           calculate the SDNN by measuring the time interval between R waves, which becomes a
                           set of sequences, and then further calculation and analysis. LF/HF acts as an indicator
                           of the Sympathetic and Parasympathetic balance. It mainly represents the regulation on
                           the heart by the sympathetic nerve. It is related to cardiac autonomic neuromodulation
                           function, peripheral vasoconstriction resistance, renin-angiotensin-aldosterone system
                           (RAAS) activity, thermoregulation, and hormones. The research achievements of World
                           Health Organization (WHO) [11] showed that air pollution was strongly associated with
                           acute respiratory infections and chronic obstructive pulmonary disease (COPD), as well as
                           cardiovascular disease and cancer. So far, the best way to improve air quality, especially
                           PM2.5 concentration, is to control emissions from local sources [12–16]. Therefore, this study
                           explored the changes in the COVID-19 outbreak and the epidemic control measures for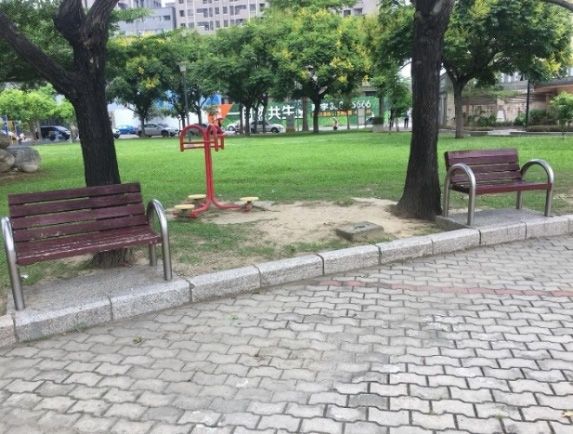
Atmosphere 2022, 13, 276                                                                                            3 of 19

                           people to reduce outdoor activities with PM2.5 concentration. The effects on decreasing the
                           SDNN and increasing LF/HF [17] were quoted to discuss the health effect of a reduction of
                           PM2.5 concentration and investigate the health correlation between changes in the epidemic
                           outbreak and human outdoor activities through the variance of PM2.5 concentration.

                           2. Methodology
                                 Two metropolitan parks in the Taichung Metropolitan Area were selected as research
                           sites in this study. The reasons were that large numbers of people lived around these parks
                           and many vehicles come in and out frequently. There are also many famous restaurants in
                           this area that emit cooking fumes. Furthermore, the Taichung Power Plant is the fourth
                           largest coal-fired power station in the world, located in the west of Taichung city [18].
                           These factors affect the air quality around this area and must be observed for a long time.
                           Therefore, a low-cost air detection device was developed using Arduino technology, which
                           was then used to detect the PM2.5 concentration variation in the experimental fields. To
                           verify the measurement accuracy on this developed air detector and the detected data
                           before and after the outbreak epidemic, a statistical method was applied to analyze the
                           detection benefits and the PM2.5 concentration variance, respectively, in this study. The
                           relevant statistical formulas are discussed below.

                           2.1. The Accuracy Analysis for the Developed Air Detector
                                The determination coefficient R-square is used to investigate the accuracy of the
                           developed air detector to compare the detected PM2.5 concentration variation between
                           those of the developed air detector and the high-accuracy air detector. Therefore, the
                           determination coefficient R-square is expressed as follows:
                                                                          2                  2
                                                               ∑ (ŷ − y)         ∑ (y − ŷ)
                                                        R2 =              2
                                                                            = 1 −            2
                                                                                                                       (1)
                                                               ∑ (y − y)          ∑ (y − y)

                           where,
                                         2
                               ∑ (y − ŷ) = ∑ y2 − (b0 ∑ y + b1 ∑ x1 y + b2 ∑ x2 y + . . . + bk ∑ xk y), define the sum of
                           squares for error.
                               Next, Equation (2) can be defined as the sum of squares for total, as follows:

                                                                                  1      2
                                                          ∑ ( y − y )2 = ∑ y2 − n ∑ y                                  (2)

                                Finally, Equation (3) is defined as the sum of squares for regression as follows:

                                                                     ∑(ŷ − y)2                                        (3)

                           2.1.1. Adjusted the R Squared Value
                                This study explored the differences between the detection data of these two instru-
                           ments, focusing on exploring the detection accuracy of the developed low-cost air detector.
                           Since R squared is overestimated due to the addition of independent variables, the R
                           squared value was adjusted in this study, and the formula for adjusting R squared is
                           expressed as follows:
                                                                          n−1
                                                        R2 = 1 − 1 − R2                                           (4)
                                                                            ( n − k − 1)
                           where,
                               n represents the number of arguments;
                               k is the number of groups.

                           2.1.2. Standard Estimation Error
                               In this study, y is the standard error between the experimental value of the developed
                           device and the detected value of the high-accuracy device to explore the detected accu-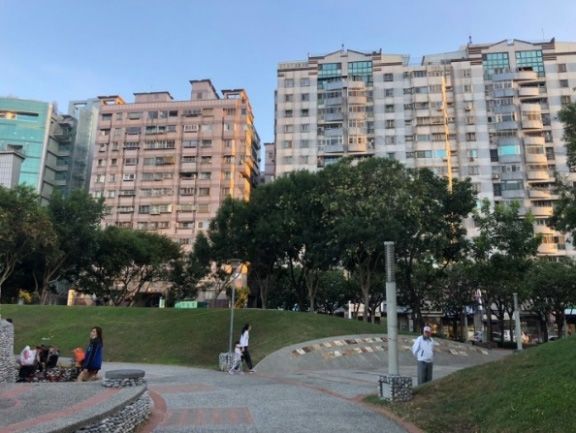
Atmosphere 2022, 13, 276                                                                                        4 of 19

                           racy of the developed device. Therefore, the estimated standard error can be calculated
                           as follows:                            s
                                                                                 2
                                                                      ∑ (y − ŷ)
                                                             Sy =                                               (5)
                                                                      n−k−1
                           where,
                                      S
                               vk = yy is the Coefficient of Variation;
                               k is the number of experimental groups in the multiple regression equation;
                               n is the number of times experimental data were captured per experiment.

                           2.1.3. F-Test
                                The F-test is used to investigate the accuracy of this developed device in order to
                           find the linear relationship between the regression equation of the detected values of the
                           developed device and the high-accuracy device. The formula of the F-test is expressed
                           as follows:
                                                             (ŷ−y)2
                                                           ∑ k                   R2 /k
                                                      F=            2 =                                            (6)
                                                             (y−ŷ)     (1 − R2 ) / ( n − k − 1)
                                                           ∑ n − k −1

                           2.2. Statistical Method
                               The detected data were recorded every thirty minutes, and the daily correlation data
                           were calculated to obtain the mean, standard deviation (SD), Coefficient of Variation (CV),
                           Mean Deviation (MD), Interquartile Range (IQR), Quartile Deviation (QD), and median
                           absolute deviation (MAD) by the statistical method, as listed below:
                               Mean
                                                                         n
                                                                            x
                                                                   x=∑ i                                           (7)
                                                                       i =1
                                                                            n
                                Standard Deviation (SD)
                                                                    s
                                                                                 n
                                                                         1
                                                             SD =
                                                                         n   ∑ ( x i − x )2                        (8)
                                                                             i =1

                                Coefficient of variation
                                                                                     SD
                                                                    CV =                                           (9)
                                                                                      x
                                Mean Deviation (MD)
                                                                        ∑in=1 | xi − x |
                                                              MD =                                                (10)
                                                                               n
                                Interquartile (IQR)
                                                                  IQR = Q3 − Q1                                   (11)
                           where,
                               Q3 is the third quartile;
                               Q1 is the first quartile.
                               Quartile Deviation (QD)

                                                                  1      1
                                                           QD =     IQR = ( Q3 − Q1 )                             (12)
                                                                  2      2
                                Median absolute Deviation (MAD)
                                                                             1
                                                                     1
                                                             MAD =
                                                                     n   ∑|xi − m(X )|                            (13)
                                                                             2

                           where,
                               m( X ) is the median value.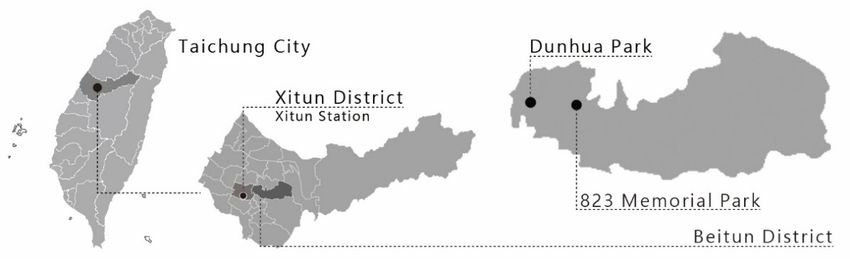
Atmosphere 2022, 13, 276 5 of 19
2.3. Reduction Effect
The PM2.5 concentrations were measured as indicator pollutants. Next, when PM2.5
exposures were 12.6 ± 8.9 µg/m3 , the standard deviations of all normal-to-normal (SDNN)
intervals reduced by 3.68%, and the ratios of low-frequency power to high-frequency
(LF/HF) power increased by 3.86% under a 95% confidence level [17]. The statistical
characteristics of PM2.5 concentration is the smaller-the-best statistical characteristics. The
inverted normal loss function (INLF) and modified loss function (MINLF) for the Taguchi
one side Quadratic loss function and step loss function, proposed by Pan et al. (2007) [19],
were quoted and modified in this study. The relationship between the derived step loss
function and the SDNN and LF/HF indicators is established to reflect any improvements
regarding potential human risk and health losses with the epidemic-related changes in
PM2.5 based on the smaller-the-best statistical characteristics [20].
When the product quality characteristic value deviates from the target value, there
will be a loss, and the further away from the target value, the greater the loss. When the
quality characteristic is small, the target value is zero, and the mathematical model of the
Quadratic loss function can therefore be written as:
L(y) = ky2 , y ≥ 0 (14)
where,
y represents the quality characteristics of product;
k is the constant value of quality loss function.
The INLF was proposed to describe product quality loss with a properly transformed
normal probability density function by Spiring (1993) [21]. In reality, the quality charac-
teristics of the PM2.5 concentration is the-small-the-best. Therefore, Equation (14) can be
rewritten as follows:
− y2
L(y) = k 1 − exp ,y ≥ 0 (15)
2σL 2
where,
y represents the air quality characteristics of the PM2.5 concentration;
k is the constant value of the quality loss function;
σL is the shape parameter of the adjustment loss function.
σL = ∆/4 was suggested by Spiring (1993) [20] and used in this study, where ∆
represents the maximum values of SDNN and LF/HF at various stages. The Revised
Inverted Normal Loss Function (RINLF), proposed by Pan and Wang (2000) [22], is quoted
and modified to define this RINLF with the smaller-the-best based on the detected PM2.5
concentration, as follows:
0 , i f 0≤ y < U
L(y) = −(y−U )2 ,if y > U (16)
k 1 − exp 2 · σ 2
L
where,
U is the upper bound with air quality characteristics of PM2.5 concentration that
deviated from the target value of zero.
The different PM2.5 concentrations have different influence degrees on SDNN and
LF/HF [17]. Therefore, the effect of PM2.5 concentration on health belongs to the step
loss function. The step loss function is quoted to modify and define that the effects of
PM2.5 pollution on physical health characteristics obey the normal distribution on PM2.5
concentration. PM2.5 concentration obeys the normal distribution. Thus, the loss function
of the step loss function can reflect the actual effect of PM2.5 concentration on SDNN and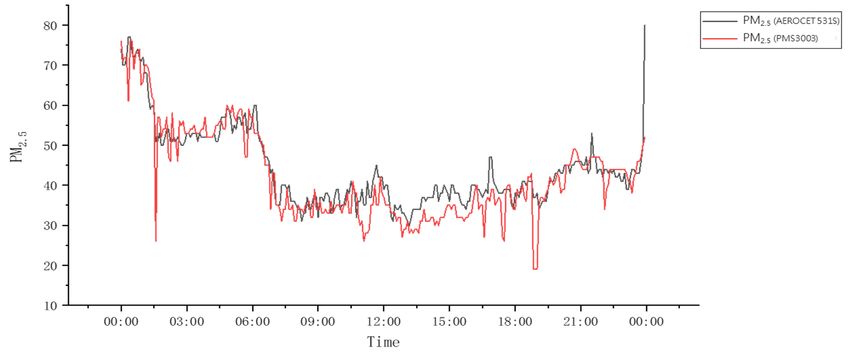
Atmosphere 2022, 13, 276 6 of 19
LF/HF. The mathematical model with the smaller-the best quality characteristics of PM2.5
concentration is expressed as follows:
L1 0 ≤ y < m1 USL
m1 USL ≤ y < m2 USL
L2
L3 m2 USL ≤ y < m3 USL
·
Lstep(y) = (17)
·
·
mk−2 USL ≤ y < mk−1 USL
L k −1
Lk y > mk−1 USL
3. Materials and Experimental Fields
3.1. The Developed Test Devices
The PM2.5 detector developed in this study was a low-cost and high-precision air dust
sensor with Ardino single-chip technology, which is used to measure air quality changes for
a long time and investigate the impact of epidemic-outbreak-related changes on air quality
in cities and parks. The Panto PMS3003 air dust sensor [23] was used in this developed
device to detect the PM2.5 concentration. The PMS3003 was a digital universal particle
concentration sensor, which can obtain suspended particles in the air, i.e., the concentration
of particles, and output these data as a digital interface. The laser scattering principle
is used to measure the data of PM1.0 , PM2.5 , and PM10 with the light wavelength being
650 nm [24]. The power supply for the PMS3003 should be stable to meet the need for long,
outdoor data collection. Therefore, the NP7-14 battery is used as the power supply for
the PMS3003, not the Arduino UNO supply, and a Negative Booster is applied to buck it
to 5 V and 7 V to ensure that data recordings are stable. The data recorder was recorded
through the XD-204 SD card module, and the data was then transmitted to the computer.
These detector devices include Arduino Uno (Development), PMS3003 (Air Dust Sensor),
and XD-204 Data Logging (Data Recorder, SD Card Reading and Writing Module and RTC 7 of 20
Atmosphere 2022, 13, x FOR PEER REVIEW
Clock Module). The hardware circuit of this developed aerosol sensing system is shown in
Figure 1.
Power Supply (NP7-14, 12V14Ah)
Negative
XD-204 (SD card)
Booster
Power Supply(5V) Power Supply(7V)
Data
Transmission
PMS3003
Arduino Personal
UNO Computer
RXD/TXD (3.3V) Sending data (PC)
The hardware
Figure1.1.The
Figure hardware circuit
circuitofofthe developed
the aerosol
developed sensing
aerosol system.
sensing system.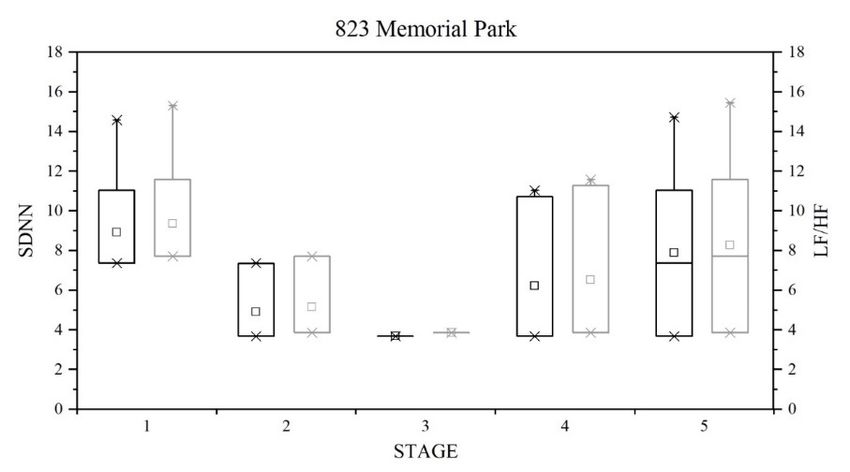
area, where the population north of Beitun in Taichung has grown rapidly due to eco-
nomic activity and the gradual implementation of many major municipal construction
projects. Air Quality in Taichung Region is mainly influenced by Region (Sea and
Land
Atmosphere 2022, Location,
13, 276 Latitude and Longitude, etc.), Regional Climate, Microclimate (Mi- 7 of 19
croclimate, including thermal convection, turbulence, flow, temperature, humid-
ity, wind direction, wind speed, etc.), traffic conditions, emission characteristics of
3.2. Experimental Fields
industrial pollution sources, and diffusion conditions [25]. In particular, the indus-
Recently, a large number of people with densely populated motor vehicle emissions
trial-intensive region, including the precision tool machine industry, central science park,
are moving into Taichung city. Most of the population is concentrated in the metropolitan
and energy-intensive manufacturing
area, where the population industry,
north of are around
Beitun this has
in Taichung research area. In
grown rapidly dueaddition,
to economic
Taichung City is in activity
the basin and terrain,
the gradual as implementation
long as the east windmajor
of many is blowing
municipal inconstruction
the centralprojects.city.
Air Quality in Taichung Region is mainly influenced by Region (Sea and Land Location,
It is not easy for air to diffuse, causing a serious haze phenomenon. Therefore, this study
Latitude and Longitude, etc.), Regional Climate, Microclimate (Microclimate, including
selected two urban thermal
parks in the newly
convection, developed
turbulence, area of Beitun
flow, temperature, District
humidity, windof Taichung
direction, windCity speed,
as the targets: (1) Dunhua Park; (2) 823 Memorial Park as the experimental field. The
etc.), traffic conditions, emission characteristics of industrial pollution sources, and diffusion Xitun
Survey Station of the conditions
Central [25].Meteorological
In particular, the industrial-intensive
Administration,region, including
Taichung, the precision
Taiwan is the tool
machine industry, central science park, and energy-intensive manufacturing industry, are
closest station to these two experimental parks. The climatological data and air quality
around this research area. In addition, Taichung City is in the basin terrain, as long as the
data on the monitoring Station
east wind were in
is blowing used as thecity.
the central basic
It isdata for for
not easy thisairregion to carry
to diffuse, causingout the
a serious
numerical comparison of PM2.5 suspended
haze phenomenon. Therefore, this particulates
study selecteddetected
two urbanfrom parks inthese twodeveloped
the newly parks.
area of Beitun District of Taichung City as the targets:
Dunhua Park, with water features, a large area of green lawn, and an ecological, green, (1) Dunhua Park; (2) 823 Memorial
Park as the experimental field. The Xitun Survey Station of the Central Meteorological
and leisure-oriented focus, is a public
Administration, construction
Taichung, Taiwan is thethrough cross-neighborhood
closest station to these two experimental coopera- parks.
tion and citizenship Theparticipation,
climatological data shownand air inquality
Figure 2. on
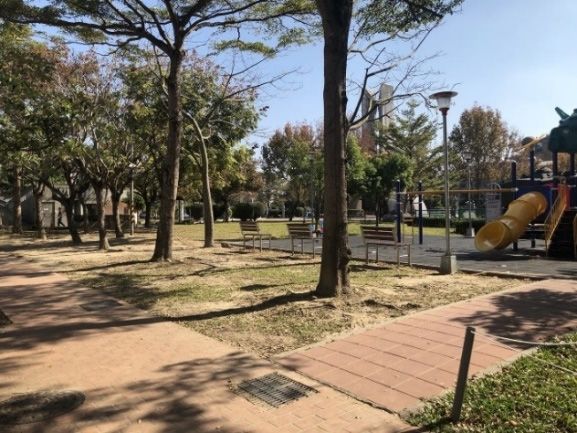
data 823
theMemorial Park iswere
monitoring Station oneused of asthe the
parks in Taichung.basic data for this region organizations
Non-governmental to carry out the numerical
adopted comparison
their public of PM 2.5 suspended
open spaces
and public facilities,particulates
shown indetected Figurefrom3. Thethese two parks. Dunhua Park, with water features, a large area
research results showed that the concentration
of green lawn, and an ecological, green, and leisure-oriented focus, is a public construction
and distribution ofthrough
PM2.5 in this study area
cross-neighborhood were mainly
cooperation affectedparticipation,
and citizenship by wind speed shown in and di- 2.
Figure
rection. In summer,823 theMemorial
wind direction
Park is one isofeast-west,
the parks in and as the Non-governmental
Taichung. wind speed rises, the con-
organizations
centration of PM2.5 adopted
in the air theirdecreases
public openalmost
spaces and public facilities, In
synchronously. shown in Figure
addition, the3. study
The researchre-
results showed that the concentration and distribution of PM2.5 in this study area were
sults have shown that the PM2.5 concentration and other air pollutants has a synchronous
mainly affected by wind speed and direction. In summer, the wind direction is east-
upward trend beginning west, and at as
6:00the a.m., and itrises,
wind speed hasthedecreased
concentrationuntil the2.5early
of PM in themorning,
air decreases which
almost
shows that PM2.5 concentration is closely related to people’s work and rest.
synchronously. In addition, the study results have shown that the PM 2.5 Sources of
concentration and
other air pollutants has a synchronous upward trend
pollution from both gasoline and diesel vehicles as well as industries may need to be ef- beginning at 6:00 a.m., and it has
decreased until the early morning, which shows that PM2.5 concentration is closely related
fectively managed [26,27].
to people’s The worktwo andparks are located
rest. Sources in thefrom
of pollution newlybothdeveloped
gasoline andmetropolitan
diesel vehicles as
area with well-functioning living may
well as industries facilities
need toand many residents,
be effectively which
managed [26,27]. are
The two close
parksto arethe Tai-in
located
chung Science Park. Therefore, this study selected two of the most representative parksmany
the newly developed metropolitan area with well-functioning living facilities and in
residents, which are close to the Taichung Science Park. Therefore, this study selected two
this area as research areas.
of the most representative parks in this area as research areas.
The experimental
Figure 2. field
Figure 2. The experimental field of metropolitan
of metropolitan parks atparks
the atnorth
the north
of of Beitun District,
Beitun District, Taichung, Taiwan.
Taichung,
Taiwan.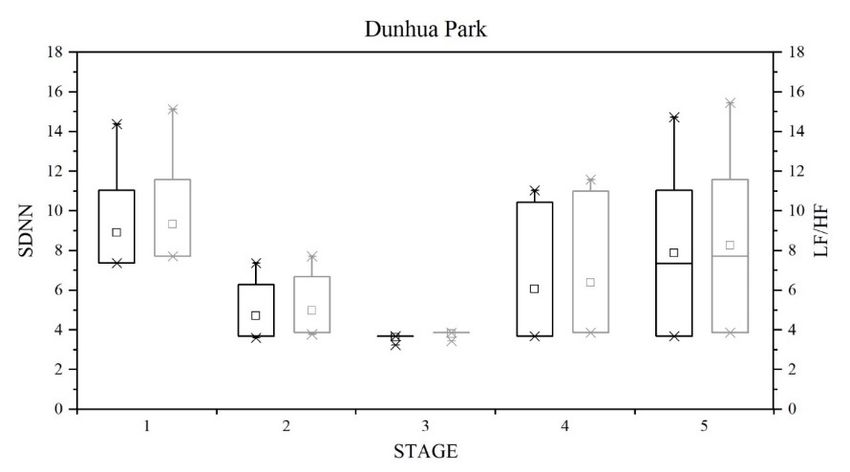
Atmosphere 2022,
Atmosphere 2022, 13,
13, 276
x FOR PEER REVIEW 98 of 20
of 19
(a)
(b)
Figure 3. Photos of the (a) Dunhua park and (b) 823 Memorial park at the north of Beitun District,
Figure 3. Photos of the (a) Dunhua park and (b) 823 Memorial park at the north of Beitun District,
Taichung, Taiwan.
Taichung, Taiwan.
4. Test
4. Test Results
Results and
and Discussion
Discussion
4.1. The Accuracy of the Developed Device
The developed
developeddevicedeviceisisa alow-cost,
low-cost, experimental
experimental sensor with
sensor a PMS3003
with a PMS3003aerosol sen-
aerosol
sor. To To
sensor. ensure
ensure thethe
precision
precision ofofthis
thisdeveloped
developeddevice,
device,the
thedata
datacollection
collection results
results of the
PMS3003 aerosol sensor developed in this study were verified numerically with the high- high-
accuracy AEROCET 531S portable dust meter. meter. TheThe recorded
recorded PM PM2.5
2.5 data of the PMS3003
PMS3003
were
were compared
compared withwith the
the detected
detected results
results of AEROCET 531S. The compared results, shown
in Figure 4 and Table 1, display that the R-square reached to 0.84 and R reached to 0.92,
1, display
which indicates aa good
good detection
detectioneffect.
effect.The
Thestandard
standard estimation
estimation error
error and
and variance
variance of
of R-
R-squared
squared was was
4.574.57
andand 0.84,
0.84, respectively.
respectively. Furthermore,
Furthermore, the variance
the variance of significance
of significance F is
F is very
very
small.small. Therefore,
Therefore, the data
the data obtained
obtained by this
by this developed
developed device,
device, are highly
are highly reliable
reliable for
for the
the follow-up
follow-up analysis.
analysis.
The developed PM2.5 detectors with Arduino technology were installed in the two
metropolitan parks to detect
Table 1. The statistical the variance
comparison of PM2.5
of test results forconcentration
the PMS3003 during
and thethe experimental
AEROCET 531S. period.
Standard Estima- Variance ofVariance of Variance of Sig-
R R2 Adjusted R2
tion Error R2 F nificanc F
0.92 0.84 0.84 4.57 0.84 1527.53 0.00Atmosphere 2022,
Atmosphere 13, x276
2022, 13, FOR PEER REVIEW 10 9ofof20
19
Figure
Figure4.4.The
Theexperimental
experimentaldata
datacomparison
comparisonof
ofthe
thePMS3003
PMS3003aerosol
aerosolsensor
sensorwith
withthe
theAEROCET
AEROCET531S
531S
portable
portable dust
dust meter.
meter.
TableThe developed
1. The statistical PM 2.5 detectors
comparison of testwith Arduino
results technology
for the PMS3003 and were installed531S.
the AEROCET in the two
metropolitan parks to detect the variance of PM2.5 concentration during the experimental
R R2 Adjusted R2 period.
Standard Estimation Error Variance of R2 Variance of F Variance of Significanc F
0.92 0.84 0.84 4.57 0.84 1527.53 0.00
4.2. Analysis Results for the Detected Data
The test period was from April to August 2021, encompassing the time before the
4.2. Analysis Results for the Detected Data
epidemic outbreak to the date of the epidemic gradually stabilized. This test period was
Theinto
divided testpre-epidemic
period was from April according
outbreaks to August to2021, encompassing
the changes the time before
in the epidemic, the
with the
epidemic outbreak to the date of the epidemic gradually stabilized. This test
number of people diagnosed each day being more than 300 people defined as the plateau period was
divided
period into pre-epidemic
(number A), more thanoutbreaks according
100 people to the changes
to 300 people in the
defined as the plain
epidemic, with
period the
(num-
number of people diagnosed each day being more than 300 people defined as the plateau
ber B), more than 30 people to 100 people defined as the decline period (number C), and
period (number A), more than 100 people to 300 people defined as the plain period (number
less than 30 people defined as the stabilization period (number D). The daily confirmed
B), more than 30 people to 100 people defined as the decline period (number C), and less
cases data came from the Taiwan Central Epidemic Command Center [28].
than 30 people defined as the stabilization period (number D). The daily confirmed cases
data came from the Taiwan Central Epidemic Command Center [28].
4.2.1. Meteorological Data
4.2.1.The PM2.5 concentrations
Meteorological Data at the Xitun Station in Taichung City of the Central Meteor-
ological
TheAdministration
PM2.5 concentrations were usedat theasXitun
the baseline
Station induring
Taichungthe City
detection
of the period.
Central The
Me-
changes of PM 2.5 concentration, inspected at this station during the test phase, are shown
teorological Administration were used as the baseline during the detection period. The
in Figureof
changes 5. PM
Since concentration,
PM2.5 concentration is susceptible
inspected to weather
at this station during factors, the basic
the test phase, areclimate
shown
2.5
data of the experimental stage, shown in Figures 6–8, are temperature
in Figure 5. Since PM2.5 concentration is susceptible to weather factors, the basic changes, east-west
climate
wind
data ofspeed, relative humidity,
the experimental and rainfall.
stage, shown This6–8,
in Figures study
are only listed the
temperature east-west
changes, wind
east-west
speed changerelative
wind speed, figureshumidity,
in this testand
area because
rainfall. thestudy
This PM2.5only
concentration in this region
listed the east-west windisspeed
sus-
ceptible to easterly
change figures winds.
in this testFurthermore,
area because rainfall
the PMhas2.5
some improvement
concentration in this benefits
region for
is PM
suscep-
2.5
concentration
tible to easterly [26,27].
winds.Thus, the change rainfall
Furthermore, of PM2.5 has
concentration affected bybenefits
some improvement rainfall for
werePMnot
2.5
used as the basis
concentration for subsequent
[26,27]. Thus, the analyses
change ofofPM health impacts. The affected
2.5 concentration other databy of PM2.5 were
rainfall con-
centration
not used as change
the basisperfordaysubsequent
were recorded exactly
analyses to analyze
of health the correlation
impacts. between
The other data of PMthe
2.5
change of PM2.5change
concentration concentration
per day and
wereSDNN andexactly
recorded LF/HF.to analyze the correlation between the
change of PM2.5 concentration and SDNN and LF/HF.
4.2.2. Relationship between Changes in Epidemic Outbreaks and PM2.5
Concentrations Variation
The correlation between changes in epidemic outbreaks and PM2.5 concentration
variation is shown in Figure 9. The left y axis in the figure was the number of diagnoses, and
the right y axis was PM2.5 concentration (units: µg/m3 ). From the relationship between the
number of diagnoses and the PM2.5 concentration, it can be seen that the air quality of PM2.5
concentration was high before the epidemic outbreaks with high variation. With the increase
of the number of diagnoses, the air quality of PM2.5 concentration gradually decreased,Atmosphere 2022, 13, 276 10 of 19
and, in the plateau period and plain period, showed a downward trend. However, with
the gradual decline in the number of diagnoses, as the epidemic entered a period of decline
Atmosphere 2022, 13, x FOR PEER REVIEW 11 of This
and stabilization, the PM2.5 concentration and the variance gradually increased. 20 figure
Atmosphere 2022, 13, x FOR PEER REVIEW
Atmosphere 2022, 13, x FOR PEER REVIEW 11
11 of
of 20
20
displayed that the PM2.5 concentration varied with the epidemic outbreak changes.
PMPM2.5 - Xitun Station
60 2.5--Xitun
PM2.5 XitunStation
Station
60
60
55 PM2.5
55 PM2.5
PM2.5
55
50
50
50
45
45
45
40
40
PM2.5 (μg/m3)
40
(μg/m33))
35
2.5(μg/m
35
35
30
30
30
25
PM2.5
25
25
PM
20 20
20
15 15
15
10 10
10
55 5
00 0
15 15 16 17 18 19 20 21 22 23 24 25 26 27 28 29 30 31 32 33 34 35
15 16
16 17
17 18
18 19
19 20
20 21
21 22
22 23
23 24
24 25
25 26
26 27
27 28
28 29
29 30
30 31
31 32
32 33
33 34
34 35
35
Week
Week
Week
Figure
Figure 5.
5.5. TheThe change
change
The of of
of PM
change PM
of 2.5 concentration
concentration
2.5PM at at
thethe
at the atXitun
Xitun station
station in in Taichung
Taichung City
inCity of of the
of the Central
Central
Figure
Figure 5.
The change PM 2.5
2.5 concentration
concentration the
Xitun Xitun
station instation
Taichung Taichung
City the City of the Central
Central
Meteorological
Meteorological
Meteorological Administration.
Administration.
Administration.
Meteorological Administration.
Temperature
Temperature
Temperature - Xitun
--Xitun
Xitun Station
Station
Station
40 40
40
Temp.
Temp.
Temp.
35 35
35
30 30
Temp.(°C)
30
Temp.(°C)
Temp.(°C)
25 25
25
20 20
20
15 15
15
1414 1415 15
15 16 16
16 17 17
17 18 18
18 19 19
19 20 20
20 21 21
21 22 22
22 23 23
23 24 24
24 25 25
25 26 26
26 27 27
27 28 28
28 29 29
29 30 30
30 31 31
31 32 32
32 33 33
33 34 34
34 35 36 36
35 35
36
Week
Week
Week
Figure
Figure
Figure 6.6.The
6.
Thetemperature
The
temperature variation
temperaturevariation at
variationatthe
at
the Xitun
the station
Xitun
Xitun in
inTaichung
station
station in City
Taichung
Taichung of
City
City of the Central
of the
the Meteoro-
Central
Central Meteoro-
Meteoro-
Figure 6. The temperature variation at the Xitun station in Taichung City of the Central Meteorological
logical
logicalAdministration.
logical Administration.
Administration.
Administration.
Wind
Wind Speed
Wind
Speed --Xitun
Speed Station
- Xitun
Xitun Station
Station
99 9
W.S.
W.S.W.S.
88 8
77 7
66 6
(m/s)
W.S. (m/s)
W.S.(m/s)
55 5
W.S.
44 4
33 3
22 2
11 1
00 0
15 16
15 15 17
16 16 18
17 17 19
18 18 20
19 19 21
20 20 22
21 21 23
22 22 24
23 23 25
24 24 26
25 25 27
26 26 28
27 27 29
28 28 30
29 29 31
30 30 32
31 31 33
32 32 34
34 35
33 33 35 35
34
Week
Week
Week
Figure
Figure 7.7.The
Figure
Figure The
7.
7. east-west
Theeast-west
The wind
wind
east-west
east-west speed
windspeed variation
speed
wind variation at
variation
speed atthe
at
variation Xitun
thethe
Xitun station
station
atXitun
the in
station
Xitun Taichung
instation
in inCity
Taichung City
Taichung of
ofthe
City
Taichung the Central
Central
of the Central
City of the Central
Meteorological
Meteorological Administration.
Administration.
Meteorological Administration.
Meteorological Administration.Precp. (m
R.H. (%
70
100
60
50
x FOR PEER REVIEW50
Atmosphere 2022, 13, 276 1211of
of 20
19
40
0
14 15 16 17Relative
18 19 20Humidity
21 22 23and
24 Precipitation - Xitun
25 26 27 28 29 30 31Station
32 33 34 35 36
100 Week 200
R.H.
Figure 8. The relative humidity and rainfall variation at the Xitun station in Taichung
Precp.
City of the
90 Meteorological Administration.
Central
150
4.2.2. 80
Relationship between Changes in Epidemic Outbreaks and PM2.5
Precp. (mm)
Concentrations Variation
R.H. (%)
70
The correlation between changes in epidemic outbreaks and PM2.5 concentration 100 var-
iation is shown in Figure 9. The left y axis in the figure was the number of diagnoses, and
60
the right y axis was PM2.5 concentration (units: μg/m3). From the relationship between the
number of diagnoses and the PM2.5 concentration, it can be seen that the air quality 50 of
50
PM2.5 concentration was high before the epidemic outbreaks with high variation. With the
increase
40
of the number of diagnoses, the air quality of PM2.5 concentration gradually de-
creased, and, in the plateau period and plain period, showed a downward trend. 0
How-
14 15 16 17 18 19 20 21 22 23 24 25 26 27 28 29 30 31 32 33 34
ever, with the gradual decline in the number of diagnoses, as the epidemic entered a pe- 35 36
riod of decline and stabilization, the PM2.5Week concentration and the variance gradually in-
Figure
Figure 8.
creased. The
The relative
8.This figure humidity
humidity and
relativedisplayed thatrainfall
and the PM
rainfall variation at
at the
the Xitun
2.5 concentration
variation station
varied
Xitun in
in Taichung
with
station City
City of
the epidemic
Taichung the
out-
of the
Central
break Meteorological
changes. Administration.
Central Meteorological Administration.
4.2.2. Relationship between NumberChanges in Epidemic
of Confirmed Outbreaks
COVID-19 and PM2.5
and PM2.5
Concentrations
800 Variation
Before the Epidemic A B C D
70
A period - Count > 300
700
The correlation between changes in epidemic outbreaks and PM
B period 2.5> concentration
- 300 Count > 100 var-
60
iation is shown in Figure 9. The left y axis in the figure was theC period
number - 100 > Count > 30
of diagnoses, and
D period - 30 > Count
the600
right y axis was PM2.5 concentration (units: μg/m3). From the relationship between 50
the
number
500
of diagnoses and the PM 2.5 concentration, it can be seen that the air quality of
PM2.5 concentration was high before the epidemic outbreaks with high variation. With 40 the
PM2.5
Count
increase
400 of the number of diagnoses, the air quality of PM2.5 concentration gradually de-
creased, and, in the plateau period and plain period, showed a downward trend. 30 How-
300
ever, with the gradual decline in the number of diagnoses, as the epidemic entered a pe-
20
riod200of decline and stabilization, the PM2.5 concentration and the variance gradually in-
creased. This figure displayed that the PM2.5 concentration varied with the epidemic 10
out-
100
break changes.
30
0 0
14 15 16 17 18 Number
19 20 21of 22
Confirmed
23 24 25 COVID-19 and30PM2.5
26 27 28 29 31 32 33 34 35 36
800 Week 70
Before the Epidemic A B C D A period - Count > 300
Figure
Figure
700
9.9.The
Therelationship
relationshipbetween
betweenepidemic
epidemicchanges
changesand
andthe
thevariation
variation of
ofPM
B periodPM
- 300 > concentration.
2.5
2.5 concentration.
Count > 100
C period - 100 > Count > 30 60
4.3.Statistical
4.3. StatisticalAnalysis,
600
Analysis,Results,
Results,and
andDiscussion
Discussion D period - 30 > Count
50
The value of PM concentration
The value of PM2.52.5concentration varies variesgreatly
greatlyand
andisisaffected
affectedby
bymany
manyuncertain
uncertain
500
factors. Therefore,
factors. Therefore, according
according to to the
the requirements
requirements ofofstatistical
statisticalanalysis
analysisforfor
sampling
sampling
40
al-
PM2.5
Count
location,
400 these detected data of PM2.5 concentration looked for the expected value and
variation of the median statistic within the population. These detected data were discussed 30
300
according to the sufficient, unbiased, efficiency, and consistency statistic of point estimates.
The200box and whisker plot, which was available based on the relevant data obtained, 20 is
shown in Figure 10. Figure 10 shows that the variation of PM2.5 concentration before the
epidemic
100 outbreak (before week 19) was known to be significant and was mainly10related
to human
30 activities. However, as the epidemic outbreak increased during the plateau
0 0
(week 20–week
14 15 16 23), the19change
17 18 20 21 in
22PM 24 concentration
23 2.5 25 26 27 28 decreased
29 30 31 32gradually.
33 34 35 In36 particular,
when the epidemic period entered into the Weekplains stage (week 24–week 26), people were
used to staying at home, so the PM2.5 change was gradually narrowing. However, as the
Figure 9. The relationship between epidemic changes and the variation of PM2.5 concentration.
epidemic outbreak slowed down (week 26–week 30), the daily number of people diagnosed
with new coronary
4.3. Statistical pneumonia
Analysis, wasDiscussion
Results, and maintained at 80–100 people/day at the beginning of
this period, and the PM2.5 concentration was still low with little variation. This trend may
be theThe value
result of of
thePM 2.5 concentration varies greatly and is affected by many uncertain
epidemic being on a three-level alert, so residents had low levels of
factors. Therefore, according to the requirements of statistical analysis for samplingthe plateau (week 20–week 23), the change in PM2.5 concentration decreased gradually. In
particular, when the epidemic period entered into the plains stage (week 24–week 26),
people were used to staying at home, so the PM2.5 change was gradually narrowing. How-
ever, as the epidemic outbreak slowed down (week 26–week 30), the daily number of peo-
Atmosphere 2022, 13, 276 ple diagnosed with new coronary pneumonia was maintained at 80–100 people/day at 12 the
of 19
beginning of this period, and the PM2.5 concentration was still low with little variation.
This trend may be the result of the epidemic being on a three-level alert, so residents had
low levelsactivity.
outdoor of outdoor activity.
However, withHowever,
the numberwithofthe number decreasing,
diagnoses of diagnoses decreasing,
and the numberandof
the number of people diagnosed with new coronary pneumonia being down
people diagnosed with new coronary pneumonia being down to below 30 cases per day to below 30
cases per day in week 30, the outbreak was expected to be reduced to the second-level
in week 30, the outbreak was expected to be reduced to the second-level alert. Residents
alert. Residents
started started
to get back to get back
to outdoor to outdoor
activities activities
gradually, gradually,
and the and the PM2.5started
PM2.5 concentrations concen-to
trations started to rise and the variations
rise and the variations in PM increased. in PM 2.5 increased.
2.5
PM2.5
60
25%~75%
1.5IQR
50
Median
× Outlier
40
PM2.5 (µg/m3)
30
20
10
0
14 15 16 17 18 19 20 21 22 23 24 25 26 27 28 29 30 31 32 33 34 35 36
Week
Figure
Figure10.
10.The
Thebox
boxand
andwhisker
whiskerplot
plotof
ofthe
thevariation
variationof
of PM
PM2.5 concentration at different epidemic
2.5 concentration at different epidemic
outbreak stages.
outbreak stages.
4.3.1.
4.3.1.The
TheRelationship
Relationshipbetween
betweenDifferent
DifferentEpidemic
EpidemicOutbreak
OutbreakPeriodsPeriodsandandPMPM2.52.5Concen-
Concentration
tration ChangesChanges
ThePM
The PM2.52.5concentration
concentrationchanges
changeswithin
withinone
oneweek
weekatatdifferent
differentepidemic
epidemicoutbreak
outbreak
stages were taken for analysis and evaluation. Figures 11–13 show the comparison of PM2.5of
stages were taken for analysis and evaluation. Figures 11–13 show the comparison
PM2.5 concentrations
concentrations at Xitunat Xitun Dunhua
station, station, Dunhua
Park, andPark, and 823 Memorial
823 Memorial Park before Park
the before
epidemic the
epidemicwith
outbreak outbreak
differentwithperiods
different periods
of the of theoutbreak,
epidemic epidemicrespectively.
outbreak, respectively.
These figures These
il-
figures illustrate that PM concentration varied widely before the
lustrate that PM2.5 concentration varied widely before the epidemic outbreak and during
2.5 epidemic outbreak and
during epidemic
various various epidemic
outbreakoutbreak
periods.periods. PartPM
Part of the of 2.5
theconcentrations
PM2.5 concentrations
at theseattwo these two
parks
parks exceeded those measured at meteorological station. It displayed
exceeded those measured at meteorological station. It displayed that there was a high that there was a high
levelofofhuman
level humanoutdoor
outdooractivities
activitiesatatthese
thesetwo
twoparks.
parks.These
Thesefigures
figuresalso
alsoshow
showthat
thathuman
human
activities around these two parks were maintained when the epidemic
activities around these two parks were maintained when the epidemic outbreak entered outbreak entered
theplateau
the plateauperiod,
period,but buthuman
humanactivity
activityin
incity
cityhad
hadgradually
graduallydeclined.
declined.Therefore,
Therefore, thethe PM
PM2.52.5
concentrations detected in these two parks exceeded the meteorological
concentrations detected in these two parks exceeded the meteorological station. However, station. However,
asasthe
the epidemic
epidemic heated
heatedup, up,the detected
the data
detected measured
data measured in the
inpark
the and
parkatand
the station showed
at the station
showed a decrease in sync trend, which showed that the human activities in the cityinand
a decrease in sync trend, which showed that the human activities in the city and the
park had gradually decreased. Therefore, the measured value of the PM2.5 concentration in
these two parks and the meteorological station showed a clear downward trend. When
the epidemic broke out, it entered the plains period. The human activities in the cities
and the parks also tend to be at the lowest level. When the epidemic entered a downward
phase, it was clear that PM2.5 concentration in the park was gradually and substantially
exceeding the measured data at the meteorological station. When the outbreak entered a
stable period, the government announced that the epidemic prevention measures were to
be gradually loosened. The PM2.5 concentration data of the two parks and meteorological
station showed a synchronous growth situation in the gradual unsealing of the epidemic.
PM2.5 concentrations measured in the park were greater than those at the meteorological
station. This was because the nearby residents returned to parks but the government had
not yet officially announced the lift of the travel bans.ward phase, it was clear that PM2.5 concentration in the park was gradually and substan-
tially exceeding the measured data at the meteorological station. When the outbreak en-
tially exceeding the measured data at the meteorological station. When the outbreak en-
tered a stable period, the government announced that the epidemic prevention measures
tered a stable period, the government announced that the epidemic prevention measures
were to be gradually loosened. The PM2.5 concentration data of the two parks and mete-
were to be gradually loosened. The PM2.5 concentration data of the two parks and mete-
orological station showed a synchronous growth situation in the gradual unsealing of the
orological station showed a synchronous growth situation in the gradual unsealing of the
epidemic. PM2.5 concentrations measured in the park were greater than those at the mete-
Atmosphere 2022, 13, 276 epidemic. PM2.5 concentrations measured in the park were greater than those at the mete- 13 of 19
orological station. This was because the nearby residents returned to parks but the gov-
orological station. This was because the nearby residents returned to parks but the gov-
ernment had not yet officially announced the lift of the travel bans.
ernment had not yet officially announced the lift of the travel bans.
Xitun Station
60 Xitun Station
60 Before
Before
A
50 A
B
50 B
C
C
D
40 D
))
40
3 3
(µg/m
PM2.5(µg/m
30
30
PM2.5
20
20
10
10
0
0 1 2 3 4 5 6 7
1 2 3 4 5 6 7
Day
Day
Figure
Figure11.
11.The
Thecomparison
comparison of the
of PMPM
the 2.5 concentration changes at Xitun station before the epidemic
concentration changes at station
Xitun station before the epidemic
Figure 11. The comparison of the PM2.5 concentration changes
2.5 at Xitun before the epidemic
outbreak and at various periods of the epidemic outbreak.
outbreakand
outbreak andatatvarious
various periods
periods of the
of the epidemic
epidemic outbreak.
outbreak.
Dunhua Park
Dunhua Park
80 Before A B
80 Before
C D A B
C D
70
70
60
60
))
3 3
(µg/m
50
PM2.5(µg/m
50
40
40
PM2.5
30
30
20
20
10
10
0
0 1 2 3 4 5 6 7
1 2 3 4 5 6 7
Day
Day
Figure 12. The comparison of the PM2.5 concentration changes at Dunhua Park before the epidemic
Figure
Figure12.
Atmosphere 2022, 13, x FOR PEER REVIEW The comparison of the PMPM2.5 concentration changes at Dunhua Park before the epidemic
15 of 20
outbreak andThe
12. comparison
at various of of
periods the 2.5 concentration
the epidemic outbreak. changes at Dunhua Park before the epidemic
outbreak and at various periods of the epidemic outbreak.
outbreak and at various periods of the epidemic outbreak.
823 Memorial Park
60
Before A B
C D
50
40
PM2.5 (µg/m3)
30
20
10
0
1 2 3 4 5 6 7
Day
Figure
Figure13.13.
TheThe
comparison of theofPM
comparison 2.5 concentration changes at 823 Park before the epidemic out-
the PM2.5 concentration changes at 823 Park before the epidemic
break and at various periods of the epidemic outbreak.
outbreak and at various periods of the epidemic outbreak.
4.3.2. Statistical Measurement Analysis
The measured data of Figures 11–13 were analyzed by statistical methods, which are
listed in Tables 2 and 3. These data show the mean, standard deviation, coefficient of var-
iation (CV), mean deviation (MD), interquartile range (IQR), quartile deviation (QR), and
mean absolute deviation (MAD), etc., analyzed on a weekly basis. The mean and standard
deviation are used to investigate the degree of difference between the measurement dataAtmosphere 2022, 13, 276 14 of 19
4.3.2. Statistical Measurement Analysis
The measured data of Figures 11–13 were analyzed by statistical methods, which are
listed in Tables 2 and 3. These data show the mean, standard deviation, coefficient of varia-
tion (CV), mean deviation (MD), interquartile range (IQR), quartile deviation (QR), and
mean absolute deviation (MAD), etc., analyzed on a weekly basis. The mean and standard
deviation are used to investigate the degree of difference between the measurement data
and its mean, and CVs are to explore the degree of numerical variation between the mea-
surement intervals and MD. When the average deviation is large, the difference between
the sign value and the arithmetic average is greater, and the mean is less representative of
the arithmetic average. When the average difference is smaller, the difference between the
sign value and the arithmetic average is smaller, and the mean is a better representation
of the arithmetic average, which comprehensively reflects the degree of variation of the
value of each unit of the population. The quartile (IQR) represents the gap between Q3
for the third quartile and Q1 for the first quartile, showing the dispersion of the measured
data. QD shows the difference between a set of variables with a central half of the data
size, or half of the IQR. MAD was used to discuss the average of the absolute values of
the deviation between the observed value and the arithmetic mean. The above statistical
analysis can accurately reflect the size of the error of the actual measurement value, so this
study was used to explore the difference and dispersion of the detection data.
Tables 2 and 3 show that when the outbreak entered the plateau period, the value of
the PM2.5 concentration decreases with the epidemic outbreak and the values of SD, IQR,
QD, and MAD were significantly reduced. The variation of statistical measurement data
shows that the PM2.5 measurement changes gradually stabilized in 24 h a day. SD, IQR,
QD, and MAD values also decreased from the peak of the epidemic outbreak to the plateau
period, in addition to the decline in the average PM2.5 concentration. The MAD value
illustrates that the measurement data within 24 h was quite stable. It can be found that the
sharp fall in human activity had obviously affected air quality. As the epidemic outbreak
enters a descent phase, human activity gradually returned to normal, and the average, SD,
IQR, QD, and MAD values of PM2.5 measurements increased simultaneously in 24 h a day.
Most of the measured data display that when human activity increased, an increase in the
relevant measured data was observed. In addition, PM2.5 concentration decreased due to
rainfalls during part of the investigation period.
4.4. The Influence of Epidemic Outbreak Changes on Health Effects
In order to investigate the effects of declined PM2.5 concentrations on human health
due to reduced human activities, the research achievements [17] were quoted to explore its
impact on improving the reduction in the SDNN and on the increase in the LF/HF. Table 4
shows the impact benefit of PM2.5 concentrations on SDNN and LF/HF, the step function
of Equation (17) is used as a reference for analyzing the effects of PM2.5 concentration
changes. Where the SDNN represents that the standard deviation of the normal cardiac
rate, i.e., the square of the variance, the greater the standard deviation is, the greater
the variability of the heart rate is. It can be used as the indicator on the overall heart
rate variability. PM2.5 concentration increases the sense of the heart by reducing the
regulation of the parasympathetic nerve, which affects the function of the heart. LF
represents the activity index of low frequency component of the sympathetic nervous
system and parasympathetic nerve and HF represents that the high frequency component of
the sympathetic nervous system and parasympathetic nerve. The LF/HF have a significant
relationship with autonomic nervous system regulation and cardiovascular disease-related
mortality rates. Therefore, this study explored the effects of PM2.5 concentrations due to
the epidemic changes on human health.
The analytical results are shown in Figures 14 and 15. Figure 14 is the analytical results
of Dunhua Park and Figure 15 is at 823 Memorial Park. The left y axis is the SDNN reduction
scale and the right y axis is the LF/HF increase ratio, respectively. Figures 14 and 15 show
the effect of PM2.5 concentration on SDNN and LF/HF. These figures show that when theAtmosphere 2022, 13, 276 15 of 19
epidemic outbreak entered from the plateau period to the plain period, the SDNN and
LF/HF had stable and obvious improvement benefits. The average of PM2.5 concentration
in this region was 36.50 µg/m3 . The health effects on SDNN and LF/HF can be improved
by approximately 73.53%. Both parks have the same effect. When the epidemic gradually
eases, the improved health effect decreased gradually as the value of PM2.5 concentration
increased. When the social life activities returned to normal life, there was a significant
effect on the regulation of the autonomic nervous system associated with cardiovascular
disease mortality. The benefits on these two parks, shown in Figures 11–13, obviously
found that as the amount of public activity decreased, the PM2.5 concentrations were
significantly reduced and also showed obvious benefits to human health. The reduced
human outdoor activity had a certain improvement effect on human health. When the
epidemic entered the decline period and the stabilization period, it can be clearly found
that the variability of SDNN and LF/HF increased. The changes in PM2.5 concentration
gradually increased within 24 h, and a correlation between PM2.5 and human activity and
health was obviously found.
Table 2. Statistical analysis of daily PM2.5 concentrations for each outbreak period in Dunhua Park.
Day Mean SD CV MD IQR QD MAD
Before 1 36.50 9.73 0.27 35.00 12.00 6.00 5.50
2 30.42 11.91 0.39 35.00 17.50 8.75 3.50
3 18.00 4.01 0.22 19.00 5.50 2.75 2.50
4 19.42 6.28 0.32 19.00 10.50 5.25 5.00
5 20.04 8.72 0.43 18.00 12.00 6.00 5.00
6 19.08 6.83 0.36 17.00 8.00 4.00 3.50
7 19.29 9.56 0.50 23.00 16.50 8.25 5.00
A 1 17.17 7.45 0.43 19.50 14.00 7.00 7.00
2 14.42 8.98 0.62 14.00 15.00 7.50 8.00
3 10.83 10.18 0.94 6.50 7.50 3.75 2.50
4 12.21 3.76 0.31 12.00 5.00 2.50 2.50
5 7.54 3.68 0.49 7.00 6.50 3.25 3.00
6 5.54 1.69 0.31 5.00 1.50 0.75 1.00
7 2.92 1.91 0.65 2.50 2.50 1.25 1.50
B 1 11.38 7.11 0.63 8.00 9.00 4.50 2.50
2 4.96 1.71 0.34 5.00 2.00 1.00 1.00
3 7.04 2.10 0.30 7.00 3.50 1.75 2.00
4 8.33 1.61 0.19 8.00 1.50 0.75 1.00
5 7.58 1.86 0.25 8.00 2.50 1.25 1.00
6 9.79 2.99 0.31 10.00 4.50 2.25 2.00
7 8.25 3.15 0.38 8.50 5.00 2.50 2.50
C 1 7.88 2.89 0.37 8.00 3.50 1.75 2.00
2 14.54 7.60 0.52 15.50 13.00 6.50 5.00
3 8.42 3.87 0.46 8.00 5.50 2.75 3.00
4 13.46 7.52 0.56 11.00 10.00 5.00 4.00
5 13.83 9.09 0.66 11.00 8.50 4.25 3.50
6 25.50 9.13 0.36 27.50 15.00 7.50 8.50
7 35.13 5.64 0.16 34.50 9.50 4.75 4.50
D 1 8.79 3.74 0.43 9.50 7.00 3.50 4.00
2 8.50 4.53 0.53 8.00 7.00 3.50 3.00
3 16.13 10.25 0.64 16.00 19.00 9.50 10.50
4 16.42 8.11 0.49 15.00 14.50 7.25 7.50
5 20.46 8.30 0.41 19.00 16.00 8.00 8.50
6 36.83 15.55 0.42 35.50 20.00 10.00 12.00
7 39.79 6.54 0.16 43.00 7.50 3.75 2.00You can also read