Economic assessment of the development of CO2 direct reduction technologies in long-term climate strategies of the Gulf countries
←
→
Page content transcription
If your browser does not render page correctly, please read the page content below
Climatic Change       (2021) 165:64
https://doi.org/10.1007/s10584-021-03058-4

Economic assessment of the development of CO2
direct reduction technologies in long-term climate
strategies of the Gulf countries

Frédéric Babonneau1,3 · Ahmed Badran2 · Maroua Benlahrech2 · Alain Haurie3,4 ·
Maxime Schenckery5 · Marc Vielle6

Received: 26 June 2020 / Accepted: 9 March 2021 /
© The Author(s) 2021

Abstract
This paper proposes an assessment of long-term climate strategies for oil- and gas-
producing countries—in particular, the Gulf Cooperation Council (GCC) member states—
as regards the Paris Agreement goal of limiting the increase of surface air temperature to 2°C
by the end of the twenty-first century. The study evaluates the possible role of carbon diox-
ide removal (CDR) technologies under an international emissions trading market as a way
to mitigate welfare losses. To model the strategic context, one assumes that a global cumula-
tive emissions budget will have been allocated among different coalitions of countries—the
GCC being one of them—and the existence of an international emissions trading market. A
meta-game model is proposed in which deployment of CDR technologies as well as supply
of emission rights are strategic variables and the payoffs are obtained from simulations of a
general equilibrium model. The results of the simulations indicate that oil and gas produc-
ing countries and especially the GCC countries face a significant welfare loss risk, due to
“unburnable oil” if a worldwide climate regime as recommended by the Paris Agreement is
put in place. The development of CDR technologies, in particular direct air capture (DAC)
alleviates somewhat this risk and offers these countries a new opportunity for exploiting
their gas reserves and the carbon storage capacity offered by depleted oil and gas reservoirs.

Keywords GCC countries · Climate negotiations · Carbon dioxide removal · Financial
compensation · Negative emissions · CDR technologies

1 Introduction

This paper provides an assessment of the possible mitigation of the macroeconomic cost
for the Gulf Cooperation Council (GCC) countries incurred if the Paris Agreement goals
are to be reached. In particular, we consider the possible contribution of carbon dioxide

 Frédéric Babonneau
    frederic.babonneau@uai.cl

Extended author information available on the last page of the article.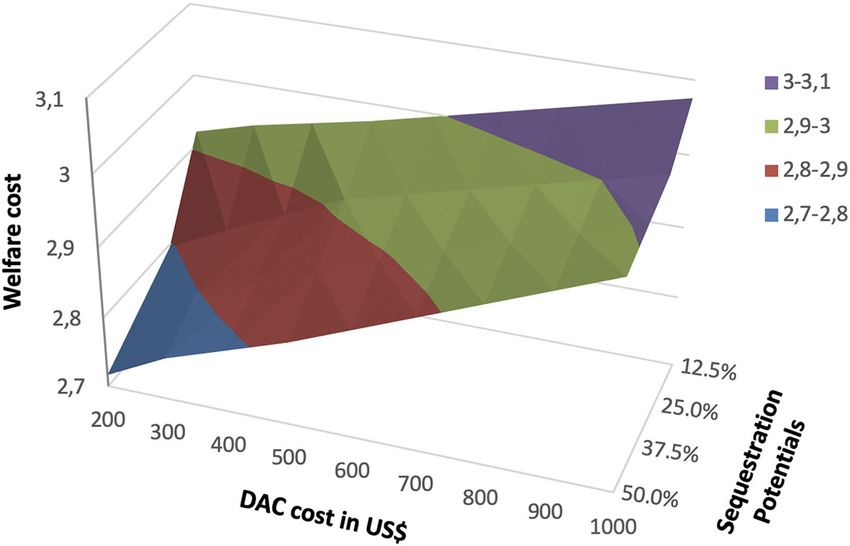
64    Page 2 of 18                                          Climatic Change       (2021) 165:64

removal (CDR) technologies in the definition of long-term strategies of the GCC countries
to reach these goals. The CDR technologies considered include in particular biomass energy
with CCS (BECCS)1 and direct air capture (DAC)2 with carbon sequestration. The GCC
countries’3 economies, largely based on oil and gas revenues, could be strongly affected in
a worldwide drive toward a net-zero emissions regime, as implied by the Paris Agreement.
This objective could be reached by 2070, or even as early as 2050, as discussed in COPs
22-24. The contribution of this paper is mainly methodological and prospective. We do not
discuss the negotiations leading to a new international agreement; rather, we propose an
original macroeconomic framework for assessing the role that CDR technologies could play
in reaching a worldwide transition to net-zero emissions and their possible impacts on oil
and gas exporting economies.
    The current stance of the GCC countries is to resist the international drive toward more
rapid global abatement because it exposes them to a very high risk for stranded assets.
Indeed, a recent IPCC report (Rogelj et al. 2018) presents several emission trajectories pro-
posed by different integrated assessment models for abiding by Paris Agreement objectives.
All these trajectories impose a very stringent abatement trajectory reaching net-zero emis-
sions before the end of the century. Of particular interest to oil- and gas-producing countries,
the Sky scenario—developed by Shell Corporation (Shell-Corp 2018)—indicates also that
the Paris Agreement implies reaching net-zero emissions in 2050 (or 2070, at the latest),
followed by a period where net-negative emissions occur with declining atmospheric CO2
concentration. To reach this net-zero and then net-negative emissions, the Sky scenario pro-
poses a profound transformation of energy systems. By 2070, solar will account for 32%
of primary energy sources, and wind for 13%. Oil, natural gas, and coal will account for
22% and will be associated with carbon capture and storage (CCS). Additionally, and also
associated with CCS, bioenergy will account for 14%.
    BECCS, which consists in a biomass-based combustion power plant with CO2 capture, is
the technology of choice for negative emissions in the Sky scenario. In this process, biomass
absorbs CO2 while growing, and then the power plant captures the CO2 , therefore resulting
in negative emissions. A drawback of choosing BECCS as the main negative emission tech-
nology is the logistics of production and transportation of biomass fuels, which will compete
with food production and afforestation/reforestation (Winchester and Reilly 2015). Another
option—much costlier, but likely of strategic importance to oil and gas producing coun-
tries, and especially the GCC if a high carbon price is set worldwide—comes in the form
of DAC. Developing DAC technologies as a standard industrial process, however, requires
investment and is constrained by access to clean energy sources and CO2 storage capacities.
    Among several recently proposed scenarios for global, long-term strategies that comply
with the Paris Agreement, the DAC appears as a promising technology for attaining a net-
zero emissions regime (Meadowcroft 2013). For example, Marcucci et al. (2017), uses the
MERGE-ETL model (Kypreos and Bahn 2003; Kypreos 2007) to show that a DAC tech-
nology can play an important role in realizing deep decarbonization goals and in reducing
regional and global mitigation costs. Indeed, under the 2°C and 1.5°C scenarios analyzed, a
DAC technology will capture 21 and 40 GtCO2 , yearly by 2100, respectively; will attain a
net-zero emissions regime by 2075 and 2040, respectively; and will be responsible for very
large negative emissions at the end of the planning horizon. In these scenarios, the gas- and

1 Fora recent presentation and discussion of BECCS potential, see Baik et al. (2018) and Consoli (2019).
2 Fora recent presentation and discussion of DAC, see Keith et al. (2018).
3 Bahrain, Kuwait, Oman, Qatar, Saudi Arabia, and the United Arab Emirates.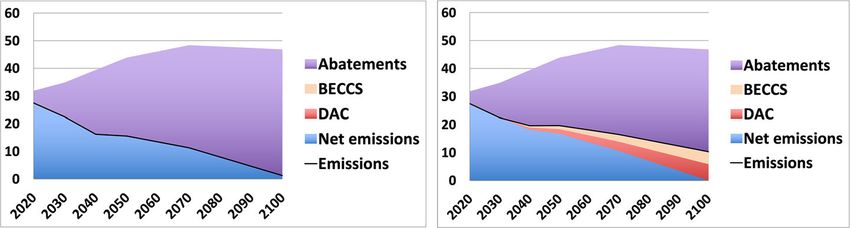
Climatic Change      (2021) 165:64                                                      Page 3 of 18 64

oil-producing countries of the Middle East are expected to have a competitive advantage
in developing DAC because of their access to large carbon sequestration storage capacities.
In this regard, a recently published paper (Keith et al. 2018) gives a complete feasibility
and techno-economic assessment of a DAC technology that uses natural gas for providing
needed power and heat. As described, this represents another comparative advantage for the
development of DAC technologies in gas-producing regions: by transforming their natural
gas endowment and sequestration capacity in depleted oil and gas reservoirs into negative
emissions, the GCC countries and other oil- and gas-exporting countries could, if the price
of carbon incentivizes it, have access to a new, high economic value resource—emission
rights.
    Inspired by the insights provided in Meadowcroft (2013) and Marcucci et al. (2017),
this paper focuses on GCC countries by building upon the results of a more encompassing
macroeconomic model. We use a dynamic game formulation of the strategic competition
among different groups of countries in reaching the Paris Agreement objectives. Briefly,
to assess the future price of carbon, we use a general equilibrium model, which evalu-
ates the macroeconomic costs of long-term climate strategies for 10 groups of countries
(the GCC being one of them). These groups of countries are defined as “natural” coali-
tions in climate negotiations that will almost certainly take place in implementing the Paris
Agreement. To represent possible competition among these groups of countries, we use
a non-cooperative game model that describes the strategic supply of emissions rights in
an international carbon market. Strategies for each group of countries include abatement
decisions and developments in CDR technologies.
    The model assumes a transition toward a net-zero emissions climate regime with a lim-
ited cumulative emissions budget over the 2020–2100 period, compatible with 2°C warming
by 2100. International cooperation is represented by sharing agreements for the remain-
ing cumulative emissions budget4 , where the supposed financial transfer mechanism to be
implemented in the Paris Agreement is represented by trading permits in an international
emission rights market. With the associated abatement path and development of CDR activ-
ities, optimal exploitation of coalitions’ shares of emissions budgets is given by a Nash
equilibrium in a dynamic game model. This meta-modeling approach—where a dynamic
open-loop game is calibrated using statistical emulation of a large sample of simulations,
performed with a world general equilibrium model—was first proposed in Haurie et al.
(2014) and has subsequently been used in several analyses of climate policies (Babonneau
et al. 2016, 2018). The new contribution of this work lies in the explicit consideration of the
GCC economies and the introduction of CDR activities as a strategic choice for coalitions.
    Under this framework, we provide an assessment of the contribution of CDR technolo-
gies in lowering global mitigation costs, and demonstrate some comparative advantages to
oil and gas exporting countries in future long-term climate regimes. Additionally, although
a GCC coalition may currently seem unlikely, we show in this study that the GCC countries
share common economic risks and opportunities, justifying a much broader cooperation
over the next few decades. The results obtained in this study complement previous works
(Stephan and Paterson 2012; Marcucci et al. 2017; Peterson and Weitzel 2016) in sev-
eral ways: (i) they provide an assessment of GDP and welfare losses based on a general
equilibrium model; (ii) they estimate the impact of CDR technology on an International
Environmental Agreement, represented by a shared safety cumulative emissions budget;

4 A safety cumulative emissions budget of 1 trillion ton carbon has been shown to be compatible with the 2°C
goal (Rogelj et al. 2018).
64 Page 4 of 18 Climatic Change (2021) 165:64
(iii) and they propose a possible solution that would limit welfare loss to 2.8% of discounted
cumulative GDP for every coalition.
The paper is organized as follows. In Section 2, we present challenges facing the GCC
countries in attempting to define a long-term climate strategy. In Section 3, we develop the
macroeconomic framework that we use for our assessment. In Section 4, as part of a global
worldwide effort to reach a net-zero emissions regime, we present the simulation results
obtained under this modeling framework and focus particularly on GCC countries and the
potential impact of developing DAC technologies. Finally, in Section 5, we discuss policy
implications and conclude.
2 Challenges for the GCC countries
The long-term goal established by the UNFCCC in Paris—and reaffirmed in the subsequent
COPs—implies reaching a global net-zero emissions regime before the end of the century.
This is indicated in the latest IPCC reports, as well as in several integrated assessment
models (e.g., Paltsev et al. 2018). In this context, climate negotiations seek to drastically
reduce fossil fuel consumption, which would thus seriously impact energy exporting coun-
tries’ economies (McGlade and Etkin 2014). Notably, the GCC countries are part of the
Paris Agreement, operating within the Arab Group5 as their primary negotiating bloc. Here,
although Bahrain, Kuwait, Oman, Qatar, Saudi Arabia, and the United Arab Emirates (UAE)
are all members of the Cooperation Council for the Arab States of the Gulf, there are some
fundamental differences among those countries which have resulted in diverse policies and
strategies. For example, financial resilience differs widely: while Kuwait and Saudi Ara-
bia possess large financial reserves and debt capabilities, Qatar, UAI, and Oman show less
financial strength to support shocks on oil demand and prices (International Energy Agency
2020). As such, it is not currently possible to consider the GCC a unified entity, nor ignore
these differences among its member states.6
Indeed, such differences could impact their respective positions toward climate change
issues or their ability to act as a unified block and defend their common interests in global
negotiations. Nevertheless, all signatory countries must find a way to cooperate on the global
challenge posed by the climate change issue and in reaching a net-zero emission regime
by the end of the century; and indeed, do so while negotiating to obtain, over the long-
term, fair terms of burden sharing. To be sure, the GCC countries share similar exposure to
climate change damages, similar exposure to stranded asset risks, and similar access to CO2
sequestration in depleted oil reservoirs. For these reasons, notwithstanding the differences
discussed, our modeling approach considers that the GCC countries form a natural coalition
to balance the relative negotiating power of different groups of countries around the world.
Several approaches have attempted to define a “road map” for reaching the goals of the
agreement, e.g., in the IEA Sustainable Development scenario (International Energy Agency
5 The Arab States is comprised of 22 member states namely Algeria, Bahrain, Comoros, Djibouti, Egypt,
Iraq, Jordan, Kuwait, Lebanon, Libya, Morocco, Mauritania, Oman, Palestine, Qatar, Saudi Arabia, Somalia,
Sudan, Syria, Tunisia, United Arab Emirates, Yemen.
6 As is the case between many member states of other regional organizations, the GCC member states hold
different positions in relation to different regional and international issues. There is a lack of consensus for
example with regard to determining common interests and defining security threats. There are also some
major differences among the GCC countries regarding their foreign policies and their positions concerning
the Arab spring.Climatic Change (2021) 165:64 Page 5 of 18 64
2020) or the Shell Sky scenario (Shell-Corp 2018). Discussions of the most efficient means
to coordinate international efforts have explored uniform carbon taxes and an international
carbon market based on a cap and trade mechanisms (see Gollier and Tirole 2015). The
basic premise of this paper is thus based on the assumption that there will be negotiations
leading to an international emissions trading scheme with a burden-sharing approach to
emissions reductions. Even though such a development may appear highly unlikely, the sit-
uation described in this study serves as a benchmark, and is certainly more efficient than the
one which will emerge from the COP negotiations. This hypothetical assumption of an effi-
cient world is required for drawing economic assessment conclusions concerning long-term
strategies for the GCC countries, and assuming a trading scheme is useful for comparing dif-
ferent political solutions toward implementing COP agreements and in quantifying possible
economic outcomes.
3 A global macroeconomic framework
Expanding upon previous studies dealing with the assessment of economic impacts of the Paris
Agreement (Babonneau et al. 2016, 2018), we introduce a macroeconomic framework that
combines a computable general equilibrium (CGE) model, namely GEMINI-E3, with a dynamic
game model. The resulting “meta-game” model—under simplifying, but reasonable
assumptions—is used to provide a first insight into possible welfare losses in GCC coun-
tries, if they were to implement a long-term mitigation strategy with CDR technologies. The
full mathematical description of this model is given in the Electronic Supplemental Material.
Briefly, the model describes 10 coalitions of countries (including a grouping of GCC
countries) competing for the supply of emissions permits in an international cap and trade
system as designed to satisfy a global safety cumulative emissions budget (evaluated at
1170 GT of CO2 over the 2020–2100 period). A net-zero emission regime is reached at the
end of this period. To summarize climate negotiations on the burden sharing issue, we con-
sider different possible allocations of a global safety cumulative emissions budget among
different coalitions. Once the share of the emissions budget that goes to each coalition is
decided, the coalitions are assumed to play a non-cooperative game for the supply of emis-
sions permits in the international carbon market. Depending on their respective abatement
policies, the coalitions can be net buyers or net sellers of permits. This generates payment
transfers that converge toward fair burden sharing. Furthermore, our modeling approach
encapsulates several key elements of the design of an international climate regime consis-
tent with Paris Agreement goals. The payoffs for the game-theoretic model are obtained
from statistical emulation of the GEMINI-E3 CGE model presented below.
3.1 Evaluation of welfare losses with the GEMINI-E3 model
GEMINI-E3 (Bernard and Vielle 2008) is a CGE model specifically designed to assess the
impact of climate change mitigation policies in different regions of the world. It has recently
been used to assess the COP21 pledges and a fair 2°C pathway compatible with the Paris
Agreement objectives (Babonneau et al. 2018). For this study, the model has been extended
to permit a more detailed representation of the GCC countries and their risk exposure to
stranded assets. The model is built on the GTAP 9 database (Aguiar et al. 2016), with refer-
ence year 2011. In this version, we detail 10 groupings (regions or coalitions) of countries,
the GCC countries being one of them; they are as follows: European Union (28 coun-
tries), USA, China, India, the GCC, Russia, other Asian countries, other energy-exporting64 Page 6 of 18 Climatic Change (2021) 165:64
countries, Latin America, and the rest of the world.7 Extraction of fossil fuel energy is mod-
eled by carbon content in order to evaluate the “unburnable-oil” effect of climate change
mitigation policies. Three fossil fuel sectors/products are represented: coal, crude oil, and
natural gas. In the model, the impact of deep decarbonization pathways on stranded fos-
sil fuel assets occurs via two main channels: (i) fossil fuel resources localized in energy
exporting countries lose their value, energy rents associated with these resource decrease
(i.e., inground reserves become stranded assets), and welfare is directly negatively impacted
in countries that own these resources; (ii) capital invested in energy sectors (coal mining,
refineries, pipeline infrastructure) and energy-intensive industrial sectors are further depre-
ciated, which in turn negatively impacts households that own these assets. In GEMINI-E3,
like most CGE models, households own capital and other resources, e.g., land, fossil fuel
resources. While we do not consider national oil companies, nevertheless where NOCs are
owned by the government, our results are not affected. Indeed, our scenarios assume that
the government budget is unchanged with respect to the reference scenario. In this sense,
a decline in oil revenue allocated to the government budget requires an increase in house-
hold taxation (e.g., direct tax) and a decrease in household income equivalent to our current
closure rule.
Since GEMINI-E3 was designed to run on the 2011–2050 period, we take a versatile
approach to extend it to 2100 based on steady-state growth through the end of the century.
We first, selected a demographic scenario, then used a production function approach to
indicate the relationship between GDP per capita and the total factor productivity (TFP). We
assume that regional TFPs converge to an exogenously defined common value at the end
of our century, represented by the US figure. Finally, we also assume that CO2 emissions
per unit of GDP decrease at an annual rate and converge also to a single common value for
each region. This allows us to simulate a BaU scenario through 2100 by setting a value for
the three parameters defined above: demographic scenario, TFP, and a carbon intensity per
GDP. In this paper, we assume that the TFP and carbon intensity per GDP converge to 1%
and −1%, respectively at the end of our century.8
This macroeconomic model reproduces historical emissions (2011 to 2018) and its
medium term forecast is based on the WEO outlook 2016 (International Energy Agency
2016). The economic impact of mitigation policies is measured by the gains (or losses) in
terms of trade (GTT) and the domestic abatement costs.9 For energy-exporting countries,
like the GCC countries, the GTT component represents decreases in energy exporting rev-
enues. CDR technologies are not modelled in GEMINI-E3 since they are new technologies
7 The GTAP database is a well-established economic database, used by the majority of CGE models and inter-
national economic institutions (OECD, European Commission, IFPRI, etc). The GTAP consortium and the
collaborators have continuously improved the quality of the database. Although, some developing countries
lack accurate input-output tables—and so their data are probably less reliable—this is not the case for GCC
countries. Data on these countries have undergone extensive improvements over recent years. The authors
would like to specifically mention the efforts of David Green, who has built the input-output tables embed-
ded in GTPA8 for Saudi Arabia, Qatar, Kuwait, Oman, Bahrain, and the UAE. More recently, input-output
tables for Saudi Arabia have been reported in the OECD Input-Output Tables 2018 Edition.
8 The convergence of TFP is well documented. See, for example, Fouré et al. (2012), which used empiri-
cal analysis to derive convergence of 147 countries toward a 1% TFP growth rate (corresponding to the US
figure). While convergence of carbon intensity is less discussed in the literature, energy projection analyses
(e.g., World Energy Outlook (International Energy Agency 2020)) are suggestive of such behavior in scenar-
ios without stringent climate policy. It is thus a reasonable assumption to set carbon intensity to a 1% growth
rate at the end of the century.
9 Determined from deadweight loss of taxation (DWL) (Bernard and Vielle 2003).Climatic Change (2021) 165:64 Page 7 of 18 64
with strategic importance in their development for oil- and gas-exporting countries. In
addressing this, our game model includes explicit decision variables for the investment and
use of these technologies.
3.2 Meta-Game model and linkage with GEMINI-E3
First proposed in Haurie et al. (2014), the meta-game model presents coalition payoffs
as a function of the macroeconomic costs of abatement policies, the cost of developing
CDR technologies, the gains in the terms of trade (GTT) due to global impacts on world
energy prices, and the financial gains or losses from trading permits. Statistical emula-
tion of the macroeconomic model are used to calibrate marginal abatement costs and GTT
functions.
Regression analysis is used to estimate the payoff functions of the game, where strate-
gic variables are the quotas supplied by the different coalitions, at different times, under an
emissions trading scheme. Statistical analysis is based on a sample of 100 numerical simula-
tions of different possible climate policy scenarios performed with GEMINI-E3, as detailed
in the Electronic Supplemental Material.
3.3 Introduction of CDR alternatives
3.3.1 Brief review of CDR technologies
CDR aims to remove carbon dioxide directly from the atmosphere through different pro-
cesses that either increase natural carbon sinks—such as oceans and lands—or use chemical
engineering to suppress carbon dioxide. Of potential geo-engineering approach (Heyward
2013), CDR technologies are considered less environmentally impactful than stratospheric
aerosol injection (SAI), marine cloud brightening, or space reflectors. Within CDR, several
approaches have already been tested and implemented, including ocean iron fertiliza-
tion10 , biochar11 , enhanced weathering12 , large-scale afforestation13 , BECCS, and DAC.
Our analysis focuses on only the last two technologies, which are the most likely backstop
technology candidates (Shell-Corp 2018; Chen and Tavoni 2013).
3.3.2 Techno-economic analysis of CDR technologies
Assessments of DAC technologies are discussed in Keith et al. (2006) and Keith (2009),
and more recently, in House et al. (2011) and Keith et al. (2018). Their potential role in
climate stabilization has been explored in Nemet and Brandt (2012), and then in Chen
and Tavoni (2013), under the WITCH model (Bosetti et al. 2006), which predicts compar-
ative advantages in deploying DAC for the Middle East and energy-exporting countries.
This same comparative advantage was also observed in Marcucci et al. (2017), which used
10 Ocean fertilization refers to the intentional addition of iron into the ocean to stimulate phytoplankton
growth.
11 Biochar refers to a “green coal” obtained by pyrolysis of biomass, such as crop or forestry residues, for the
latter use in agriculture enhancement, leading to carbon sequestration.
12 Enhanced weathering uses the physicochemical properties of certain rocks capable of extracting carbon
dioxide (CO2 ) from the atmosphere that fixes it in solid form.
13 Generally classified in the category of land-use management (Nabuurs et al. 2007).64 Page 8 of 18 Climatic Change (2021) 165:64
the MERGE-ETL model (Kypreos 2007) to explore the potential of the DAC technology.
Under these models, the total quantity of CO2 captured by the DAC and other carbon
capture technologies is constrained by the potential for CO2 storage across regions. As
derived in Marcucci et al. (2017), estimates of storage potentials—including deep saline
aquifers, hydrocarbon fields, and coal beds—are given in Table 1. Due to potential tech-
nical, accessibility, and social acceptance issues—among others—we assume that only a
fraction (between 25 and 50%) of these potentials can be used for the DAC and BECCS
operations by 2100. We also assume that the DAC technologies will be mature enough for
massive deployment by 2040 with a linear deployment trend afterwards.
Cost of DAC has been discussed in recent publications. For instance, Keith et al. (2018),
describes and economically assesses a process fully powered by natural gas, computing a
levelized cost of 232 $/t-CO2 captured; an American Physical Society study (The Ameri-
can Physical Society 2011) proposed a levelized cost of 550 $/t-CO2 ; House et al. (2011)
determined the cost for powering a DAC plant using a natural gas-fired plant with CCS at
396 $/t-CO2 avoided; and the extra energy cost of DAC was estimated around 232 $/t-CO2
captured by Lackner (2009) and Gardarsdottir et al. (2014) and Gardarsdottir et al. (2018).
Storage costs were evaluated in Rubin et al. (2015) to be in the range of 6 to 13 $/t-CO2
stored. The total levelized cost is thus here set at $300/t-CO2 captured and stored, for all
regions except the USA and EUR. These latter costs are priced at $350/t-CO2 captured and
stored, assuming higher logistic costs.
As for BECCS, the technology standard consists of producing electricity from biomass
while capturing and injecting CO2 into geological formations. We use a unique levelized
cost of 60$/t-CO2 for the whole world, consistent with the IEA estimates (Koornneef et al.
2011). BECCS potentials are estimated from the global and regional assessments (Koorn-
neef et al. 2011), which take biomass supply chains and processing into account, and also
include deployment issues in terms of policy and regulatory barriers. Using the IEA esti-
mates, we have derived a global bound on GHG captured through BECCS equal to 10.2 Gt
CO2 , based on technical potentials by 2050. Finally, BECCS penetration is related to elec-
tricity generation levels and composition by year 2050; we adopt what could be considered
rather conservative potential estimates for the end of the century.
Table 1 Carbon storage potential in GtCO2
Storage potential
EUR European Union (28 countries) 24.0
USA United States of America 37.5
CHI China 30.5
IND India 20.0
GCC Gulf Cooperation Council 126.5
RUS Russia 86.0
ASI Rest of Asian countries 23.0
OEE Other energy exporting countries 46.0
LAT Latin America 40.5
ROW Rest of the World 23.0
World 447.0Climatic Change (2021) 165:64 Page 9 of 18 64
3.4 Evaluation of fair compensations among GCC countries
To assess the economic consequences of a proposed climate agreement, we assume “opti-
mal” use—or at least, a second best solution—of the global emissions budget, which will
correspond to a Nash equilibrium among the parties. In this sense, we assume a global
safety cumulative emissions budget (SCEB) of 1170 Gt of CO2 over the time horizon
2018–2100. Climate negotiations, in one form or another, will bear how this global safety
cumulative emission budget is shared among coalitions, regrouping countries with simi-
lar macroeconomic structure. We also assume an international emissions trading system.
Here, the coalitions supply permits to the market, strategically crafting abatement policies
for their share of the safety cumulative emissions budget. In this sense, the development
of CDR activities like BECCS and DAC will allow coalitions to replenish or increase
their own emission budget. We compute a Nash equilibrium around this dynamic game.
Briefly, when a coalition reaches capability for a levelized cost of a CDR technology—be
it BECCS or DAC—lower than the price of permit, it can then invest to increase the permit
allowances and gain advantages in the equilibrium solution. We consider a fair burden shar-
ing is obtained when the share of the remaining safety cumulative emissions budget that is
given to each coalition is such that the relative losses of welfare are equal among all coali-
tions. For the GCC countries, the financial transfers from selling permits through the market
will generate compensations for unburnable oil.
4 Simulation results
4.1 The reference scenario
Using GEMINI-E3, we build a BaU scenario—calibrated on the “New Policies” scenario
from the World Energy Outlook 2016 (International Energy Agency 2016)—for the period
2017–2050. We extend this BaU scenario to the 2050–2100 period, following (Babonneau
et al. 2020). Demographic assumptions are based on the United Nations “median variant”
scenario (United Nations 2017). World population increases by 50% from 2016 to 2100,
and reaches 11.2 billion inhabitants in 2100. During the same period, the BaU scenario
assumes that global GDP multiplies sevenfold—representing a 2.4% annual growth rate—
and that global CO2 emissions reach a maximum of 48.3 billion tons of CO2 in 2050, and
then decrease down to 46.8 billion tons of CO2 at the end of the century. This decline in
emissions is expected from rarefaction of fossil energies over the second half of the twenty-
first century. According to this scenario, more than 4.11 trillion tons of CO2 are emitted
during the twenty-first century. Such an emissions budget would lead to an increase of
surface air temperature over 3.5°C with regard to 1850–1900 period, with probability 66%
(see Rogelj et al. 2018).
4.2 Impact of CDR activity in global mitigation scenarios
In contrast to the BaU scenario, we consider an SCEB of 1170 Gt of CO2 for 2018–2100,
under two scenarios with and without CDR technologies. This budget is consistent with the
recent IPCC report (Rogelj et al. 2018) on the pathway to 2°C. We also assume that very
stringent climate policies can be implemented only after 2030.
Figure 1 shows the global trajectory of CO2 net emissions with and without
DAC/BECCS. Net emissions are equal to CO2 emissions minus DAC/BECCS sequestered64 Page 10 of 18 Climatic Change (2021) 165:64
Fig. 1 Net emissions in Gt CO2 with and without DAC/BECCS
emissions. The dual variable of the SCEB constraint is used to define a CO2 price. Table 2
gives the CO2 price and the worldwide welfare lost.
Without CDR, more abatement is required (see Fig. 2), and this implies a more restric-
tive timeline where CO2 emissions converge to zero at the end of the twenty-first century.
Moreover, this results in a significant welfare loss, 3.8% of the discounted GDP over the
2018–2100 period. When DAC and BECSS are used, however, the worldwide welfare loss
is reduced to 2.8%. Without CDR technologies, the CO2 price given by the dual variable
of the budget constraint is equal to 4140$ in 2100 which corresponds to 775$ in 203014 .
This shows the extreme stringency of the climate target when the CDR technologies are not
available. With CDR technologies, the CO2 price is 1292$ in 2100 corresponding to 480$
in 203015 . These figures are consistent with those in the IPCC special report on Global
Warming of 1.5°C (Rogelj et al. 2018). Indeed, under the Higher-2°C pathway, the range
estimates in the IPCC report are equal to 15–200$ in 2030 and 175–2340$ in 2100. This
shows that CDR technologies allow for reaching the net-zero emission target, and that DAC
activity additionally becomes highly profitable at the end of the century. Figure 2 represents
the same two mitigation scenarios showing the contribution of DAC and BECSS.
Figure 3 shows variation in global welfare loss under the scenarios with the target SCEB
and CDR options. The 2°C threshold corresponds to the 1170 SCEB discussed above. The
diagram shows that the 1.5°C objective appears to be very challenging (Rogelj et al. 2015;
Mitchell et al. 2016), with a cost multiplied by 5. This is also suggestive that the 1.5°C
scenario is highly unlikely due to its cost.
To complement this analysis, we have also simulated a scenario of full cooperation
among all nations. The model assumes implementation of policy which minimizes the total
cost for the whole world, without any constraints on the timing of abatements is imple-
mented. While the “utopia” scenario decreases global percentage loss of GDP, over the
second-best solution, from 2.8 to 2.1%, the two values are not entirely dissimilar.
14 This corresponds to a CO2 price of 1043$ in 2050 and 1873$ in 2070.
15 This corresponds to a CO2 price of 645$ in 2050 and 1165$ in 2070.Climatic Change (2021) 165:64 Page 11 of 18 64 Table 2 CO2 price and welfare cost in the period 2018–2100 assuming a safety budget of 1170 Gt CO2 and a 3% discount factor DAC & BECCS Without With Discounted CO2 price (ref. 2030) in $2010 775 480 Discounted World cost in % of discounted GDP 3.8% 2.8% Fig. 2 Net emissions, DAC, BECCS, and abatement profiles without (left) and with (right) DAC/BECCS (in Gt CO2 ) Fig. 3 Discounted global welfare cost in % of discounted GDP with respect to carbon budget in Gt CO2
64      Page 12 of 18                                       Climatic Change         (2021) 165:64

Table 3 Budget shares and welfare losses for two allocation rules

                   Grandfathering                                   Per capita
                   allocation in %          Welfare costa           allocation in %           Welfare costa

USA                16.6%                    1.3%                    4.0%                      4.0%
EUR                11.2%                    1.4%                    4.3%                      2.8%
CHI                27.2%                    1.2%                    15.1%                     4.0%
IND                6.3%                     3.0%                    17.2%                     −4.5%
RUS                4.5%                     6.9%                    1.5%                      11.4%
GCC                2.9%                     11.0%                   0.9%                      13.8%
OEE                8.8%                     4.7%                    11.6%                     3.9%
ASI                11.8%                    2.4%                    17.5%                     1.4%
LAT                3.0%                     2.9%                    4.5%                      1.1%
ROW                7.7%                     6.4%                    23.3%                     −0.1%

World              100.0%                   2.8%                    100.0%                    2.8%

a Discounted   welfare cost in % of discounted GDP

4.3 Fair allocation of SCEB across GCC countries

Prior to designing possible fair sharing agreements, we first explore the economic impacts
that would occur under the implementation of two quota allocations, extensively discussed
and analyzed in the literature: “Grandfathering” and “Per Capita.” Table 3 shows the bud-
get shares and welfare losses under these two rules. In neither cases is fairness achieved,
and the GCC countries are moreover disadvantaged at 11% and 13.8% of discounted GDP
losses, respectively. Indeed, the relatively few permits allocated to the GCC countries—
2.9% under Grandfathering, and 0.9%, under Population—appear to be largely insufficient
to compensate for their revenue losses in world energy markets.
    Table 3 shows the effects from these rules. Grandfathering allocates quotas proportional
to emissions in the BaU scenario over the whole period (2018–2100). This idea is meant
to take existing situations into account as a starting point in environmental negotiations, on
the basis of the principle of sovereignty. Under this allocation, energy-exporting countries
(Russia, the GCC countries, and OEE) and the Rest of the World16 incur a very high burden,
while India, Latin America, and China largely benefit. The second rule, per capita, sets the
budget share proportional to the population over the 2018–2100 period. This equalitarian
rule creates a large number of extreme welfare impacts. The most populated countries earn
significant revenues by selling emissions. Therefore, India, the Rest of the World, and Latin
America experience improvements in welfare by implementing climate mitigation policy,
while energy exporting countries—as well as China and the USA—bear significant wel-
fare loss. The difference between China and India, which have comparable populations, is
because the former has a much higher per capita CO2 emission rate stemming from higher
economic development and greater dependence on coal.
    To address the issue of fair distribution of the SCEB, we follow the approach proposed in
Haurie et al. (2014). We propose a burden-sharing rule that equalizes welfare losses among
the 10 groups of countries. This so-called “Rawlsian” allocation seeks to maximize welfare

16 Rest   of the World regroups many developing countries.
Climatic Change (2021) 165:64 Page 13 of 18 64
Table 4 Burden-sharing and welfare cost with Rawlsian rule in percentage difference from the reference
scenario
Budget Welfare Components of welfare costa
share costa Abatement DAC BECCS GTT Emissions tradingb
USA 9.07% 2.84% 1.78% 0.17% 0.32% −0.02% 0.58%
EUR 4.31% 2.84% 0.82% 0.33% 0.24% −0.41% 1.87%
CHI 19.93% 2.84% 3.72% 0.20% 0.15% −0.63% −0.61%
IND 6.53% 2.84% 3.49% 0.29% 0.57% −1.33% −0.18%
RUS 7.01% 2.84% 3.16% 6.22% 1.29% 1.89% −9.70%
GCC 8.81% 2.84% 3.30% 5.38% 0.02% 5.55% −11.39%
OEE 15.57% 2.84% 1.68% 0.19% 0.14% 0.99% −0.16%
ASI 9.45% 2.84% 1.45% 0.28% 0.23% −0.69% 1.56%
LAT 3.00% 2.84% 1.83% 1.56% 1.22% 0.11% −1.88%
ROW 16.31% 2.84% 2.53% 0.27% 0.19% 0.32% −0.47%
World 100.00% 2.84% 2.04% 0.54% 0.29% 0.00% 0.00%
a Discounted welfare cost in % of discounted GDPDiscounted welfare cost in % discounted GDP
b Negative (positive) values are for net sellers (buyers)
for the worst affected countries. Table 4 displays the resulting fair allocation of quotas, a
breakdown of costs among abatement and DAC and BECCS activities, and GTT and permit
exchanges on the international emission market. Here, the GCC countries and Russia are
enabled to sell emission rights to offset losses in fossil energy-exporting revenues and DAC
activity cost. On the other hand, industrialized countries (e.g., USA, Europe, and Japan)
are the main buyers of permits, and transfer financial compensations to the GCC coun-
tries. In short, once there is agreement on the principle of an international carbon market
and of distributing a global safety cumulative emissions budget, the market will generate
compensations.
We compare these results via a sensitivity analysis to evaluate the impact of DAC costs
and potentials on the burden sharing agreement. We define a set of scenarios that place DAC
sequestration potentials from 12.5 to 50% and costs from 200 to 1000 US$ per ton of CO2
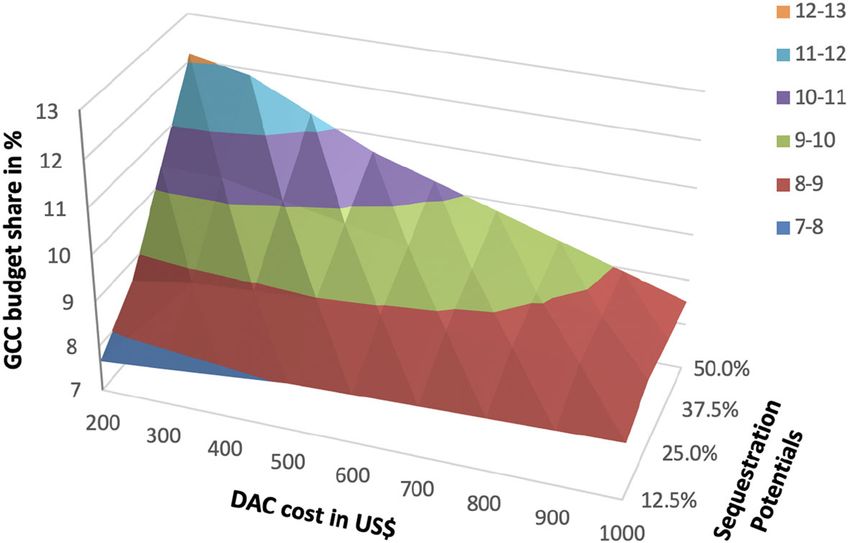
sequestered. Figures 4 and 5 show global welfare loss in % of discounted GDP and the fair
GCC budget shares, respectively
We observe in Fig. 4 that welfare loss of the total discounted GDP varies reasonably,
2.7% under the “low price-high potential” scenario, and 3.1% under the “high price-low
potential” scenario. As expected, the most favorable conditions, i.e., lowest price and
highest potential scenarios, lead to better cost performances.
The results shown in Fig. 5 indicate that, at a fixed DAC price, permit allocations to the
GCC countries under fair burden sharing agreements increase with available sequestration
potential. Notably, this increase in allocation also occurs at reduced prices. That GCC coun-
tries generate even more permits from DAC under “low-price and high-potential” scenarios
may seem counterintuitive; however, the explanation lies in the evolution of CO2 permit
prices, which are greatly reduced under the “low-price and high-potential” scenarios. Given
lower permit prices, the GCC countries seek greater permit allocation to compensate for
their losses. Our numerical experiments estimate the GCC budget share between 7.8% and
12.1%.64 Page 14 of 18 Climatic Change (2021) 165:64 Fig. 4 Discounted global welfare cost in % of discounted GDP with respect the DAC cost and potential 5 Discussion and conclusion This paper complements previous works (Stephan and Paterson 2012; Marcucci et al. 2017; Peterson and Weitzel 2016) in several ways: (i) it provides an assessment of GDP and welfare losses based on a general equilibrium model; (ii) it estimates the impact of CDR technologies on an international environmental agreement, represented by shares of a safety cumulative emissions budget; (iii) and it proposes a burden sharing scheme that limits wel- fare loss to 2.8% of cumulative discounted GDP for each of the 10 coalitions. Some new insights are gleaned from the simulations presented above: (i) a net-zero emissions regime by the end of the century is greatly facilitated by the implementation of CDR technologies, and DAC in particular; (ii) in a net-zero emissions regime under an international emissions Fig. 5 Fair GCC budget share with respect the DAC cost and potential
Climatic Change       (2021) 165:64                                                       Page 15 of 18 64

trading market, captured CO2 represents a new resource, with low extraction cost and trad-
able on the international carbon market17 ; (iii) developments in DAC technology, along
with a fair allocation of allowances under an international emissions trading system, mit-
igate risks involved with unburned carbon among GCC countries; (iv) finally, in a world
where fossil fuel reserves could become stranded assets, developments in DAC technology
will help to diversify GCC economies18 . As such, the following conclusions, summarized
below, derive from the main results of the simulations:
•    A market-based approach, with equalized marginal abatement costs and Rawlsian allo-
     cation of permits, yields a uniform discounted GDP welfare loss of 3.8% when no CDR
     option is available (see Table 2). For the GCC countries, this corresponds to a welfare
     loss of $5 trillion in discounted GDP19 .
•    Including CDR options decreases this loss by 26% (from $5.0, to $3.7, trillion), corre-
     sponding to an equalized welfare loss of 2.8% of discounted GDP. In this process, DAC
     penetration first yields a significant reduction of abatement costs in all countries, and
     particularly for the GCC countries, falling from $7.6 trillion to $4.3 trillion. Second,
     DAC investments and operations—estimated at $7.1 trillion for the GCC countries—
     enable them to obtain additional emission permits for sale on the international market.
     Compensation transfers remain virtually unchanged compared with the no-CDR case,
     since the sale of more permits offsets lower permit prices. In brief, introducing DAC
     reduces unburned oil and reduces the loss of oil and gas revenues for energy exporting
     countries. DAC technology is therefore central to the design of a fair climate agree-
     ment: it allows GCC countries to exploit a comparative advantage associated with large
     natural gas endowments and high CO2 storage capacities20 .
   The investment needed for such a massive DAC capability would be around $223 bil-
lion. While these numbers are daunting, given a carbon price above $480/t after 2030,
such investments represent an interesting industrial diversification, ensuring a longer life to
soon-to-be-unburnable assets, at no logistical cost to valorize natural gas.
   Finally, GCC member states have historically been proactive in oil and gas geopolitics.
This study shows a further avenue for proactivity in climate geopolitics, should they foster

17  In this study, we assumed that all CO2 captured by the DAC were stored. There is indeed another potential
use of the DAC to produce clean fuels that could be exported by the GCC member states or used locally in
agriculture, for example.
18 Recently, Qatar Petroleum announced a 5 million tonne CCS project for 2025. https://qp.com.qa/en/Pages/
BannerAdvertisement.aspx?imgname=08102019+HE+CEO+-+Oil+and+Money+Conference+2019+English.jpg.
19 In a market-based approach where marginal abatement costs are equalized by a uniform carbon tax
designed to meet a SCEB of 1170 Gt CO2 , a welfare loss for the GCC countries close to 17% of GDP is
obtained when no CDR option is available. This result, which is not presented in the paper, is provided here
as an indication of the risk of unburned oil for the GCC countries. The discounted sum of abatement costs
and GTT is estimated at $16.1 trillion ($7.6 trillion and $8.5 trillion for abatement costs and GTT, respec-
tively). This GTT loss is of the same order of magnitude as the global fossil fuel rent loss estimated in Bauer
et al. (2016) at $2005 12.4 trillion in a 450-ppm stabilization scenario. The financial transfers due to permits
selling compensate for these welfare losses and reach $11.1 trillion. They result from the allocation of the
global safety emissions budget.
20 The global carbon rent equals $290 trillion significantly higher than the one given in Bauer et al. (2016)
for a 450 ppm CO2 -eq and equal to $2005 32 trillion. But these discounted figures are based on a different
discount factor (3% in our case and 5% in Bauer et al. (2016)) and our cumulative emission are 12% higher
than their 40 ppm scenario (Using in our model a 5% discount factor and the same cumulative budget gives
a global carbon rent equal to $2005 112 trillion).
64 Page 16 of 18 Climatic Change (2021) 165:64
R&D in CDR technologies and contribute to the establishment of efficient and fair com-
pensation mechanisms. Indeed, this study shows that, in an international emissions trading
system, a coalition of the GCC countries could claim, in a fair agreement, up to 8.8% of the
emissions rights from an SCEB of 1170 Gt CO2 . It is a brighter future for the GCC coun-
tries where DAC technologies penetrate at sufficient scale. While efficient capture of CO2
with low concentration in open air remains an open research domain, we may expect large
advances in terms of cost and availability. Similarly, the design of a fair burden sharing
mechanism, based on allocation of a global safety cumulative emissions budget and trad-
ing on an international carbon market, falls to political science research. As suggested by
the results of this study, these two research domains could become key priorities for GCC
economies and other fossil fuel producing countries and companies.
Supplementary Information The online version contains supplementary material available at
https://doi.org/10.1007/s10584-021-03058-4.
Acknowledgements Two anonymous reviewers are gratefully thanked for their valuable comments and
suggestions.
Funding This paper was made possible by NPRP grant number 10-0212-170447 from the Qatar National
Research Fund (a member of Qatar Foundation). The first author acknowledges support provided by FONDE-
CYT 1190325 and by ANILLO ACT192094, Chile. The fourth author also received support provided by the
IFP School Chair on Carbon Management (CARMA). The last author also received support provided by the
H2020 European Commission Project “PARIS REINFORCE” under grant agreement no. 820846.
Declarations
Disclaimer The findings herein reflect the work, and are solely the responsibility, of the authors. The paper
does not necessarily reflect the opinions of the European Commission.
Open Access This article is licensed under a Creative Commons Attribution 4.0 International License, which
permits use, sharing, adaptation, distribution and reproduction in any medium or format, as long as you give
appropriate credit to the original author(s) and the source, provide a link to the Creative Commons licence,
and indicate if changes were made. The images or other third party material in this article are included in the
article’s Creative Commons licence, unless indicated otherwise in a credit line to the material. If material is
not included in the article’s Creative Commons licence and your intended use is not permitted by statutory
regulation or exceeds the permitted use, you will need to obtain permission directly from the copyright holder.
To view a copy of this licence, visit http://creativecommons.org/licenses/by/4.0/.
References
Aguiar A, Narayanan B, McDougall R (2016) An overview of the GTAP 9 data base. Journal of Global
Economic Analysis 1(1):181–208
Babonneau F, Bahn O, Haurie A, Vielle M (2020) An oligopoly game of CDR strategy deployment in a
steady-state net-zero emission climate regime. Environmental Modeling & Assessment, online first
Babonneau F, Haurie A, Vielle M (2016) Assessment of balanced burden-sharing in the 2050 EU
climate/energy roadmap: a metamodeling approach. Clim Chang 134(4):505–519
Babonneau F, Haurie A, Vielle M (2018) From COP21 pledges to a fair 2°C pathway. Economics of Energy
& Environmental Policy 7(2):69–92
Baik E, Sanchez DL, Turner PA, Mach KJ, Field CB, Benson SM (2018) Geospatial analysis of near-term
potential for carbon-negative bioenergy in the United States. PNAS 115(13):3290–3295
Bauer N, Mouratiadou I, Luderer G, Baumstark L, Brecha RJ, Edenhofer O, Kriegler E (2016) Global fossil
energy markets and climate change mitigation an analysis with REMIND. Clim Chang 136:69–82Climatic Change (2021) 165:64 Page 17 of 18 64
Bernard A, Vielle M (2003) Measuring the welfare cost of climate change policies: a comparative assessment
based on the computable general equilibrium model GEMINI-e3. Environ Model Assess 8(3):199–217
Bernard A, Vielle M (2008) GEMINI-E3, a general equilibrium model of international national interactions
between economy, energy and the environment. Computational Management Science 5(3):173–206
Bosetti V, Carraro C, Galeotti M, Massetti E, Tavoni M (2006) WITCH: a world induced technical change
hybrid model. Energy Journal 27:13–37
Chen C, Tavoni M (2013) Direct air capture of CO2 and climate stabilization: a model based assessment.
Clim Chang 118:59–72
Consoli (2019) Bioenergy and carbon capture and storage. https://www.globalccsinstitute.com/wp-content/
uploads/2019/03/BECCS-perspective FINAL 18-march.pdf, Global CCS Institute
Fouré J., Bénassy-Quéré A, Fontagné L (2012) The great shift: macroeconomic projections for the world
economy at the 2050 horizon. Technical Report 2012-03 CEPII
Gardarsdottir SA, Normann F, Andersson K, Johnsson F (2014) Process evaluation of CO2 capture in three
industrial case studies. Energy Procedia 63:6565–6575
Gardarsdottir SA, Normann F, Andersson K, Johnsson F (2018) Investment costs and CO2 reduction poten-
tial of carbon capture from industrial plants - a Swedish case study. Int J Green Gas Control 76:111–
124
Gollier C, Tirole JMP (2015) Negotiating effective institutions against climate change. Economics of Energy
and Environmental Policy 4:5–27, 1
Haurie A, Babonneau F, Edwrads N, Holden P, Kanudia A, Labriet M, Leimbach M, Pizzileo B, Vielle M
(2014) Fairness in climate negotiations : a meta-game analysis based on community integrated assess-
ment, chapter in Lucas Bernard and Willi Semmler eds. Oxford Handbook on the Macroeconomics of
Global Warming Oxford University Press
Heyward C (2013) Situating and abandoning geoengineering: a typology of five responses to dangerous
climate change. Political Science & Politics 46(1):23–27
House KZ, Baclig AC, Ranjan M, Nierop EA, Wilcoxx J, Herzog HJ (2011) Economic and energetic analysis
of capturing CO2 from ambient air. PNAS Early Edition, pp 1–6
International Energy Agency (2016) World Energy Outlook 2016
International Energy Agency (2020) World Energy Outlook 2020
Keith DW, Holmes G, Angelo DST, Heidel K (2018) A process for capturing CO2 from the atmosphere.
Joule 2:1573–1594
Keith DW (2009) Why capture CO2 from the atmosphere? Science 325(5948):1654–1655
Keith DW, M Ha-Duong M, Stolaroff J (2006) Climate strategy with CO2 capture from the air. Climatic
Change 74(1-3):17–45
Koornneef J, can Breevoort P, Hendricks C, Hoogwijk M, Koops K (2011) Potential for biomass and carbon
dioxide capture and storage. Technical report, International Energy Agency
Kypreos S (2007) A MERGE model with endogenous technological change and the cost of carbon
stabilization. Energy Policy 35:5327–5336
Kypreos S, Bahn O (2003) A MERGE model with endogenous technological progress. Environ Model Assess
8:249–259
Lackner K (2009) Capture of carbon dioxide from ambient air. Eur Phys J Spec Top 176:93–106
Marcucci A, Panos V, Kypreos S (2017) The road to achieving the long-term Paris targets: energy transition
and the role of direct air capture. Climatic Change
McGlade C, Etkin P (2014) Unburnable oil: an examination of oil resource utilisation in a decarbonated
system. Energy Policy, pp 102–12
Meadowcroft J (2013) Exploring negative territory carbon dioxide removal and climate policy initiatives.
Clim Chang 118(1):137–149
Mitchell D, James R, Forster PM, Betts RA, Shiogama H, Allen M (2016) Realizing the impacts of a
1.5°C warmer world. Nature Clim Change. Advance online publication, 6, 735737 doi.org/10.1038/
nclimate3055
Nabuurs GJ, Masera O, Andrasko K, Benitez-Ponce P, Boer R, Dutschke M, Elsiddig E, Ford-Robertson J,
Frumhoff P, Karjalainen T, Krankina O, Kurz WA, Matsumoto M, Oyhantcabal W, Ravindranath NH,
Sanz Sanchez MJ, Zhang X (2007) Forestry. In: Metz B, Davidson OR, Bosch PR, Dave R, Meyer
LA (eds) Climate change 2007: mitigation. contribution of working group III to the fourth assess-
ment report of the intergovernmental panel on climate change. Cambridge University Press, Cambridge,
pp 543–584
Nemet GF, Brandt AR (2012) Willingness to pay for a climate backstop: liquid fuel producers and direct
CO2 air capture. Energy J 33(1):53–8164 Page 18 of 18 Climatic Change (2021) 165:64
Paltsev S, Sokolov A, Gao X, Haigh M (2018) Meeting the goals of the Paris agreement: temperature inmpli-
cations of the Shell Sky scenario. Technical Report 330, MIT Joint Program on the Science and Policy
of Global Change
Peterson S, Weitzel M (2016) Reaching a climate agreement: compensating for energy market effects of
climate policy. Clim Pol 16(8):993–1010
Rogelj J, Shindell D, Jianga K, Fifita S, Forster P, Ginzburg V, Handa C, Kheshgi H, Kobayashi S, Kriegler
E, Mundaca L, Séférian R, Vilarino MV (2018) Global warming of 1.5°C an IPCC Special Report on
the impacts of global warming of 1.5°C above pre-industrial levels and related global greenhouse gas
emission pathways, in the context of strengthening the global response to the threat of climate change,
sustainable development, and efforts to eradicate poverty chapter Mitigation pathways compatible with
1.5°C in the context of sustainable development
Rogelj J, Luderer G, Pietzcker RC, Kriegler E, Schaeffer M, Krey V, Riahi K (2015) Energy system
transformations for limiting end-of-century warming to below 1.5°C. Nature Clim Change 5(6):519–527
Rubin ES, Davison JE, Herzog HJ (2015) The cost of CO2 capture and storage. International Journal of
Greenhouse Gas Control 40:378–400
Shell-Corp (2018) Shell scenarios sky: meeting the goals of the Paris agreement. Technical report, Royal
Dutch Shell
Stephan B, Paterson M (2012) The politics of carbon markets: an introduction. Environmental Politics
21(4):545–562
The American Physical Society (2011) Direct air capture of CO2 and climate stabilization: a model based
assessment with chemicals: a technology assessment for the APS panel on public affairs. Technical report
United Nations (2017) World population prospects: the 2017 revision. Population Division, Department of
Economic and Social Affairs
Winchester N, Reilly JM (2015) The feasibility, costs, and environmental implications of large-scale biomass
energy. Energy Economics 51:188–203
Publisher’s note Springer Nature remains neutral with regard to jurisdictional claims in published maps
and institutional affiliations.
Affiliations
Frédéric Babonneau1,3 · Ahmed Badran2 · Maroua Benlahrech2 · Alain Haurie3,4 ·
Maxime Schenckery5 · Marc Vielle6
Ahmed Badran
a.badran@qu.edu.qa
Maroua Benlahrech
maroua.benlahrech@qu.edu.qa
Alain Haurie
ahaurie@gmail.com
Maxime Schenckery
maxime.schenckery@ifpen.fr
Marc Vielle
marc.vielle@epfl.ch
1 ORDECSYS, Switzerland and Escuela de Negocios, Universidad Adolfo Ibañez, Santiago, Chile
2 Qatar University, Doha, Qatar
3 ORDECSYS, University of Geneva, Geneva, Switzerland
4 GERAD, HEC Montréal, Montréal, Quebec, Canada
5 IFPEN, IFP School, Rueil-Malmaison, France
6 École Polytechnique Fédérale de Lausanne, LEURE, Lausanne, SwitzerlandYou can also read