Dry Textile Forming Simulations: A Benchmarking Exercise
←
→
Page content transcription
If your browser does not render page correctly, please read the page content below
ORIGINAL RESEARCH
                                                                                                                                                      published: 16 March 2022
                                                                                                                                               doi: 10.3389/fmats.2022.831820

                                               Dry Textile Forming Simulations: A
                                               Benchmarking Exercise
                                               Xiaochuan Sun *, Jonathan P.-H. Belnoue, Adam Thompson, Bassam El Said and
                                               Stephen R. Hallett
                                               Bristol Composites Institute, University of Bristol, University Walk, Bristol, United Kingdom

                                               In this study, four representative finite element (FE) based modelling techniques and an
                                               analytical solution for the prediction of 2D woven fabrics’ deformation during forming are
                                               compared back-to-back. Ordered from high to low fidelity they are: 1/a Multi-Filament (MF)
                                               method that sits between micro- and meso-scale that uses multiple beam element chains
                                               to represent each fibre yarn; 2/a meso-scale 3D representation (3D-Shell method) that
                                               uses 2D structural shell elements to model each fibre yarn; 3/a 2D continuum element
                                               approach that uses coincident membrane and shell elements with user defined material
                            Edited by:         properties to capture the deformation response of textiles in an homogenised sense at the
                      Philippe Boisse,         macro-scale; 4/pin-jointed net (PJN) models where the reinforcement directions are
       Institut National des Sciences
    Appliquées de Lyon (INSA Lyon),
                                               represented by extendable 1D elements, pin-jointed at the elements’ crossover points.
                                France         These modelling approaches are systematically compared for identical forming processes
                       Reviewed by:            with identical process and material parameters such as boundary conditions, weave
                           Biao Liang,         architecture and tooling geometries. For completeness and to highlight the importance of
          Northwestern Polytechnical
                     University, China         considering inter-yarn and preform-to-tool interactions, a kinematic drape algorithm
                      Fouad Erchiqui,          (based on geometrical mapping) is also considered. An attempt is made to visualise
     Université du Québec en Abitibi
             Témiscamingue, Canada
                                               the overall modelling performance and computational cost of all representative modelling
                            Renzi Bai,         approaches by simplified metrics.
       Institut National des Sciences
    Appliquées de Lyon (INSA Lyon),            Keywords: fabrics/textiles, deformation modelling, forming, finite element analysis, benchmarking
                                France
                   *Correspondence:
                        Xiaochuan Sun          1 INTRODUCTION
                  ric.sun@bristol.ac.uk
                                               With the increasing use of carbon fibre reinforced polymers (CFRPs) for structural and non-
                  Specialty section:           structural applications in many industries, reduction in manufacturing cost while increasing
       This article was submitted to           production volume has become a key driver in both academia and industry. Among all available
 Polymeric and Composite Materials,            fibre reinforcement in CFRPs, dry carbon fibre reinforced biaxial woven fabrics have several unique
             a section of the journal          advantages and attractive to many structural applications. They are cost effective, easier to handle,
                Frontiers in Materials
                                               more stable, and they have more balanced mechanical properties and superior formability. 2D woven
       Received: 08 December 2021              composites are normally formed into shapes (either on a layer-by-layer basis or as a stack) and then
        Accepted: 14 February 2022
                                               consolidated, infused and finally cured. Among these processes, fabric forming is a key
         Published: 16 March 2022
                                               manufacturing step controlling the final quality of parts and requires particular attention.
                            Citation:          During forming, materials are forced to deform from 2D sheets into 3D shapes and undergo
 Sun X, Belnoue JP-H, Thompson A,
                                               large deformations. At the end of forming, fibre orientations are set on 3D contours. Defects can be
  Said BE and Hallett SR (2022) Dry
      Textile Forming Simulations: A
                                               induced as the results of the large deformation of the material due to the process constraints and the
             Benchmarking Exercise.            nature of the material. If defects are not identified early on, they will also affect local material
             Front. Mater. 9:831820.           properties after consolidation and/or locally affect resin flow and fabric impregnation, which will
   doi: 10.3389/fmats.2022.831820              ultimately impact parts’ structural performance (Loix et al., 2008; Arbter et al., 2011; Walther et al.,

Frontiers in Materials | www.frontiersin.org                                            1                                             March 2022 | Volume 9 | Article 831820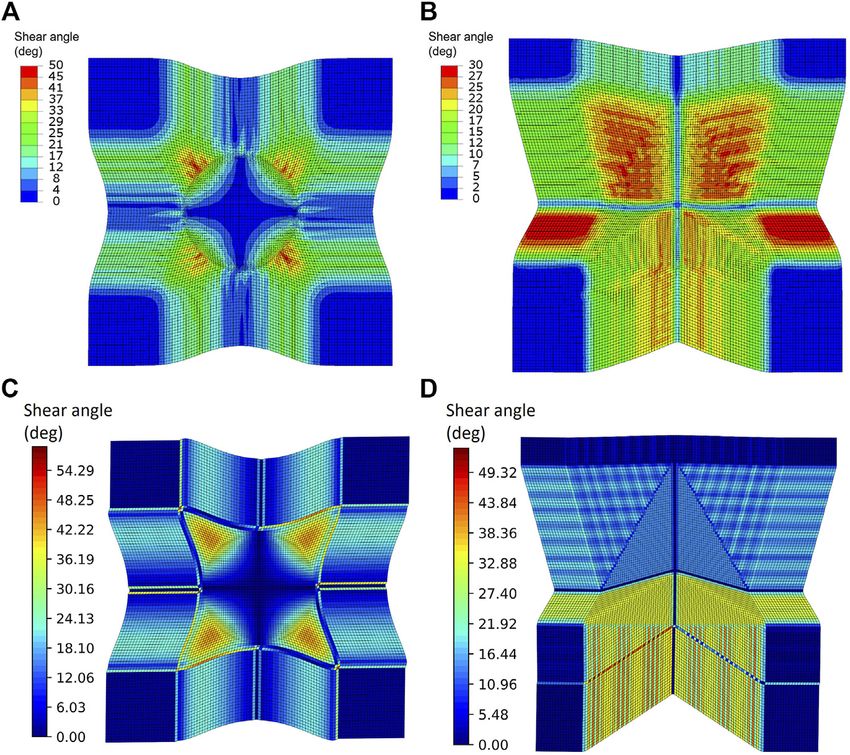
Sun et al.                                                                                             Benchmarking of Textile Forming Simulations

2012; Bloom et al., 2013; Bodaghi et al., 2019; Varkonyi et al.,          2019; Wang et al., 2020). They are typically referred to as
2020; Rashidi et al., 2021a). Understanding the deformation               micro-mesoscale (fibre bundles are modelled) or mesoscale
mechanics of textile and their interactions with tooling during           modelling (fibre yarns are modelled), respectively (Wang and
the forming process is key in understanding defect formation and          Sun, 2001; Sun and Sun, 2004; Wang et al., 2010; Durville, 2010b;
ways to defect-free composites (Liang and Boisse, 2021;                   Durville, 2021). Due to their high computational cost, these
Wielhorski et al., 2022).                                                 models are normally used for modelling detailed geometry of
   It has long been thought that robust and efficient numerical            2D fabrics or 3D complex woven fabrics at the size of a unit cell
process simulations that are able to capture the full response of         and only a few attempts have been made at using them to model
textile preforms during forming and help reduce material waste            an entire preform (Thompson et al., 2018a). However, these
and cost associated with the traditional trial-and-error approach         models provide the full digital representations of fibre yarns
and ensure a consistent quality in production of structural               and their outcomes are detailed enough to be post-processed
composite components. Many efforts have been made to                      for other manufacturing process modelling or transferred to
simulate textile composites during forming (or draping)                   mechanical virtual testing (Wang et al., 2010).
processes by either closed-loop analytical approximations or                 The present study has conducted a thorough benchmarking
by finite element analysis (FEA). In the former case, geometric            exercise of the above-mentioned methods against each other, with
mapping (or kinematic draping analysis) is normally adopted at            the aim of supporting designers and engineers in making choices
early design/optimisation process (Krogh et al., 2020). Pin-              between required level of accuracy and computational efficiency.
jointed trellis structures are used to represent the woven fabric         Three modelling approaches of different fidelity, developed and
in an analytical format (Wang et al., 1999; Cherouat et al., 2005;        implemented at Bristol Composite Institute (BCI), across
Skordos et al., 2007; Hearle, 2011). The tensile modulus of the           different modelling platforms are considered. These are
fabric is assumed to be infinite whilst the other moduli are taken         supplemented by a kinematic drape model (Krogh et al., 2021;
as negligible. This method, based on geometrical mapping, is              Krogh et al., 2019) and a FEA-based PJN (FE-PJN) model. The
attractive to industry for its low computational cost and allows          FE-PJN model resembles kinematic drape analysis (Skordos et al.,
approximate of fibre re-orientation on complex moulds.                     2007); the same assumptions are made but it is implemented in a
However, due to its formulation, it has limited predictive                finite element environment which allows for the interaction
capabilities to reflect the distinct deformation mechanics of              between preform and tooling to be taken into account.
fabrics, forming mechanics and the effects of boundary                    Therefore, it was expected to have a similar run time but
conditions given to the preform. On the other hand, FEA-                  achieve higher predictive capabilities than its analytical
based models use user-defined material models that are                     counterpart (i.e. kinematic draping). As shown in Figure 1,
normally validated by material characterisation testing while             the three other FEA-based method considered in this study
taking into account the fabrics’ deformation mechanics and                are 1) a 2D shell/membrane elements with user defined
preform/tooling interactions. Forming process constraints such            material properties (referred as HypoDrape hereafter) which
as those given by diaphragms in double diaphragm forming                  captures the deformation response of textile composites at the
(DDF) or by blank holders in punch forming, deep drawn and                macroscale (i.e. in an homogenised sense) (Thompson et al.,
die (such as that in RTM process) can be easily captured by               2017; Thompson et al., 2018b); 2) the Multi-Filament (MF)
commercial FEA software with minimum manual interventions                 method that sits between micro- and meso-scale and uses
(Rashidi et al., 2021b). FEA-based modelling is however more              multiple beam element chains to represent each fibre yarn (El
difficult to set-up during pre-processing stage and is often               Said et al., 2014; Green and Long, 2014; Thompson et al., 2017);
associated with long run-times. Compromise has to be made                 and 3) a meso-scale 3D representation using structured shell
between the level of fidelity and computational resource available         elements (referred as 3DShell hereafter) to model each fibre yarn
for optimisation purposes (Kärger et al., 2018; Henning et al.,           (El Said et al., 2014). It is noted that including forming-induced
2019).                                                                    defects using the selected modelling approaches may lead to
   For multi-ply forming of 2D fabric or compaction/weaving               additional computational cost and very significantly (unfairly)
analyses of 3D woven fabrics, their mechanical properties are             skew the results of this benchmarking exercise against the method
highly influenced by their compacted or formed geometry and                of higher resolution that are more capable of capturing these
tool geometry, because woven fabrics may experience different             defects. To counteract these, mould shapes and forming method
level of compaction load and constraint in a single forming case at       were designed in such way that the occurrence of manufacturing
various locations, and this mesoscale deformation has significant          defects was kept to a minimum. A plain weave fibre architecture
impact on their mechanical performance (Mahadik and Hallett,              forming on simple hemispheric and tetrahedral tool shapes are
2011). Other efforts aiming at explicitly modelling yarn                  used in this study.
interaction within textiles have also been made. These                       Attributes of each selected modelling approach is summarised
techniques include the multi-filament methods (1D truss/beam               in Table 1. The last column of the table summarises the main
element) (Durville, 2005; Miao et al., 2008; Durville, 2010a;             assumption behind the models and their ability or not to account
Yousaf et al., 2018) or other 2D elements structured as fibre              for six basic fabric deformation modes that are known to affect
yarns (El Said et al., 2015; Thompson et al., 2018a) or continuum         the fabric behaviour during forming (Harrison, 2016). The higher
elements (Boisse et al., 2005; Creech and Pickett, 2006;                  the method resolution, the more accurate deformation it can
Charmetant et al., 2011; Gatouillat et al., 2013; Iwata et al.,           capture. These are complemented by a seventh category

Frontiers in Materials | www.frontiersin.org                          2                                    March 2022 | Volume 9 | Article 831820
Sun et al.                                                                                                                      Benchmarking of Textile Forming Simulations

  FIGURE 1 | Modelling framework and chracteristics of each modelling approach used for comparison.

TABLE 1 | Attributes of all modelling approaches selected for comparison. (letters under “Modelling capabilities” refer to list shown in below).

Method                        Scale or                     Name                                  Representation                              Platform           Modelling
                                size                                                                                                                           capabilities

Kinematic mapping         Macroscale             Pin-joint net (Analytical)      Rigid truss and frictionless pin joint (analytical)      Python                     a
Finite element            Macroscale             FEA-PJN                         1D truss element with shared node                        Abaqus/Explicit          a-b-h
                          Macroscale             HypoDrape model                 2D finite elements                                        Abaqus/Explicit        a-b-c-d-h
                          Micro- mesoscale       Multi-Filament (MF) model       1D finite element beam chains                             LS-Dyna             a-b-c-d-e-f-g-h
                          Mesoscale              3DShell method                  Structured 2D finite element                              LS-Dyna             a-b-c-d-e-f-g-h

indicating whether a modelling method can capture the                                    numerical efficiency. Most of them were purpose-built and
interaction with tooling, whilst the first category (that every                           validated by different experiments (with different
technique scores on) just indicates basic draping capability.                            measurement techniques) and materials. Hence, a
Letters on the last column of the table therefore refer to:                              benchmarking exercise with objective measurement of the
                                                                                         different model types’ performance is necessary, challenging
a.   Draping                                                                             and novel. This study, with its detailed and quantitative
b.   Tensile properties along the two fibre directions.                                   comparison of the numerical methods and their comparison
c.   Shear resistance of the fabric sheet.                                               to experiments, helps the modelling selection process for both
d.   Out-of-plane flexural modulus of the fabric sheet.                                   scientists and engineers working on simulation of woven
e.   In-plane flexural modulus of the fabric sheet.                                       composites.
f.   Transverse compressive modulus of the fabric sheet.                                    The manuscript is organised as follows: in Modelling Strategy,
g.   Integrity/cohesion of the fabric sheet.                                             brief background information followed by a brief description of
h.   Interaction with tools.                                                             each simulation method selected for this comparative study is
                                                                                         presented; Experiments and Modelling Setup reports the
   Over the past few decades, many models of composite forming                           experimental work and numerical simulations carried out;
have been developed with different levels of fidelity and                                 finally, Results and Discussions discusses and concludes on the

Frontiers in Materials | www.frontiersin.org                                         3                                                 March 2022 | Volume 9 | Article 831820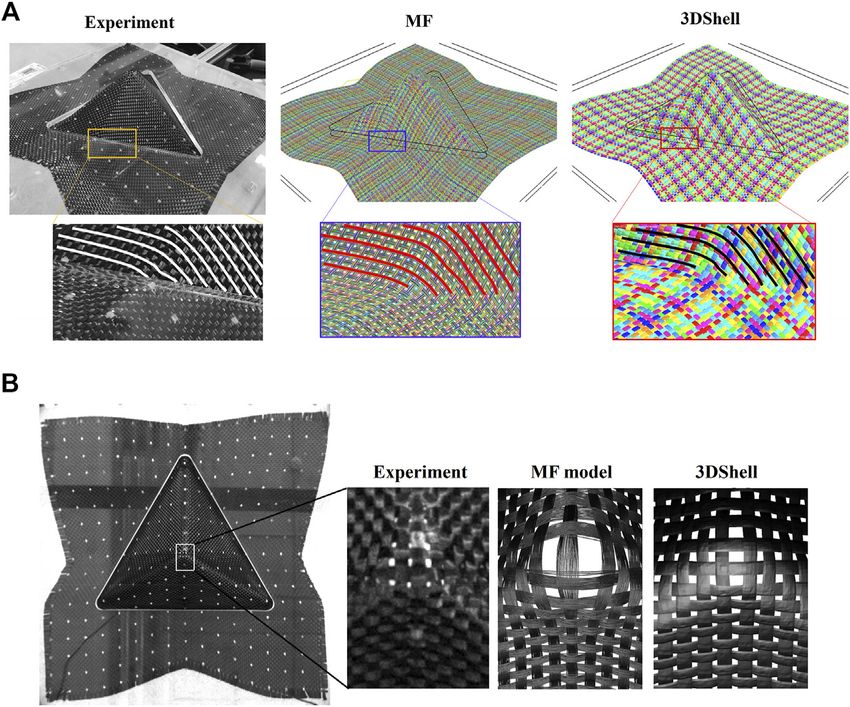
Sun et al.                                                                                              Benchmarking of Textile Forming Simulations

viability and robustness of each modelling technique by                   geodesic lines of the mould surface. There are infinite number of
comparing the results with experimental observations,                     paths that can link any two points on an arbitrary surface domain;
quantitative measurements and computational cost. Attempt at              the path with the shortest length can be defined as a geodesic path
visualising the characteristics of each modelling approach for the        of that surface, which can be derived by numerically solving two
given forming cases have also been made using radar charts.               nonlinear second order differential equations (Ramgulam and
                                                                          Potluri, 2007). Once the generator lines and cell are placed, the
                                                                          remaining PJN grids in all quadrants can be computed
2 MODELLING STRATEGY                                                      subsequently with the constraint of minimising the sum of
                                                                          shear angles in each PJN. The detailed descriptions of an
For completeness, a brief description of each representative              example of kinematic draping model can be found in (Krogh
modelling method is given in this section with background                 et al., 2021).
information and recent developments. Figure 1 illustrates all                As indicated in introduction, in addition to the traditional
modelling techniques at the unit-cell level and the reader should         kinematic draping (i.e., the PJN is analytically formed onto the
return to this when reading the present section. As the initial           tool surface) a FEA-PJN forming model, where the textile was
geometry of the 3DShell and the MF models was processed under             modelled by an assembly of PJN grids (see Figure 1) in Abaqus/
the same framework, the MF and 3DShell models are presented               Explicit, is also considered here. This allows to consider the
together in Micro- and Mesoscale Modelling: MF and Structured             interaction between fabric and tooling and it was expected to
Shell (3DShell).                                                          be more accurate than the kinematic draper. For this model, the
                                                                          Automatic General contact was used with a friction coefficient of
2.1 Kinematic Draping                                                     0.2 to capture the interactions between the fabric PJN model and
Kinematic draping initially emerged several decades ago with the          tooling. The modelling of the forming tools is described later in
purpose of assisting the manual draping process (Mack and                 Experiments and Modelling Setup.
Taylor, 1956; Hancock and Potter, 2006), it has been further
developed in recent decades and is now available in commercial            2.2 Macroscale Model: HypoDrape
software and open-source programmes, such as Fibersim                     As previously mentioned, FE-based numerical models for textile
(Siemens Industry Software Inc, 2021) (with material                      deformation at the macroscale sit between kinematic draping and
deformation capabilities), Interactive Drape (LMAT Ltd, 2021)             the micro-mesoscale modelling approaches and reflect some true
(with user defined interactive forming path), KinDrape (Krogh              physical aspect of the fabrics, with affordable computational cost.
et al., 2021) (with application to optimization of manufacturing          Several mechanical features of the textile are expected to be
process parameters) and SteerFab (Xiao and Harrison, 2021a;               captured, including tension/compression, non-linear in-plane
Xiao and Harrison, 2021b) (for designing steered fibric). Fibre            shear and out-of-plane bending behaviours. During forming
orientations approximated by kinematic draping models are                 simulation, the orientation of the fabric needs to be locally
based on composite fabric mechanical features, i.e. warp and              adapted by the in-plane shear deformation via a material
weft yarns have high moduli and fabrics normally have limited             constitutive model. Interactions between the preform and
resistance to shear. A square PJN trellis that has four rigid sides       tooling and interply interactions are captured by contact
with frictionless pin connector at the four vertices representing         algorithms in commercial finite element packages (Abaqus/
yarns and cross-over points, respectively, resembling an ideal            Explicit in this study).
structure in FEA representations for this approach. Current                  Accurate prediction of woven textile in-plane shear
developments of kinematic draping are found in combination                deformation during forming has two key aspects. Firstly, the
with optimisation processes, application of preform design and            change of fibre directions needs to be adequately tracked in order
hybridisation with other modelling approaches (Sharma and                 to ensure that changes in the anisotropy of the textile material are
Sutcliffe, 2003; Hancock and Potter, 2005; Skordos et al., 2007;          updated with the correct resulting stresses. To ensure this, many
Cherouat and Borouchaki, 2015; Rashidi and Milani, 2017; Xiao             studies have been carried out using user-defined material
and Harrison, 2021a; Xiao and Harrison, 2021b).                           subroutine based on a non-orthogonal constitutive model
    In the current study, an opensource kinematic draping code            under hypo-elastic laws. This concept was initially introduced
developed at Aalborg University was adopted (Krogh et al., 2021).         by Peng and Cao (Peng and Cao, 2005) and was then further
The kinematic draping process starts with correlating an origin           validated and developed in other studies (Boisse et al., 2005; Badel
point on the mould surface and a corresponding origin node from           et al., 2008; Khan et al., 2008; Khan et al., 2010; Peng and Ding,
the preform grid (i.e., a “PJN preform sheet”), which sets the first       2011; Chen et al., 2017; Dörr et al., 2017; Thompson et al., 2020)
constraint in the algorithm and can be seen as the first contact           Secondly, the right combination of finite elements needs to be
point between mould and preform during draping. Initial paths             used. Due to the low level of cohesion between different fibres
following the warp and weft directions from the origin node are           within a yarn and between the yarns themselves (Buet-Gautier
computed from an input “initial draping direction” provided by            and Boisse, 2001), the out-of-plane bending rigidity (low) and the
the user. These two paths form a “cross” in the PJN preform and           in-plane moduli of the textile in the fibre direction (high) are
constrain the following draping shape. They generate a unique             uncorrelated. This phenomenon cannot be represented by
solution and are therefore referred to as generators. These               standard 2D shell elements alone. A method using laminated
generators are created on the mould by correlating them with              shell elements was implemented in commercial FEA platform to

Frontiers in Materials | www.frontiersin.org                          4                                     March 2022 | Volume 9 | Article 831820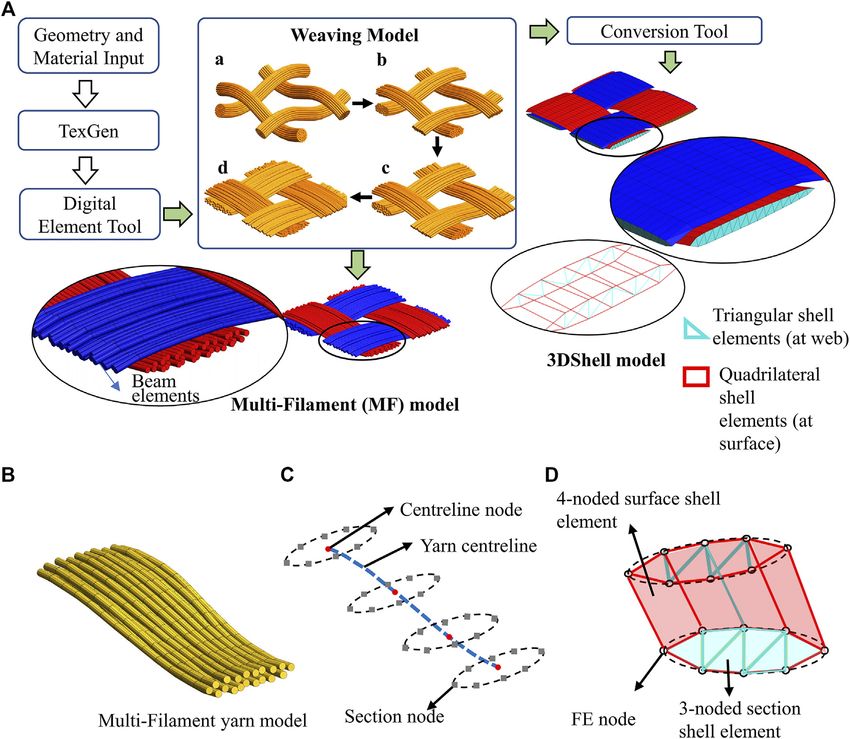
Sun et al.                                                                                                               Benchmarking of Textile Forming Simulations

TABLE 2 | Material input parameters for the respective elements in plain woven fabric HypoDrape model (Thompson et al., 2020). (γ: shear angle in radians).

Element type                           E1 and E2 (MPa)                                         G12 (MPa)                                            Thickness (mm)

Membrane                                       40,000                       32.37 γ 4–59.31 γ3 + 36.36 γ2 -7.394 γ + 0.4576                                   0.5
Shell                                            33                                                0                                                          0.5

simulate forming of biaxial reinforced knitted fabric in (Döbrich                     yarn-scale deformation such as decohesion and yarn local
et al., 2014) and non-crimp fabric in (Yu et al., 2020; Yu et al.,                    buckling or nesting effects (in stacked plies forming) as well as
2021a). This method requires, two fictitious layers at the outer                       typical macroscale deformation. Textile deformation and fibre re-
surfaces of the laminated shell that are used to capture the                          orientation during forming are directly captured by the
bending property of the textile; the middle layer of the shell is                     kinematics of the interlaced yarn that interact through
used to simulate in-plane properties. The desired elastic flexural                     fictional contacts. The model outcomes can be easily processed
rigidity can be obtained by changing the thickness of the shell’s                     to predict mechanical properties, permeability of the final part or
layers. Other approaches have used 1D elements (Sharma and                            to simulate other manufacturing processes (Loix et al., 2008;
Sutcliffe, 2003) in combination of shell or membrane element                          Komeili and Milani, 2012; El Said et al., 2015; Thompson et al.,
with shared or offset nodal connectivity to capture basic fabric                      2017; Bodaghi et al., 2019; Liang et al., 2019). To derive yarn
deformation can be found at (Harrison, 2016; Harrison et al.,                         geometrical characteristics, it is common practice to use pre-
2011; d’Agostino et al., 2015).                                                       processing software, such as TexGen (Sherburn, 2007) or
   The method used in the present contribution uses                                   WiseTex (Verpoest and Lomov, 2005). Work using fully
superimposed and mutually constrained membrane and shell                              digitised information directly taken from physical specimens
elements that share the same nodes. In this way, in-plane                             such as micrographs or 3D μCT (computed X-ray
behaviour is governed by membrane elements, while the out-                            microtomography) scans has been presented in (Liu et al.,
of-plane behaviour is controlled by shell elements. Both set of                       2017; Wijaya et al., 2020).
elements use a hypo-elastic material model (HypoDrape)                                   Higher resolution modelling whereby fibre bundles are
previously implemented in (Thompson et al., 2020) and based                           explicitly modelled can also be achieved. The technique is
on the algorithm presented in (Khan et al., 2008). The non-linear                     called the digital element method models were originally
shear behaviour prescribed to the membrane elements was                               developed to determine the microscale geometry of textile
consistent with picture frame shear tests presented in                                fabrics (Wang and Sun, 2001; Zhou et al., 2004; Wang et al.,
(Hancock and Potter, 2006). The shear modulus in the shell                            2010). This modelling concept was further developed for
elements was set to zero. The Young’s modulus in the shell                            capturing deformation of complex textile under compaction
elements was back calculated from the flexural rigidity observed                       and during weaving processes, in which the fibre bundle was
in a simple cantilever test, similar to that in (Kärger et al., 2018)                 modelled by chain of 1D beam elements with shared nodes.
from equation D  Eh
                         3
                       12 , where D is the flexural rigidity per unit                  Numerical models using this approach sit in between
width from experiment; E is the Young’s modulus and h is the                          computational micromechanics and meso-mechanics (Múgica
thickness of the shell element. A complete model validation and                       et al., 2019) and are referred to as micro-mesoscale modelling
experimental results can be found in (Krogh et al., 2021). The                        or multi-filament (MF) method in the rest of the text. The
overall set of material input properties for the membrane and                         deformation of the mesoscale and MF models rely heavily on
shell elements is listed in Table 2. The constitutive behaviour of                    the contact algorithms that control the interactions between yarns
the textile was implemented in a VUMAT material subroutine in                         (in mesoscale models) and bundles of fibre in yarns (in MF
Abaqus/Explicit made freely available on the Bristol Composite                        models).
Institute (BCI) Github page https://accis.github.io/HypoDrape.                           These two modelling approaches are computationally
Access to the repository can be requested by e-mailing bci-                           expensive and are, therefore, normally applied at the unit cell
github@bristol.ac.uk. Forming models performed using this                             level. However, the heterogeneity of complex woven material and
approach and based on algorithm presented by Khan et al.                              non-periodic boundary condition given to the material during
(2008) are referred to as “HypoDrape” models in the rest of                           complex loading scenarios such as forming are impossible to be
the manuscript.                                                                       captured by unit cell approach without compromising the level of
                                                                                      detail in the model. Moreover, tool geometric features (especially
                                                                                      whose size is similar to the size of the unit cell) and interactions
2.3 Micro- and Mesoscale Modelling: MF                                                between tooling and fabrics determine the final geometry of a
and Structured Shell (3DShell)                                                        compacted or formed part and, in turn, the mechanical
Mesoscale models consider the constituent of the textile as sets of                   performance of a component. Therefore, there is need to
interlaced yarns and fully reflect the true yarn architecture and                      explore the viability of using these modelling approaches to
fabric weaving structure. These models usually use 3D solid                           simulate the forming of an entire fabric sheet and/or a ply stack.
structural elements arranged in such way that an individual                              With this in mind, a multiscale modelling framework
yarn has a lenticular or elliptical shape cross-section (like real                    developed and implemented at Bristol Composite Institute is
physical yarns and tows). Mesoscale models can capture textile                        used in this study. As shown in Figure 2, micro-mesoscale and

Frontiers in Materials | www.frontiersin.org                                      5                                           March 2022 | Volume 9 | Article 831820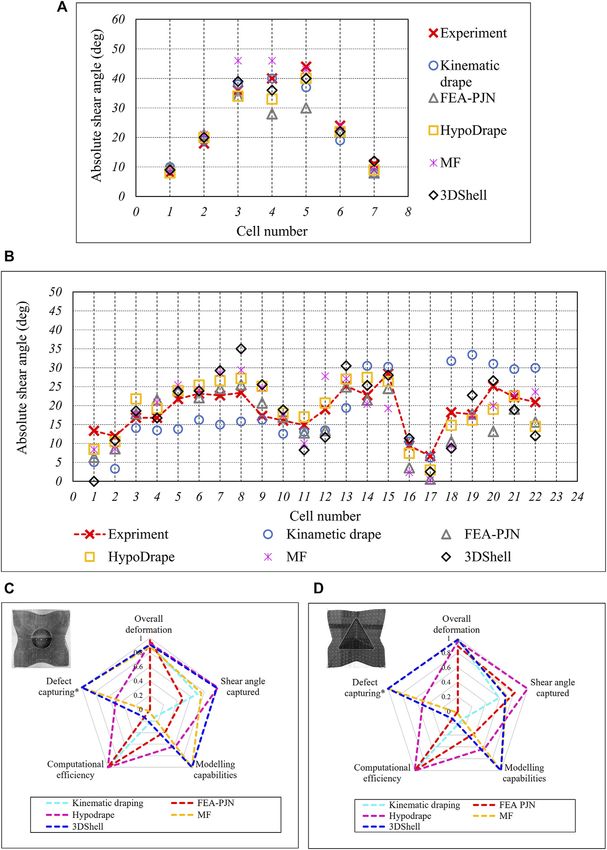
Sun et al.                                                                                                                       Benchmarking of Textile Forming Simulations

  FIGURE 2 | (A): Multiscale modelling process of 2D woven fabric geometric modelling from weaving model to multi-filament and 3DShell model (Mahadik and
  Hallett, 2010a; Green and Long, 2014). (B): The MF model of a single yarn in unit cell size. (C) Yarn geometry representation and (D) yarn cross section FE representation.

mesoscale geometric models of 2D textile were generated. A                                 loose geometry of the textile unit cell as an input file for the
description of the framework (that was originally designed                                 explicit FE solver LS-Dyna. This is illustrated in Figure 2A (see
(Mahadik and Hallett, 2010a; Green and Long, 2014) for                                     “a-d” in weaving model). In the Figure, the initial yarn cross
simulating 3D woven fabrics and nesting effects of multi-ply                               section shape is circular, and each fibre yarn is represented by 36
forming) is concisely restated here, but greater details can be                            beam element chains; fibre yarns follow the centrelines that are
found in the previous publications (Mahadik and Hallett, 2010a;                            offset from those in TexGen in order to accommodate for the tow
El Said et al., 2014; Green and Long, 2014; Thompson et al., 2017).                        cross section. It is worth noting that it is unrealistic to simulate
    As illustrated in Figure 2A, geometric models of a 2D woven                            individual fibres even at the unit cell level as the high number of
fabric are given as an input to the creation of 1D element-based                           chains would significantly increase the computational cost
multi-filament models that can be used to build a 3DShell model.                            (without obvious positive effect on simulation quality (Green
This was done using the open-source textile modelling software                             and Long, 2014)). Once the loose geometry of the textile’s unit cell
TexGen (Sherburn) to which a basic description of the textile                              model is obtained, appropriate boundary conditions are applied,
architecture (e.g., weave style and yarn spacing) was given as                             which consider the effect of adjacent cells on periodicity and the
input. Essential information in the building block of the textile                          variety of unit cells from the same textile (see (Thompson et al.,
geometry model, that are the yarn centrelines, can then be                                 2017) for more details).
extracted from TexGen and imported to an in-house                                              Bending behaviour, as an important deformation mechanism
MATLAB code which allows the end-user to define the shape                                   of textile materials during forming, is controlled by the fibre tow/
of the yarn cross section and the number of beam elements in it.                           yarn bending and yarns’ interaction. To capture this deformation
With this information, the code automatically generates an initial                         mechanism a methodology was developed in which beam

Frontiers in Materials | www.frontiersin.org                                           6                                              March 2022 | Volume 9 | Article 831820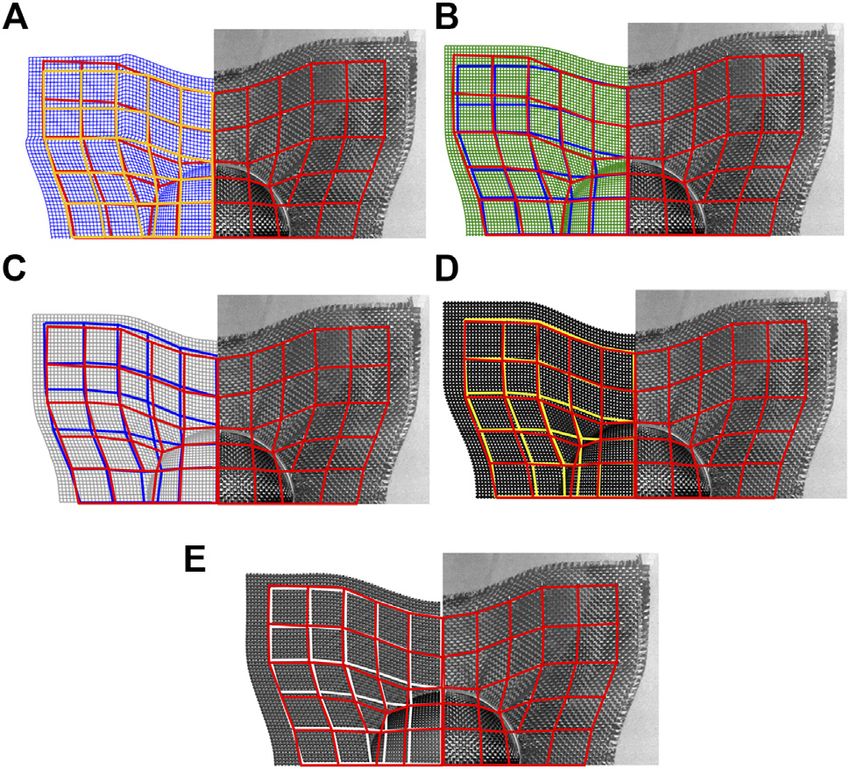
Sun et al.                                                                                                       Benchmarking of Textile Forming Simulations

TABLE 3 | Material properties of beam elements in the MF model (Green and          this method can be found in (El Said et al., 2014; Thompson
Long, 2014) and shell elements in the 3DShell model (El Said et al., 2014;
                                                                                   et al., 2018a).
LSTC. LS-DYNA, 2021).
                                                                                       The process of converting a MF unit-cell into a meso-scale
Element                                        Property (unit)         Value       model is illustrated in Figures 2B–D. It can be seen that the yarn
                                                                                   cross section is defined by section nodes surrounding each
Beam element                         Young’s Modulus (MPa)               20
                                     Yield stress (MPa)                  40        centreline node. The conversion process starts from
                                                                                   generalising the as-woven geometry in the MF unit cell model
4-noded surface shell element        Shear modulus (N/mm2)               5
                                     Tangential modulus of              100
                                                                                   (see single yarn MF model in Figure 2B). To reduce resolution in
                                     elasticity (N/mm2)                            the yarn direction, the number of nodes along the centreline is
                                     Bulk modulus (N/mm2)               200        reduced based on yarn path curvature and beam element length.
                                     Yield strength (N/mm2)              60        Then, the number of section nodes representing the yarn cross
3-noded cross-section shell          Initial shear modulus (N/mm2)       25        section at each centreline node is reduced. In the example shown
element                              Infinite shear modulus (N/mm2)       50        in Figures 2B–D, 8 section points are used at each centreline
                                     Decay constant                     0.1
                                                                                   node. These 8-noded section definitions, with neighbouring
                                     Bulk modulus (N/mm2)               200
                                                                                   sections, can be used to construct structural 4-node shell
                                                                                   elements (ELFORM_16 in LS-DYNA), as that shown in
                                                                                   Figure 2D, that represent the yarns’ surfaces. By connecting
                                                                                   the 8 nodes in each section, 3-node triangular shell elements can
element in each chain was assigned an elastic, perfectly plastic                   be built. The obtained meso-scale models where yarns are
material model (PLASTIC_KINEMATIC in LS-DYNA) to                                   modelled by structured shell elements are named “3DShell” in
approximate the tow bending, as well as to simulate the                            the rest of this study. The 3DShell unit-cell model is further
“drawing in” of yarns from beyond the unit cell in real fabric                     processed to form a complete sheet of textile, ready for forming
(Mahadik and Hallett, 2010b). The material parameters of the                       simulation in LS-Dyna. During forming simulation, the surface
beam elements in MF models are listed in Table 3. This method                      shell elements are designed to represent the interaction between
was proven to be effective in a number of studies (El Said et al.,                 yarns and between yarns and the tooling. They also help control
2014; Green and Long, 2014; El Said et al., 2015; Thompson et al.,                 the yarn’s flexural behaviour. As described in Macroscale Model:
2017). Interaction of the yarns is captured by contact between                     HypoDrape, the internal formulation of standard shell elements
beam element chains within a fibre yarn (intra-yarn) and between                    prevents the in-plane and bending stiffness to be uncoupled.
fibre yarns (inter-yarn). An AUTOMATIC_GENERAL contact                              Hence, using shell elements only at the yarn surface would not
with coulomb friction coefficient prescribed as 0.2 was used in LS-                 allow to correctly capture both the cross-section deformation and
Dyna models to capture the interaction of chains of beam                           the flexural behaviour of the yarns. This limitation is overcome
elements.                                                                          through the use of the triangular elements filling up the cross-
   An accurate representation of the textile weave geometry is                     sections (see in blue in Figure 2D) that resist excessive
then created, by compacting the loose yarns of the textile unit cell               deformation and collapse of the cross-sections. Forming is an
between 2 rigid surfaces (with appropriate periodic boundary                       irreversible process. Hence, by the fibrous nature of textiles, yarns
conditions). A negative thermal coefficient and a fictive                            sliding or compaction are not restored by simple removal of the
temperature ramp is applied to the models in order to                              applied force. To account for that and better computational
contract the beam element chains simulating yarn tension                           efficiency, the surface shell elements in the 3DShell model are
during weaving, this draws the textile together to achieve a                       assigned an elastoplastic (MAT 12 in Ls-Dyna) material
virtual representation of the as-woven textile meso-structure.                     behaviour (El Said et al., 2014), and a viscoelastic material
The actual fibre length of the as-woven textile can be                              model (MAT 6 in Ls-Dyna) is used for the cross-sectional
approximated from the knowledge of the textile areal weight,                       support triangular elements (Bickerton et al., 2003). The
fibre count, fibre radius, density and unit cell size (an assumption                 material parameters used are listed in Table 3.
that all fibres are perfectly straight and aligned is made). To create                  Both the meso-scale (i.e., 3DShell) and the MF models are
MF fabric models (in preform size for forming simulation) from                     derived from the same modelling framework and weaving
the unit cell, an in-house post-processing code is used to tessellate              simulation were compared with other modelling approaches
the unit-cell model.                                                               for 2D fabric sheet forming. Their respective computational
   As illustrated in Figure 2A, a robust post-processing tool                      cost and predictive capabilities were then quantified and
that converts the MF unit cell model (in a micro-/meso-scale                       assessed.
representation) to a computationally more efficient meso-
scale unit-cell has also been developed. The method was
validated for a complex forming of a 3D woven orthogonal                           3 EXPERIMENTS AND MODELLING SETUP
fabric in (El Said et al., 2014). The relevant parameters in this
validation process were expected to be adequate to model                           Throughout this study, a simple 2D plain weave material, the
punch forming of a single 2D woven fabric, therefore are                           specification of which is listed in Table 4, is used. As discussed in
adopted here. Instead of elaborating a full description of this                    Macroscale Model: HypoDrape and Micro- and Mesoscale
methodology, key steps are introduced here, and the details of                     Modelling: MF and Structured Shell (3DShell), material

Frontiers in Materials | www.frontiersin.org                                   7                                     March 2022 | Volume 9 | Article 831820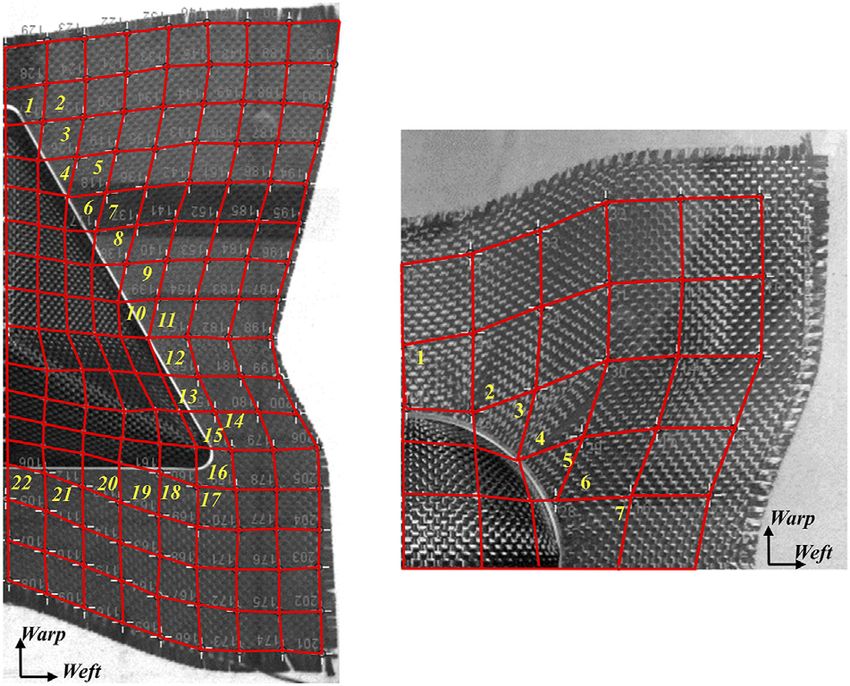
Sun et al.                                                                                                                   Benchmarking of Textile Forming Simulations

TABLE 4 | Measured test case material information.

Weave style                     Areal weight (gsm)                    Picks/ends per cm                             Fibre                            Fibre diameter (μm)
                                                                                                             count per tow/yarn

2D Plain                                 320                                  3.85                                   6,000                                     7

  FIGURE 3 | Dimensions of (A) hemispheric and (B) tetrehedron mould; (C) Exlpoded view of punch forming setup; (D) Snap shots at the rspective postion of the
  differrent components of the setup at the beginging and the end of the punch forming process. (E) General dimensions of the hemispheric punch; (F) General dimensions
  of tetrahedral punch.

properties used in the HypoDrape, MF and 3DShell models have                                Fabrics were formed onto both a hemispheric and a tetrahedral
been previously validated at both the unit-cell and the preform                          mould, the dimensions of which are given in Figures 3A,B. The
(or laminate) levels by comparing model predictions to                                   hemisphere is axis-symmetric and provides, during forming, a balanced
experimental data.                                                                       tension radiating from the centre of the contact region to the rest part of

Frontiers in Materials | www.frontiersin.org                                         8                                            March 2022 | Volume 9 | Article 831820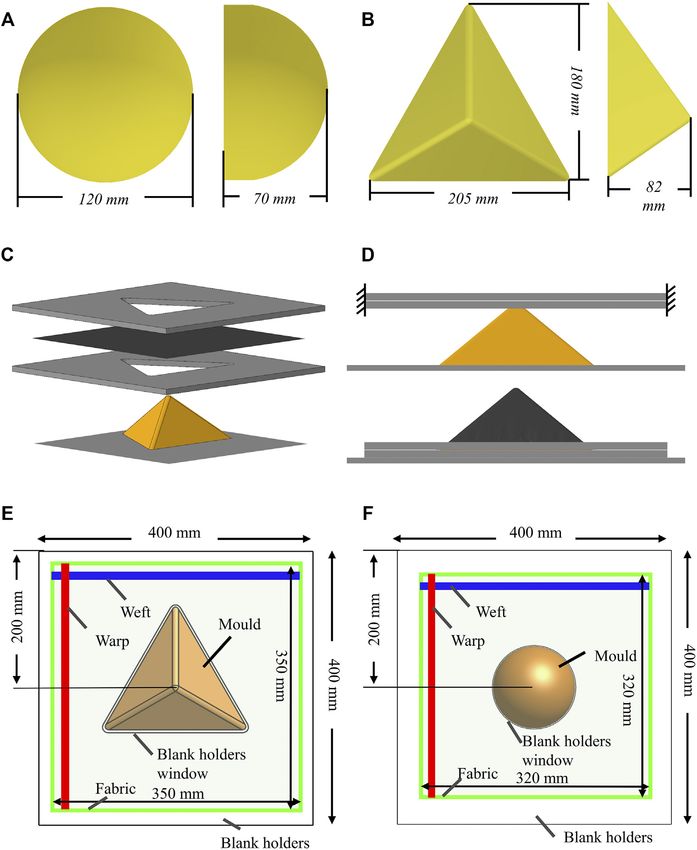
Sun et al.                                                                                                           Benchmarking of Textile Forming Simulations

the fabric. Therefore, it was expected that all the modelling approaches
will yield similar outcomes. On the other hand, the tetrahedron mould
is doubly symmetric and combines some geometrical features of cubic
and prism. Forming over tetrahedron might present some challenges to
the kinematic draping method and even for some highly-detailed
modelling approaches (Allaoui et al., 2014).
     The fabric was draped over the selected shapes via punch forming.
Punch forming is a forming process whereby a preform is sandwiched
between two blank holders and a mould is pushed through holes
created in the blank holders in order to form the fabric. Displacement
(i.e., a fixed distance of 0.5 mm (textile thickness) was kept between the
blank holders) rather than pressure-controlled loading was used. This
way, the in-plane movement of the fabric was only restricted by the
friction exerted by the blank holders. This relaxed boundary condition
was designed so that fabric can only deform through in-plane shear.
The blank holders together with the fabric in between can then be
displaced onto the mould until the lower blank holder rests on top of
the flat supporting surface of the mould.
                                                                                 FIGURE 4 | Iamges of half view of formed fabric in tetrehedron forming
     Figures 3C–F show a schematic representation of the
                                                                                 (left) and quarter view of hemisphere forming (right). White dots on fabrics are
experimental setup and of the boundary conditions applied in the                 joint by red lines to form cells contraining a number of fabric unit cells.
FE models. In the models, a rigid material property was assigned to              Measuring cells are mark with numbers.
the blank holders, mould and the supporting surface of the mould.
The blank holders were spaced 0.5 mm apart and fully constrained,
and the mould (with flat rigid surface) was given a prescribed motion            fabric. This is then used to assign the unit-cell’s size in the MF and
of 1 mm/s displacement rate to move into the blank holders’                     3DShell models, the distance between the points on the grid in
windows until the bottom of mould reaches to the gap between                    kinematic drape models, the FEA-PJN models and the element
the two blank holders. As is common practice for quasi-static                   size in the HypoDrape models.
analysis in explicit finite element simulations, the material                        It has been reported that the number of beam element chains
densities of all parts were scaled up (by 1 × e3) to reduce                     to predict the best possible unit cell geometry of a complex 3D
computational cost. An AUTOMATIC_GENERAL contact was                            weave without excessive computational cost is 61 (Green and
used in LS-Dyna models (the MF and the 3DShell models) and                      Long, 2014). However, 61 chains, with 13 beam elements, results
general contact was defined for all parts in Abaqus models (the                  in nearly 4,800 degrees of freedom per tow to be solved in a unit-
HypoDrape and the FEA-PJN models). In all the models, a static                  cell. Using MF models with 61 beam element chains in each yarn
coulomb friction coefficient of 0.2 between fabric and forming tools             would require too much computational capability. For modelling
was applied. This value should be kept low as the amount of friction            less complex textile, a fewer number of beam chains was also
for the given fixed gap between blank holders should not provide                 suggested (Daelemans et al., 2016). Therefore, a more pragmatic
enough force to deform the fabric. In the experiments, blank holders            approach was adopted. The yarn width of the MF model was,
were made from transparent acrylic sheet. White dots were drawn                 therefore, made slightly less than the 3DShell case. 13 element
on the fabric so that the general deformation of the fabric could be            chains per yarns were used in the present. Negative impacts of
measured via photographs taken directly above moulds’ centre                    this could be reduced accuracy in capturing shear locking and,
points.                                                                         consequently, a delayed wrinkle formation due to the additional
     The FEA-PJN and HypoDrape models were processed using 16 ×                 void between yarns. To achieve higher accuracy of tow
2.6 GHz SandyBridge cores with 64GB/node RAM on the University                  interaction, the yarn cross section of the 3DShell model used
of Bristol’s high performance computer cluster (BlueCrystal phase               here was generated from a similar MF model but with optimal 61
3 - https://www.bristol.ac.uk/acrc/high-performance-computing/).                beam element chains per tows.
The MF and 3DShell models, due to their sizes, required high
memory processors (16 × 2.6 GHz SandyBridge cores with 256GB/                   4.2 Experimental Measurements
node RAM). The kinematic draping models were processed on a                     Photographs of the top view of each experiment were taken, and
single processor in a desktop workstation as they do not consume                the white dots drawn on the deformed fabric were measured in
high computational resource.                                                    image processing software (ImageJ (Rasband, 2007)). As the
                                                                                tetrahedron and hemisphere are respectively doubly and
                                                                                quarterly symmetric, only half and quarter of the image was
4 RESULTS AND DISCUSSIONS                                                       analysed. The marked dots were joined to build grids that
                                                                                contain several textile unit cells (see Figure 4). To avoid
4.1 Model Construction                                                          distortion on the 3D shapes in the 2D images, shear angles
The yarn spacing (2.6 mm) of the textile used in this study can be              were measured in grids around the flat shape transition region
calculated from Table 4 or from direct measurement on the                       instead of on the 3D surfaces, as shown in Figure 4. This metric on

Frontiers in Materials | www.frontiersin.org                                9                                             March 2022 | Volume 9 | Article 831820
Sun et al. Benchmarking of Textile Forming Simulations FIGURE 5 | Overviews of overall deformation of experimetnal and all modelling resutls in (A) hemispheric forming and (B) Tetrahedron forming. Profiles of the boundary of top blank holder window and deformed fabric are marked in red and are overlaid to all modelling for comparison purpose. general fabric shear deformation at the shape transition between designed to be ideal and under perfect boundary conditions mould and flat surface as well as the profile of the entire textile and processing constraints. Unless a fully digitised experiment (reflecting the overall shear deformation) were used to in place, where multiple specimens of the same test case are used systematically compare the models with the experiments. and discrete points on specimen are tracked before and after Variabilities from textile manufacturing processes and forming with respect to a fixed point in space, it is reasonable to forming tests exist and inevitable, which leads to experimental ignore the manufacturing and forming process variabilities in a scatter and the formed geometry of the textile specimens not single specimen test case. Therefore, it is reasonable that exactly following the symmetry of the mould. This actual experimental results of half of the formed fabric in the specimen and process variability is neglected in general tetrahedron forming and a quarter of the formed fabric in the purpose numerical modelling where preform models are hemisphere forming were considered. Frontiers in Materials | www.frontiersin.org 10 March 2022 | Volume 9 | Article 831820
Sun et al. Benchmarking of Textile Forming Simulations
In this later section, modelling results are compared with
experimental results in three different aspects: overall
deformation of the fabric; fibre orientation and detailed
features. An attempt is then made to visualise the overall
modelling performance with proposed metrics. Computational
efficiency is accounted for in the evaluation.
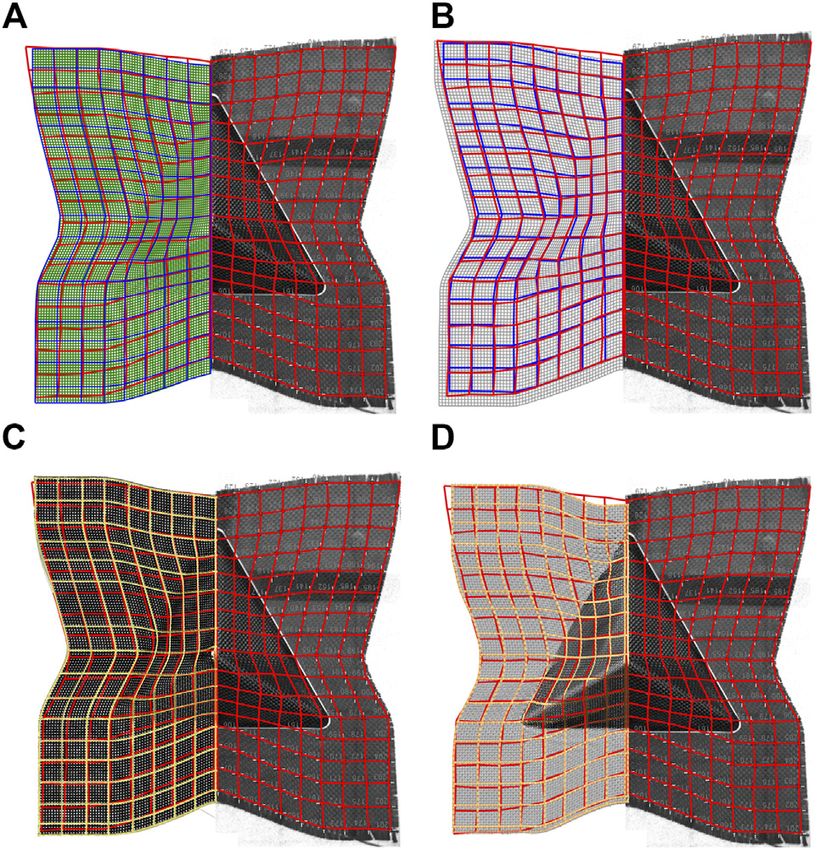
4.3 Overall Deformation
Figures 5A,B collectively compare the overall deformation
between specimens and all modelling results from
hemispheric and tetrahedron forming, respectively. Specimen
profile and the profile of the top blank holder window of each
forming test are marked in red, and these two profiles are
overlaid to all modelling results in each forming case.
Although the textile was constrained by blank holders (see
Experiments and Modelling Setup) in the hemispheric forming
experiment, out-of-plane deformation of the textile still
happened due to the lack of constraining around the mould.
Because shear deformation of the fabric in the tetrahedron
forming test was less than the hemispheric case, similar
observation was not found in the tetrahedron forming. FIGURE 6 | Comparison of the predicted formed fabric profiles with
Nevertheless, these wrinkles seem to be at the early stage and experiment resutls in (A) the kinematic draping model (profile marked with
yellow lines), (B) the FEA-PJN model (profile marked with blue lines), (C) the
should not significantly affect the model comparison, as shown in HypoDrape model (profile marked with blue lines), (D) the MF model
Figure 4. In general, all five models captured the overall (isolated yarns coloured in yellow), and (E) the 3DShell model (isolated yarns
deformations of the textiles in both forming cases very well, coloured in white) for hemispheric forming. Deformed profile of the specimen
except for the kinematic draping model in the tetrahedron (only quarter of which is shown) indicated by red lines at the RHS is overlaid to
forming. It was a reasonable result as the outcome of the the deformed profile of fabric model shown at the LHS.
current kinematic draping algorithm is significantly influenced
by the selection of the origin point and initial fibre paths. For the
hemispheric forming case where initial fibre paths (warp and offered the best results in capturing overall deformation.
weft directions) set in kinematic draping were aligned with the Prediction of overall deformation of the textile under forming
axes of symmetry of the hemisphere, the draping result is is subsequently used as one of the metric parameters in the
comparable to the FE-based methods (see Figure 5A). By modelling performance comparison. It is also noticeable that,
contrast, the kinematic draping model fell short of capturing except for the mesoscale and micro-mesoscale models, most of
the actual forming sequence and forming kinematics in the the simulations fell short of capturing accurate shear
tetrahedron forming, where the fabric should land on the deformation at the corners of the specimens in both forming
three faces of the mould at the same rate (see Figure 5B). On cases, as shown in Figure 5. This is due to the fact that the
the other hand, the FEA-PJN models, using similar assumptions material is discontinued and fibre yarns are easily able to slide at
as kinematic draping but implemented in finite element the textile boundaries, which can be an important behaviour to
framework and considering interaction with tooling, presented simulate for near net-shape preform design and where the MF
a much better results for the tetrahedron case and produced and 3DShell modelling approaches are needed.
similar results to the HypoDrape models in both forming cases.
This is because the in-plane shear stiffness of the actual textile is 4.4 Fibre Orientation
insignificant for small shear angles and the modulus of the truss Nodes were marked in the fabric model in each simulation at
elements in the FEA-PJN models together with node/surface similar locations to those points drawn on the specimens before
friction contributed some resistant to shear deformation. forming, and these nodes were joined by lines in each deformed
Predictions of the overall formed textile shape by the fabric model to compare with experimental results. Comparison
HypoDrape models are in good agreement with both of the grids predicted by each modelling strategy against the
experimental results. During tetrahedron forming, it was experimental results are shown in Figure 6 and Figure 7 for the
difficult to control the alignment between textile and the hemispheric and tetrahedron moulds respectively. As the
mould centre, and the first contact point between the mould’s kinematic drape model was not able to capture the overall
apex and fabric may lead to slightly different deformation shapes. deformation of the fabric on the tetrahedron, it was excluded
Deformation along one direction can be slightly higher if the first from this comparison.
contact point lands exactly at a fibre yarn, which was believed to Good correlation of fibre orientation between all model
be the reason why all models underestimated the top edge results and test results can be found in the hemisphere
deformation of the textile in tetrahedron forming, as shown in forming case (see Figure 6). However, slight mismatches
Figure 5B. Among all models, the MF and 3DShell models between the experimental and modelling grids were found in
Frontiers in Materials | www.frontiersin.org 11 March 2022 | Volume 9 | Article 831820Sun et al. Benchmarking of Textile Forming Simulations
an important mechanism to capture for more accurate local
fibre orientation predication at abrupt shape transitions.
4.5 Detailed Features
For a given material, detailed features of the deformed fabric can
be generated from the incompatibilities of radius of tooling,
boundary conditions and key process parameters or in
combination, which leads to irregularities in local fibre
architectures at surface contours or features of the mould.
These detailed features are not normally captured by
macroscale modelling and have to be simulated by models
with higher fidelity that are capable of capturing yarn/yarn
and yarn/tooling kinematics. In the tetrahedron forming case,
due to its unique shape, the textile was under shear deformation
in different directions at each face of the mould. Figure 8A
compares the detailed fibre orientation between experimental and
numerical results from the MF and the 3DShell models at the
shape transition between the bottom of the tetrahedral shape and
the flat surface, this region was considered to be the most complex
part and is involved intra-yarn, inter-yarn and textile/tool
interactions. It can be found that the re-orientation of fibres in
both models is in good agreement with experimental results, as
shown in Figure 8A, which further validates the modelling
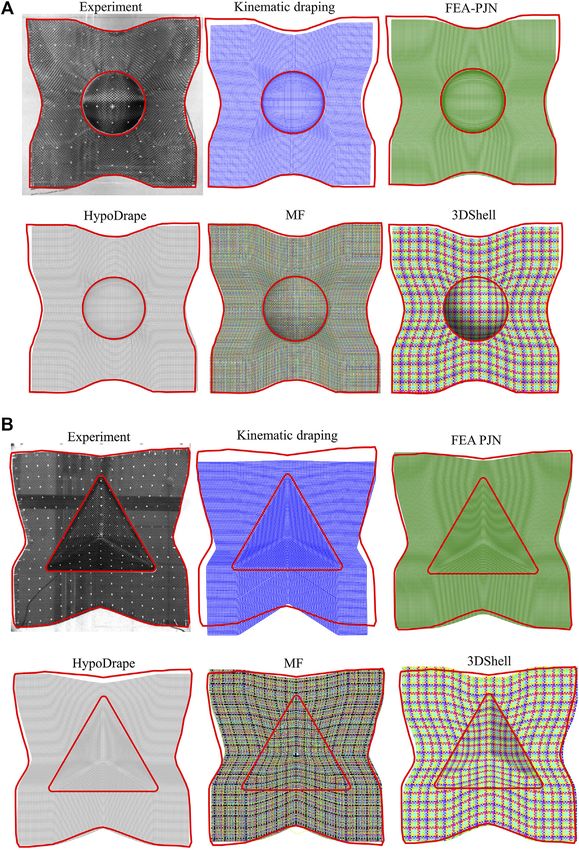
FIGURE 7 | Comparison of the predicted formed fabric profiles with
experiment resutls in (A) the FEA-PJN model (profile marked with blue lines),
techniques and key parameters used for these interactions.
(B) the HypoDrape model (profile marked with blue lines), (C) the MF model The effects of mould shape on textile integrity become more
(isolated yarns coloured in yellow), and (D) the 3DShell model (isolated significant if the mould’s features are prominent and if their size is
yarns coloured in white) for tetrehedron forming. Deformed profile of the in the same order of magnitude as the unit-cell size of the
specimen (only half of which is shown) indicated by red lines at the RHS is
preform. In the tetrahedron forming case, the forming force
overlaid to the deformed profile of fabric model shown at the LHS.
applied by the apex of the mould to the centre of the weave in
a small area (see Figure 3B) and can force yarns just above it to
separate. Figure 8B shows close-up image of the experimental
the HypoDrape and the FEA-PJN model, as shown in Figures results with focus on the textile on top of the tetrahedron mould
6A,B. These deformation mismatches are much improved in apex after forming, and it can be found that the yarn spacing
models with higher fidelity as shown in Figures 6C–E. The increases as a result of yarn sliding along the mould surface due to
measured shear behaviour of the fabric was given as an input to the high forming pressure. Alongside the experiment results,
the HypoDrape model (see Table 2) whilst yarns and their simulation results at the same location from the MF and the
interactions are explicitly modelled in the both the MF and 3DShell models are also presented in Figure 8B. A slightly
3DShell models. Nevertheless, it is worth noting that the different scenario was found in the MF model in that the
modelling capability of the FEA-PJN models provides fairly central yarn landed precisely on top of the mould apex
good predictions and close to the HypoDrape models in both throughout the forming simulation and undertook most of the
forming cases, as shown in Figure 6B and Figure 7A. By forming force, hence it was under compaction loading. In
contrast, the MF and 3DShell models predicted both overall Figure 8B, it is clear that significant yarn spreading is
deformation and local fibre orientation very well for both captured by the MF model. However, the amount of yarn
forming cases, as shown in Figures 6D,E and Figures 7C,D. spreading and sliding are overpredicted in this case due to the
The maximum deviation of local fibre orientation between the oversized yarn spacing in the MF model (for computational
models and the test results is always observed at the shape efficiency purpose) as depicted in the beginning of Results and
transition region for both the hemispheric and tetrahedron Discussions. In addition, it is also found that the 3DShell model
cases. It is believed to be caused by the local interaction captured a small amount of yarn sliding, the magnitude of which
between the opening of the upper blank holder and the agrees better with the experimental results.
fabric in testing where the edge of the opening affected the In macro-scale modelling, continuous finite elements with
local fibre orientation. The other reason is the wrinkle onset at user defined material properties (HypoDrape model in this
the hemispheric forming shape transition, due to lock of blank work) representing the textile provides informative results.
holder pressure (see Experiments and Modelling Setup and Shear angle is usually assessed against locking angle which
Figure 4). These deviations were reduced or even avoided by indicates the occurrence of out-of-plane deformation and
the MF and the 3DShell models, as shown Figures 6D,E, which onset of defects. Figures 9A,B present shear angle contour
may also imply that the interaction between tooling, i.e. mould plots of HypoDrape models for the hemispheric and
top and the edge of top blank holder opening, and fibre yarns is tetrahedron forming. Numerical variabilities from solving the
Frontiers in Materials | www.frontiersin.org 12 March 2022 | Volume 9 | Article 831820Sun et al. Benchmarking of Textile Forming Simulations
FIGURE 8 | Close up image of the formed fabric in experiment, the MF model and the 3DShell model in tetrehefron forming at (A) shape transisiton region and (B) at
the apex of the mould.
contact process exist in the finite element platforms, and the 3D contoured surfaces may not be sufficiently reliable for un-
shear angle contour plots of both forming simulations are not instrumented tests. Therefore, for quantitative comparison, shear
entirely symmetric as their mould geometry. However, the angles at those cells of specimens on the 3D mould surfaces were
maximum shear angle at each quadrant or side is similar and not considered. Only the shear angles around the shape transition
close to the shear lock angle (45o found in (Thompson et al., regions on the flat surface and near the opening of upper blank
2020)) in hemispheric forming, which correlates well with holder (see Figure 4) were considered and these were then
experimental observations of wrinkles (see Figure 5). The compared with the modelling results. Each cell from which the
shear angle predictions from kinematic draping in measurements were taken were numbered as shown in Figure 4.
hemispheric and tetrahedron forming are also presented in In total 22 measurements on the tetrahedron and 7 on the
Figures 9C,D; and it can be found that the size and hemisphere specimen were taken. These grid lines (and
magnitude of the high shear regions at each quadrant and measuring cells) in the experimental results, representing fibre
shear-free region at textile corners are in very good agreement orientation (and shear angle) at the shape transition regions, were
with the HypoDrape model in hemispheric forming case, despite then compared with modelling results shown in Figure 6 and
some localised shear bands around the high shear regions. The Figure 7.
kinematic drape model appeared to be capable of approximating Figures 10A,B compares local shear angle of the formed
high shear regions for axis-symmetric mould shapes but not textile between experimental and modelling results from all
perfectly suited for irregular shape such as tetrahedron (see simulations for the two mould geometries. In general, all
Figure 9D). models capture the variation of shear angle in the hemisphere
forming case. The greatest difference between experiment and
modelling is in cells cell 3 to 5 of hemispheric forming where the
4.6 Quantitative Comparison and shear deformation is the highest and where slight out-of-plane
Performance Metrics of Modelling deformation was observed experimentally. The slight
As shown in Figure 6 and Figure 7, textile specimens were overestimations from the MF model at cell 3 and 4 may be
partitioned into a number of grids/cells by joining grid points due to the slightly larger yarn spacing in the MF model reported
previously marked on them. These continuous cells were then before (Figure 10A).
used to quantify the amount of fibre re-orientated during For the tetrahedron forming case (see Figure 10B), most of the
forming, i.e., shear angle, at discrete locations. Image-based models predicted the overall trend in the variation of the shear
measurement of fibre orientation taken from specimens on the angle accurately. This is particularly true at the locations where
Frontiers in Materials | www.frontiersin.org 13 March 2022 | Volume 9 | Article 831820You can also read