DRAFTKINGS INVESTOR DAY - MARCH 2022 - Investor Relations (DKNG)
←
→
Page content transcription
If your browser does not render page correctly, please read the page content below

DRAFTKINGS
INVESTOR DAY
MARCH 2022

               | 1
Legal disclaimer
No Offer or Solicitation

This presentation does not constitute a solicitation of a proxy, consent or authorization with respect to any securities of DraftKings Inc. (“DraftKings”, “the Company”, “we” or “us”). This presentation
also does not constitute an offer to sell or the solicitation of an offer to buy securities, nor will there be any sale of securities in any state or jurisdiction in which such offer, solicitation or sale would
be unlawful prior to registration or qualification under the securities laws of any such jurisdiction. No offering of securities will be made except by means of a prospectus meeting the requirements of
the Securities Act of 1933, as amended, or an exemption therefrom.

Industry and Share Data

This presentation includes information and statistics regarding market participants in the sectors in which DraftKings competes and other industry data which was obtained from third-party sources,
including reports by market research firms and company filings.

Trademarks

This presentation may contain trademarks, service marks, trade names and copyrights of other companies, which are the property of their respective owners. Solely for convenience, some of the
trademarks, service marks, trade names and copyrights referred to in this presentation may be listed without the TM, SM © or ® symbols, but we will assert, to the fullest extent under applicable law,
the rights of the applicable owners, if any, to these trademarks, service marks, trade names and copyrights.

Use of Non-GAAP Financial Measures

This presentation includes non-GAAP financial measures, including EBITDA and Adjusted EBITDA. We believe that these non-GAAP measures are useful to investors for two principal reasons. First, we
believe these measures may assist investors in comparing performance over various reporting periods on a consistent basis by removing from operating results the impact of items that do not reflect
core operating performance. Second, these measures are used by DraftKings’ management to assess its performance and may (subject to the limitations described below) enable investors to
compare the performance of the Company to its competition. We believe that the use of these non-GAAP financial measures provides an additional tool for investors to use in evaluating ongoing
operating results and trends. These non-GAAP measures should not be considered in isolation from, or as an alternative to, financial measures determined in accordance with GAAP. Other
companies may calculate these non-GAAP financial measures differently, and therefore such financial measures may not be directly comparable to similarly titled measures of other companies.

Projected Financial Information

This presentation contains financial forecasts, which were prepared in good faith by DraftKings on a basis believed to be reasonable. Such financial forecasts have not been prepared in conformity
with generally accepted accounting principles (“GAAP”). DraftKings’ independent auditors have not audited, reviewed, compiled or performed any procedures with respect to the projections for the
purpose of their inclusion in this presentation, and accordingly, they have not expressed an opinion nor provided any other form of assurance with respect thereto for the purpose of this
presentation. These projections are for illustrative purposes only and should not be relied upon as being necessarily indicative of future results. Certain of the above-mentioned projected information
has been provided for purposes of providing comparisons with historical data. The assumptions and estimates underlying the prospective financial information are inherently uncertain and are
subject to a wide variety of significant business, economic and competitive risks and uncertainties that could cause actual results to differ materially from those contained in the prospective financial
information. Projections are inherently uncertain due to a number of factors outside of DraftKings’ control. Accordingly, there can be no assurance that the prospective results are indicative of the
future performance of DraftKings or that actual results will not differ materially from those presented in the prospective financial information. Inclusion of the prospective financial information in this
presentation should not be regarded as a representation by any person that the results contained in the prospective financial information will be achieved.

                                                                                                                                                                                                         | 2
Legal disclaimer (continued)

Forward-Looking Statements and Non-GAAP Financial Measures
This presentation, and the accompanying oral presentation, contain forward-looking statements within the meaning of Section 21E of the Securities Exchange Act of 1934, as amended, and
the Private Securities Litigation Reform Act of 1995, about us and our industry that involve substantial risks and uncertainties. All statements other than statements of historical facts
contained in this presentation, including statements regarding guidance, our future results of operations or financial condition, business strategy and plans, user growth and engagement,
product initiatives, and objectives of management for future operations, and the impact of the COVID-19 pandemic on our business and the economy as a whole, are forward-looking
statements.

In some cases, you can identify forward-looking statements because they contain words such as “anticipate,” “believe,” “contemplate,” “continue,” “could,” “estimate,” “expect,” “forecast,”
“going to,” “intend,” “may,” “plan,” “potential,” “predict,” “project,” “propose”, “should,” “target,” “will,” or “would” or the negative thereof or comparable terminology, or by discussions of vision,
strategy or outlook. We caution you that the foregoing may not include all of the forward-looking statements made in this presentation.

You should not rely on forward-looking statements as predictions of future events. We have based the forward-looking statements contained in this presentation on our current
expectations and projections about future events and trends, including the ongoing COVID-19 pandemic, that we believe may affect our business, financial condition, results of operations,
and prospects. These forward-looking statements are subject to risks, uncertainties, and other factors, including those described in our filings with the Securities and Exchange Commission
(the “SEC”), which are available on the SEC’s website at www.sec.gov.

In addition, the forward-looking statements in this presentation relate only to events as of the date on which the statements are made and are based on information available to us as of the
date of this presentation. We undertake no obligation to update any forward-looking statements made in this presentation to reflect events or circumstances after the date of this
presentation or to reflect new information or the occurrence of unanticipated events, including future developments related to the COVID-19 pandemic, except as required by law. We may
not actually achieve the plans, intentions, or expectations disclosed in our forward-looking statements, and you should not place undue reliance on our forward-looking statements. Our
forward-looking statements do not reflect the potential impact of any future acquisitions, mergers, dispositions or investments.

                                                                                                                                                                                                       | 3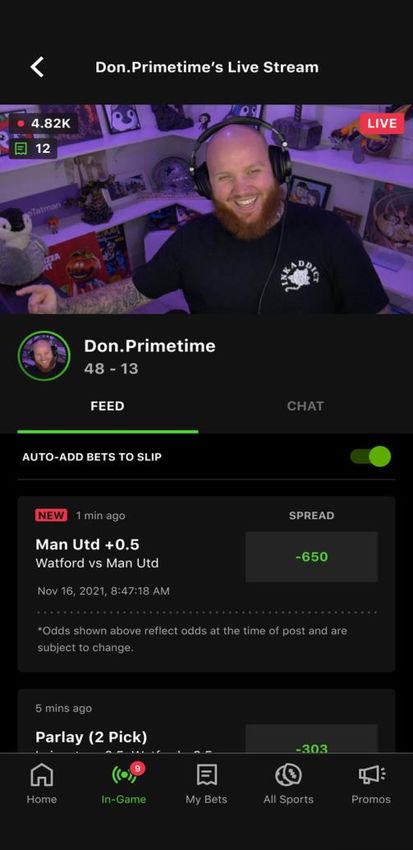
Investor Day Takeaways

    1     TAM larger than we thought for both OSB and iGaming; increasing total North America
          estimate from $67B to $80B

    2     Top 3 operators in U.S. OSB industry account for 80%+ of GGR; DKNG GGR share 25% and
          19% for OSB and iGaming, respectively

    3     Investment in product features will drive continued industry leadership

    4     Customer and state profit results are very strong; 5 states contribution profit positive in
          FY 2021 and 10 states anticipated to be contribution profit positive in FY 2022

    5     Increasing long-term Adjusted EBITDA outlook to $2.1B

    6     New verticals off to strong initial start and expect to be contribution profit positive in
          FY 2022, validating our thesis of LTV/CAC flywheel

                                                                                                        | 4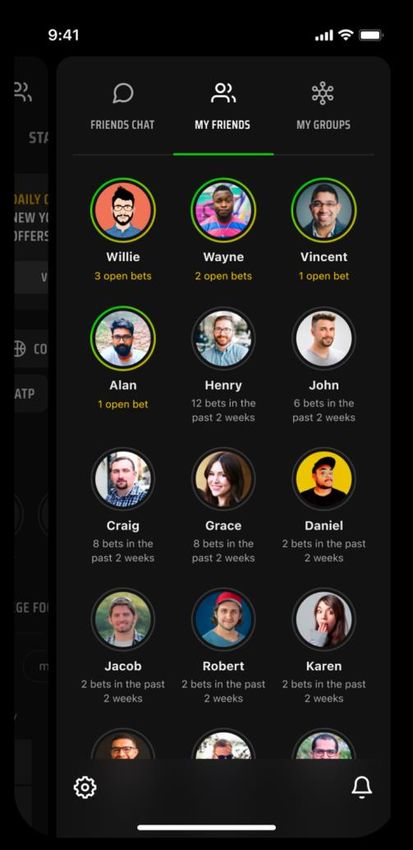
TAM AND
LEGALIZATION
               | 5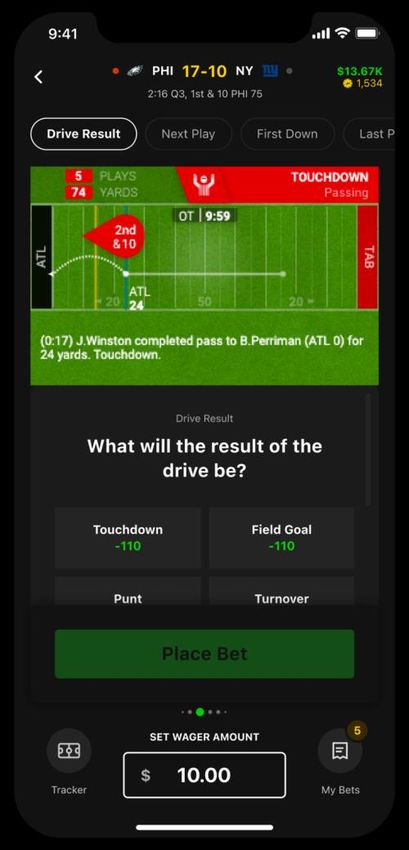
NJ’s OSB gross revenue per adult – assuming no growth going forward – implies a U.S.
  OSB TAM of $28B or $26B if we adjust for the state’s relative GDP
  Estimated U.S. Online Sports Betting Gross Revenue
  ($ in millions)

                                                                                                                                                                                                       $28B
                                                                                                                                  $740
                                                                                                                                                                                                                                                 $26B

                                                                                            $360

                                                      $244
           NJ OSB
    Launched in August 2018

                 $54

              NJ 2018                               NJ 2019                               NJ 2020                               NJ 2021

                                                                                                                                                                                            Implied U.S. TAM                             Implied U.S. TAM
                                                                                                                                                                                         (Population Method)(1)                           (GDP Method)(2)

• NJ OSB was $0.7B industry in 2021 and grew at a 74% CAGR from 2019 through 2021
• Assuming 0% growth from 2021 to 2023, a mature NJ implies $28B in Gross Revenue at 100% legalization ($107 Gross Revenue per adult)
• Adjusting for GDP per adult of NJ vs. that of the U.S., the U.S. opportunity is $26B in Gross Revenue at 100% legalization ($98 Gross Revenue per adult)

  Source: NJ Department of Gaming Enforcement; U.S. Census Bureau; U.S. Bureau of Economic Analysis
  Note: U.S. adult population is estimated to be 265 million in 2023. Per U.S. Census Bureau, the U.S. adult population is projected to be 259 million and 279 million in 2020 and 2030, respectively. We estimate the 2023 figure by assuming the U.S. adult population
  grows on a straight-line basis from 2020 to 2030. All U.S. TAMs are calculated using this 2023E population figure.
  (1)   Population method applies 2023E OSB gross revenue per adult for NJ ($107) to the 2023E U.S. adult population.                                                                                                                                                      | 6
  (2)   GDP method adjusts the TAM extrapolations for NJ’s GDP per adult relative to the U.S.’s GDP per adult.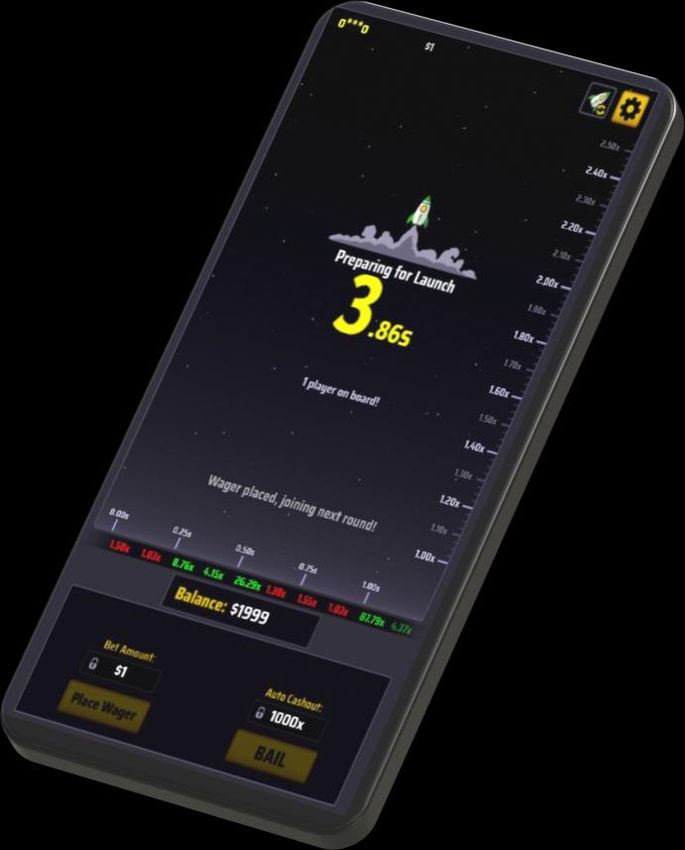
NJ is an appropriate extrapolation point given its gross revenue per adult compared to
   other states
    OSB Gross Revenue Per Adult – First Consecutive September to December
    (Four Months of Gross Revenue Per Adult)

                                                                                                                                                                                                                                                   $20.75                         $21.12

                                                                                                                                                                                                                                                                 $17.45

                                                                                                                                                                      $13.85                                                                                Non-NJ Gross Revenue / Adult = $13.02
                                                                                             $12.00                                          $12.30                                            $12.16
                                                                                                                                                                                                                        $11.43

                                          $7.27                                                                                                                                                                                                                  NJ Gross Revenue / Adult = $7.27

                                                                                                                    $5.90

                                                                    $3.26

                                            NJ                       WV                           IN                  PA                       NH                        IA(3)                   CO                        IL                       TN            MI               VA

Gross Revenue /
                                           100%                       45%                         165%                81%                     169%                     190%                     167%                     157%                      285%          240%             290%
Adult as % of NJ
NJ Adj. Gross
                                           $7.27                     $5.10                    $15.11                 $6.67                   $13.72                   $15.98                   $12.41                   $11.78                     $27.24        $23.59           $23.40
Revenue / Adult(1)
Adj. Gross Revenue /
                                           100%                       70%                         208%                92%                     189%                     220%                     171%                     162%                      374%          324%             322%
Adult as % of NJ
   • We benchmarked Gross Revenue per adult for the first September through December for the 10 states in which DraftKings' brand had launched prior to September 2021
   • Used September to December to control for seasonality of sports calendars and different launch dates
   • Eight of the ten states were larger than NJ on a Gross Revenue per Adult basis during this period, each by more than 50%
   • AZ, which launched in September 2021, outperformed NJ in its first full October and November by 351% on a Gross Revenue per Adult basis(2)
   Source: State Gaming Data; U.S. Census Bureau; U.S. Bureau of Economic Analysis
   Note: Slight discrepancies compared to 2021 Investor Day disclosures are due to reliance upon more recent Census Bureau and U.S. Bureau of Economic Analysis data.
   (1)   Adjusted Gross Revenue / Adult for GDP per adult in each state relative to that of NJ.
   (2)   AZ Gross Revenue / adult for October and November 2021 combined was $15.13, while NJ gross revenue / adult for October and November 2018 was $3.35.
   (3)   Iowa’s results reflect September to December 2021 due to the fact mobile registration began in the state in January 2021. Gross Revenue / Adult for September to December 2019 was $3.38, or $3.90 adjusted for relative GDP per adult.
                                                                                                                                                                                                                                                                                              | 7
NJ’s iGaming gross revenue per adult – assuming no growth going forward – implies a
  U.S. iGaming TAM of $52B or $48B if we adjust for the state’s relative GDP
   Estimated U.S. iGaming Gross Revenue
   ($ in millions)

                                                                                                                                                                                                  $52B
                                                                                                                                           $1,367
                                                                                                                                                                                                                                         $48B

                                                                      DKNG launched NJ
                                                                   iGaming in late December                              $970
                                                                             2018

                                                                                                     $483

                                                                                 $299
                                                             $246
                                         $197
                      $149
  $123

 NJ 2014            NJ 2015            NJ 2016             NJ 2017             NJ 2018             NJ 2019            NJ 2020             NJ 2021

                                                                                                                                                                                        Implied U.S. TAM                        Implied U.S. TAM
                                                                                                                                                                                     (Population Method)(1)                      (GDP Method)(2)
• NJ iGaming was $1.4B industry in 2021; growth accelerated following the introduction of OSB in August 2018
• Assuming 0% growth from 2021 to 2023, a mature NJ implies $52B in Gross Revenue at 100% legalization ($197 Gross Revenue per adult)
• Adjusting for GDP per adult of NJ vs. that of the U.S., the U.S. opportunity is $48B in Gross Revenue at 100% legalization ($180 Gross Revenue per adult)
  Source: NJ Department of Gaming Enforcement; U.S. Census Bureau; U.S. Bureau of Economic Analysis
  Note: U.S. adult population is estimated to be 265 million in 2023. Per U.S. Census Bureau, the U.S. adult population is projected to be 259 million and 279 million in 2020 and 2030, respectively. We estimate the 2023 figure by assuming the U.S. adult population grows on a straight-line basis
  from 2020 to 2030. All U.S. TAMs are calculated using this 2023E population figure.
  (1)   Population method applies NJ 2023E Gross Revenue per adult of $197 for iGaming to the 2023E U.S. population.
  (2)   GDP method adjusts the TAM extrapolations for NJ’s GDP per adult relative to the U.S.’s GDP per adult.
                                                                                                                                                                                                                                                                                                          | 8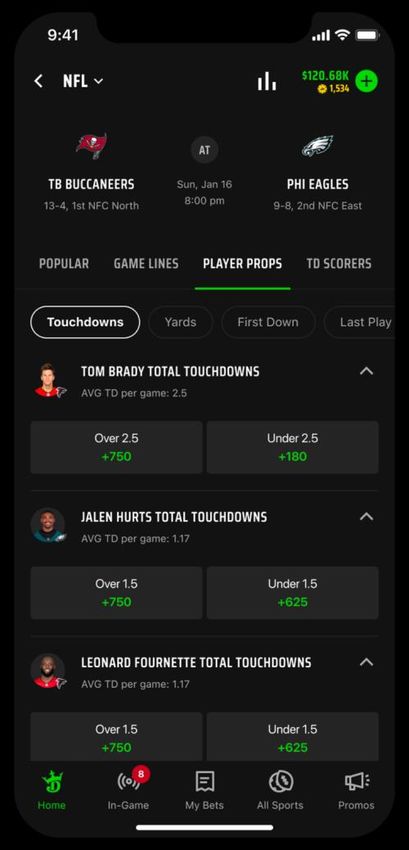
Extrapolating from NJ is likely conservative given PA and MI’s iGaming performance
  iGaming Gross Revenue Per Adult – 2021 State Performance Benchmarked to NJ in 2019
  (Twelve Months of Gross Revenue Per Adult) (1)

                                                                                                                                                                                                $142.10
                                                                                                                                                               $131.88

                                                                                                                                                                                      Non-NJ Gross Revenue / Adult = $105.51

                                                                                                                                                                                           NJ Gross Revenue / Adult = $69.52
                                                                     $69.52

                                                                                                                                      $42.55

                                                                  NJ 2019                                                          WV 2021                      PA 2021                          MI 2021
                                                        (6th Full Year of iGaming)                                       (1st Full Year of iGaming)   (2nd Full Year of iGaming)(2)     (Partial Year of iGaming)

Gross Revenue / Adult
                                                                      100%                                                              61%                     190%                              204%
as % of NJ
NJ Adj. Gross Revenue /
                                                                     $69.52                                                           $66.50                   $149.12                          $192.09
Adult
Adj. Gross Revenue /
                                                                      100%                                                              96%                     215%                              276%
Adult as % of NJ
  • We benchmarked Gross Revenue per adult in 2021 to the first calendar year in NJ after both OSB and iGaming launched (2019)
  • Methodology sets a conservatively high benchmark with NJ 2019, considering the state launched iGaming (but not OSB) in November 2013
  • Michigan outperformed NJ on a Gross Revenue per adult basis by 104%, or 176% when adjusting for GDP per adult
  • Pennsylvania outperformed NJ on a Gross Revenue per adult basis by 90%, or 115% when adjusting for GDP per adult
  Source: State Gaming Data; U.S. Census Bureau; U.S. Bureau of Economic Analysis
  (1)   Michigan Gross Revenue per adult is calculated based on less than 12 full months of data because the state launched in January 2021.
                                                                                                                                                                                                                               | 9
  (2)   Pennsylvania Gross Revenue is calculated based on Eilers & Krejcik estimates, considering the state reports revenue after promotions.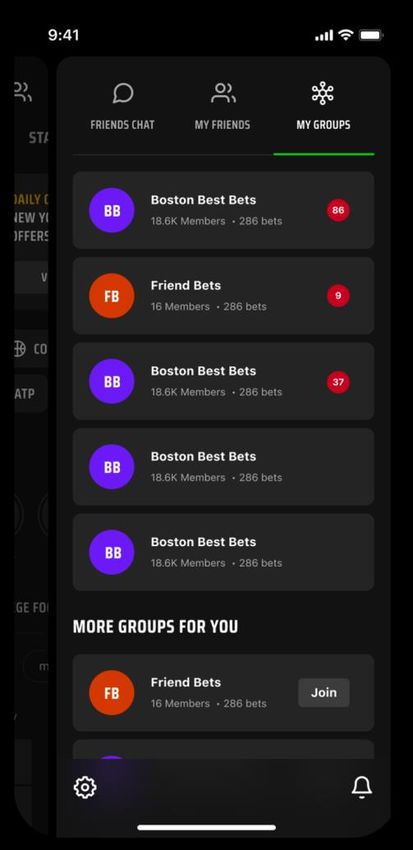
OSB is legal in states representing 44% of the U.S. population; iGaming at 13%
Indicates states in which DraftKings is currently live, representing 36% of the U.S. population for OSB and 11% for iGaming
State % of U.S. Population
Legalized Sports
Legalized OSB(2)
Legalized & Live
Legalized iGaming(4) • Following the repeal of the Professional and Amateur
Betting(1) OSB(3)
1 New Jersey 3% P P P P
Sports Protection Act (PASPA) in May 2018, 34 states,
2 West Virginia 1% P P P P representing approximately 55% of the U.S.
3 Indiana 2% P P P - population, have legalized sports betting in some
4 Oregon 1% P P P -
5 Pennsylvania 4% P P P P form (retail, mobile, or both)
6 New Hampshire 0% P P P -
7 Iowa 1% P P P -
8 Colorado 2% P P P - • 23 states have legalized online sports betting,
P P P
9
10
Illinois
Tennessee
4%
2% P P P
-
-
representing approximately 44% of the U.S.
11 Michigan 3% P P P P population
12 Virginia 3% P P P -
13 Wyoming 0% P P P -
14
15
Arizona
Connecticut
2%
1%
P
P
P
P
P
P
-
P
• 20 states are live with online sports betting,
16 New York 6% P P P - representing 38% of the U.S. population (3 states
17 Louisiana 1% P P P - representing 6% of the population are legal-pending-
P P P P
launch)
18 Nevada 1%
19 Rhode Island 0% P P P -
20 Washington, DC 0% P P P -
21 Maryland 2% P P - -
22 Ohio 4% P P - - • DraftKings is live in 17 states with online sports
23
24
Puerto Rico
Delaware
1%
0%
P
P
P
-
-
-
-
P
betting, representing approximately 36% of the U.S.
25 Mississippi 1% P - - - population
26 New Mexico(5) 1% P - - -
27 Montana 0% P - - -
28 Arkansas 1% P - - - • 7 states, representing approximately 13% of the U.S.
29 North Carolina 3% P - - -
30 Washington(5) 2% P - - - population have legalized some form of iGaming
31 South Dakota 0% P - - -
32 Nebraska 1% P - - -
33 Wisconsin(5) 2% P - - - • DraftKings is live in 5 states with iGaming, representing
North Dakota(5) P
approximately 11% of the U.S. population
34 0% - - -
% of U.S. Population 55% 44% 38% 13%
Source: U.S. Census Bureau
Note: States within each category sorted by launch date where applicable. Live DKNG states sorted by DKNG launch date. Washington, DC and Puerto Rico are considered states for the purposes of this page.
(1) Indicates states that have legalized sports betting in some form.
(2) Indicates states that have legalized online sports betting.
(3) Indicates states that have legalized online sports betting, that are also currently live.
(4) Indicates states with legalized iGaming. Nevada has online poker only. | 10
(5) In New Mexico, Washington, Wisconsin, and North Dakota, sports betting is limited to provision by Native American tribes.Extrapolating based on NJ assuming no growth going forward, the Canadian OSB and
iGaming TAM is between $6B and $9B
Estimated Canadian Online Sports Betting and iGaming Gross Revenue
Population Method(1) GDP Method (2)
$6B
$4B
$3B
$2B
OSB iGaming
• There was significant legislative momentum in Canada on both the federal and provincial level in 2021
• Federal legislation passed to legalize single event sports wagering in early 2021
• Ontario’s provincial government has announced that regulated OSB and iGaming will launch in April 2022
Source: U.S. Census Bureau; New Jersey Division of Gaming Enforcement; Statistics Canada; U.S. Bureau of Economic Analysis; World Bank
Note: Per Statistics Canada, the Canadian adult population is projected to be 31 million in 2023. All Canadian TAMs are calculated using this 2023E population figure.
(1) Population method applies NJ 2023E Gross Revenue per adult of $107 and $197 for OSB and iGaming, respectively, to the 2023E Canadian population.
(2) GDP method adjusts the TAM extrapolation for NJ’s GDP per adult relative to Canada’s GDP per adult. Specifically, Canada’s GDP per adult is 0.66x NJ’s GDP per adult, implying a Gross Revenue per adult of $70 and $129 for OSB and iGaming, respectively. | 11U.S. OSB AND
IGAMING
SHARE
| 12There are several intricacies when assessing state-reported share by operator
State Reported Share Considerations
State reports have a wide range of transparency; 4 of our 17 states provide operator-
1 specific net revenue, 5 provide operator-specific handle and GGR, and 8 do not provide
operator-specific metrics
2 Some states report with cash accounting and others accrual accounting, which can
impact monthly results
3 Promotion types are accounted for differently on a state-by-state basis; state specific
accounting of certain promotions can obfuscate operator-level GGR
4 “Total share” can be defined differently; we define total share as all states that have
legalized OSB and iGaming since the repeal of PASPA
| 13We provide an example to illustrate how an operator’s mix of promotions may
significantly impact state-reported gross revenue share
Example assumptions: Two operators; each with 50% handle share, 4% of handle driven by promotions; one utilizes only free bets (typically recognized at a hold rate of
approximately 45%), while the other only utilizes profit and odds boosts; same skilled players for each operator (assume a hold rate of 7% on cash wagers)
Illustrative Example: Operator Using Only Free Bets Illustrative Example: Operator Using Only Profit and Odds Boosts
($ in millions) ($ in millions)
Handle Driven By Handle Driven By
Promotions Promotions
~65% GGR
$2.0 Share $2.0
~35% GGR
Share
$48.0 $48.0
$4.3
$2.3 $2.3 $2.3
Handle Gross Revenue GAAP Net Revenue Handle Gross Revenue GAAP Net Revenue
| 14There are three methodologies to consider when evaluating U.S. share
Methodology 1 (Total U.S.) Methodology 2 (Total U.S., Since PASPA Repeal) Methodology 3 (States Only Where the Operator is Live)
• Total U.S. share: Measures an operator’s ability to get live • Total U.S. share, excluding Nevada: Measures an • Total share in states an operator is live: Measures an
and capture share across all states operator’s ability to get live and capture share in states that operator’s ability to capture share in only the states where
have launched since the repeal of PASPA it is live
• DraftKings’ Q4 results below
• DraftKings’ Q4 results below • DraftKings’ Q4 results below
32% 32%
28%
25% 25%
24%
(1) (2) (3)
19% 19% 19%
OSB Handle OSB GGR iGaming GGR OSB Handle OSB GGR iGaming GGR OSB Handle OSB GGR iGaming GGR
Source: State Gaming Reports and DraftKings internal data
Notes: Gross revenue as calculated pursuant to each state’s definition; no adjustments were made to this state data; iGaming share calculations include poker revenue.
(1) DraftKings’ iGaming share does not include contribution from GNOG, as any contribution would be dependent on the close of our previously announced acquisition. GNOG’s share was 4% of GGR using this methodology.
(2) DraftKings’ iGaming share does not include contribution from GNOG, as any contribution would be dependent on the close of our previously announced acquisition. GNOG’s share was 4% of GGR using this methodology. | 15
(3) DraftKings’ iGaming share does not include contribution from GNOG, as any contribution would be dependent on the close of our previously announced acquisition. GNOG’s share was 6% of GGR using this methodology.DraftKings and two other operators typically account for 80%+ of each state’s OSB GGR
Q4 2021 OSB GGR Share
(% of GGR)
Number of
21 8 13 1 12 1 17 25 6 8 14 11 2 11 3
Operators
Top 3 Market Share Operators
Operators Other Operators
9% 11%
15% 15%
19% 20% 18% 20%
22% 23%
27%
Population Weighted Average = 84%
100% 100% 100% 100%
91% 89%
86% 85%
81% 80% 82% 81%
78% 77%
73%
NJ WV IN OR PA NH IA CO IL TN MI VA WY AZ CT
Source: State Gaming Reports; Eilers & Krejcik Gaming
Note: Number of operators as of December 31, 2021. | 16DraftKings is in more states than any other OSB operator
Number of Live States by Operator
17 States
15 States
14 States 14 States
13 States
12 States
10 States
9 States
7 States
6 States
5 States
4 States
3 States
2 States
Operator #2 Operator #3 Operator #4 Operator #5 Operator #6 Operator #7 Operator #8 Operator #9 Operator #10 Operator Operator Operator Operator
#11-#12 #13-#15 #16-#17 #18-#23
Live % U.S.
36% 34% 34% 30% 32% 27% 25% 23% 18% 14%
Population
Source: DraftKings Internal Analysis | 17
Note: Does not include operators who are only live in 1 state.9 keys to our unique and sustainable differentiation
1 Trusted Brand Preferred real money gaming brand among U.S. consumers
2 Daily Fantasy User Database ~6M all-time paid users, 10+ years of data creates meaningful head start for acquisition
3 Our Marketing Machine Tech driven platform drives optimization based on player specific LTV
4 Product Innovation & User Centricity Outpacing competition with mobile products maximizing engagement
5 Vertical Integration Pure focus on creating unique products for U.S. sports fan powered on in-house platform
6 Single Wallet Across Products Seamless experience across states & DKNG products
7 Geographic Flexibility & Velocity Tech built for DFS is leveraged to rapidly enter new Sportsbook states
8 Scalable Regulatory Platform Stable, secure platform ensures responsible gaming, data privacy and security
9 Data Science Powerhouse Personalization, automation fueled by robust user level analytics
| 18We have made significant progress across product roadmap priorities with exciting new
developments to come
C
Our Roadmap: The 4 C’s of DraftKings’ Consumer Product Strategy
DraftKings will control its own destiny across every consumer product it operates by owning
Control and operating all of its own core technology
C
Content
DraftKings will offer the broadest possible suite of content across any real-money-gaming
platform in the U.S.
C
Connectivity
DraftKings will create an integrated ecosystem of consumer experiences, powered by
proprietary data & marketing tech
C
Customer
Experience
DraftKings will create a fun, exciting and personalized experience by creating products that
anticipate and respond to our customers’ behaviors
| 19iGaming is a great example of how we have been able to differentiate from our
competition when we own our technology platform
DraftKings iGaming: Areas Of Historical and Future Investment
27 ~60% Handle 90k+
New titles from DK Studio in Distinct Users Have Played
From DK Home-Grown Games in 2021
2021; now 51 DK Games total DK Rocket(1)
Source: Internal DraftKings data
(1) DraftKings launched DK Rocket in September 2021. | 20Following the completion of our migration, we shifted focus to invest heavily in content
expansion for our OSB product
Same Game Parlay NFL Player Props In-Game Micro-Markets
| 212022 will be a year of innovation for our OSB product; social functionality is one way we
will differentiate from competition and drive long-term retention
Friends Dashboard Bet Groups Popular/Friends Bet Feed Spectator Mode
| 22Based on conservative end of TAM ranges, DraftKings is on track to achieve $6.7B to
$9.5B North American OSB and iGaming gross revenue at maturity
DraftKings Online Sports Betting
$26B 65% 20-30% $3.4-5.1B
Implied Total of U.S. Population DraftKings’
in Gross OSB Revenue
U.S. TAM(1) with Legalized OSB(2) OSB Share
DraftKings iGaming
$48B 30% 20-25% $2.9-3.6B
Implied Total of U.S. Population DraftKings’ in Gross iGaming Revenue
U.S. TAM(3) with Legalized iGaming(4) iGaming Share(5)
DraftKings Canada
$6B 64% 10-20% $400-800mm
Implied Total of Canada Population with DraftKings’ in Gross OSB and iGaming Revenue
Canadian TAM(5) Legalized OSB and iGaming Canada Share
DraftKings’ OSB and iGaming
Gross Revenue
DKNG Q4 GGR shares of 25% and 19%(6) for OSB and iGaming, respectively
Source: NJ Department of Gaming Enforcement; U.S. Census Bureau; U.S. Bureau of Economic Analysis
$6.7-9.5B
(1) Based on GDP method extrapolation on page 6.
(2) OSB is legalized in states representing 44% of the U.S. population today.
(3) Based on GDP method extrapolation on page 8.
(4) iGaming is legalized in states representing 13% of the U.S. population today.
(5) Based on GDP method extrapolation on page 11. | 23
(6) iGaming share calculation includes poker revenue. iGaming share does not include contribution from Golden Nugget Online Gaming, Inc. (“GNOG”) as any contribution would be dependent on the close of our previously announced acquisition. GNOG’s Q4 iGaming share was 4% of GGR.UNIT
ECONOMICS
| 24Clear path to profitability based on customer payback periods and state-level
economics; multiple proof points achieved already
Customer Cohort Economics State Level Economics Enterprise Economics
We invest in acquiring players As customer cohorts “stack,” a state turns As contribution profit positive states “stack”,
with goal of 2-3 year gross profit payback contribution profit positive after 2-3 years the company will turn profitable
• We invest to acquire a player based on 2 to 3 year gross • A state is unprofitable in its early years as we invest to • When the contribution profit from more mature states
profit being at least as much as what we spent to acquire acquire players exceeds the contribution profit from states that are still
the customer in investment phase, cumulative contribution profit will be
• In later years, revenue and gross profit from earlier cohorts positive
• The gross profit from that player is the net revenue per “stack” on top of each other, and advertising spend in
What This player (net of promotions) and the gross margin on that that state declines as there are fewer untapped players • Our cost structure is right sized for growth. As scale is
Means revenue within a state that have not joined already achieved, the gap between our absolute revenue growth
and our absolute fixed cost growth will naturally widen
• Gross margin improves over time as promotional • As customer and revenue retention rates persist, states resulting in operating leverage
intensity declines, and we make operational generate substantially more profit in out years
improvements to our COGS
• The state launch “J Curve” has changed as customer
acquisition has accelerated in newly launched states
• Year 1, Year 2, and Year 3 customer retention were 83%, • NJ generated $68 million of contribution profit in FY 2021 • We will be contribution profit positive for FY 2022
88%, and 96%, respectively including all states where we are currently live
• We had 5 states that had positive contribution profit in
• Year 1 to Year 2 and Year 2 to Year 3 revenue retention FY 2021 • If we had not launched any additional states after year end
were 122% and 143%, respectively 2021, we expect that DraftKings would have been able to
Proof • We anticipate 5 more states will be contribution profit achieve EBITDA profitability in Q4 of 2022
Points • Year 1 to Year 2 and Year 1 to Year 3 revenue per retained positive in FY 2022
player have increased 39% and 49%, respectively • Based on all of the states we are currently in, and if
• More OSB customers per adult were acquired in AZ legalization trends remain consistent with prior years, we
• MUPs and ARPMUP disclosure proves less than 3 year over its first two quarters than in NJ over its first eight would expect to be EBITDA positive in Q4 of FY 2023
payback periods quarters; informs economic model for new states
| 25Gross profit payback period for a customer cohort is the number of years required for
gross profit to exceed customer acquisition investment Customer Cohort
Economics
State Level
Economics
Enterprise
Economics
Cohort Gross Profit Payback Definition
Cumulative
Cohort
Cohort Gross Cohort Acquisition
Payback Period Zero
Profit After n Spend
of n
Years
Cohort Gross Profit Calculations
Year 1 Net Revenue Year 1 Gross Margin %
(1)
Gross Profit Year 1
Gross Profit Year 2 Year 2 Net Revenue Year 2 Gross Margin %
(2) (3)
Gross Profit Year 3 Year 3 Net Revenue (4)
Year 3 Gross Margin %
(5)
(1) Year 1 gross margin approximately 35%.
(2) For cohorts with less than one year of data, Year 2 Net Revenue defined as Year 1 Net Revenue * Year 1 to Year 2 Revenue Retention Rate.
(3) Year 2 gross margin approximately 45%.
(4) For cohorts with less than two years of data, Year 3 Net Revenue defined as Year 2 Net Revenue * Year 2 to Year 3 Revenue Retention Rate. | 26
(5) Year 3 gross margin approximately 50%.>80% customer retention and >120% revenue retention year over year; revenue from
retained customers more than doubles from Year 1 to Year 3 Customer Cohort
Economics
State Level
Economics
Enterprise
Economics
OSB and iGaming: Total Customer Retention(1) OSB and iGaming: Total Revenue Retention(2)
49%
Cumulative 70%
Customer 73% 143%
Net Revenue Per 39%
Retention 96%
Retained User Growth
88% 122%
83% (vs. Prior Year)
100%
Year 1 Year 2 Year 3 Year 1 Year 2 Revenue Indexed to Year 1 Year 3 Revenue Indexed to Year 2
(N = 41) (N = 11) (N = 2) (N = 11) (N = 2)
Our customer retention improves every year of a cohort. These cohorts achieve >100% revenue retention year over year as retained customers increase their spend on our platform
• As of FY 2021, we have 90 quarterly cohorts across 14 states (3) since launch of OSB in Q3 2018
• 41 of 90 cohorts have four or more consecutive full quarters of OSB and/or iGaming retention data
• 30 of the 41 cohorts have between four and seven consecutive full quarters of OSB and/or iGaming data (“One Year Cohorts”), allowing us to measure Year 1 customer retention
• Nine of the 41 cohorts have between eight and eleven consecutive full quarters of OSB and/or iGaming data (“Two Year Cohorts”), allowing us to measure Year 1(4) customer
retention, Year 2(5) customer retention, and Year 1 to Year 2 revenue retention
• Two of the 41 cohorts have twelve or more full quarters of OSB and/or iGaming data (“Three Year Cohorts”), allowing us to measure Year 1(4) customer retention, Year 2(5) customer
retention, Year 3(6) customer retention, Year 1 to Year 2 revenue retention, and Year 2 to Year 3 revenue retention
• Applying our experience with DFS cohorts to OSB and iGaming cohorts, customer retention is likely to increase every year and flatten out at ~100%
Note: For further details on the definitions of customer retention and revenue retention and on the specific cohorts included in the analysis, refer to page 49 in the appendix of this presentation.
(1) Includes OSB and iGaming customers for the 41 cohorts with four or more consecutive quarters of OSB and/or iGaming data.
(2) Includes OSB and iGaming net revenue for the eleven cohorts with eight full quarters of OSB and/or iGaming data.
(3) Excludes Oregon B2B. DraftKings Sportsbook replaced the Scoreboard app on January 18, 2022.
(4) Year 1 is defined as the first 4 full quarters following a cohort’s acquisition quarter. For example, Year 1 is Q1 2019 to Q4 2019 for a customer acquired in Q4 2018.
(5) Year 2 is defined as the 4 full quarters following a cohort’s Year 1. For example, Year 2 is Q1 2020 to Q4 2020 for a customer acquired in Q4 2018. | 27
(6) Year 3 is defined as the 4 full quarters following a cohort’s Year 2. For example, Year 3 is Q1 2021 to Q4 2021 for a customer acquired in Q4 2018.Cohort customer and revenue retention in OSB-only states is similar-to-better than
customer and revenue retention in multi-product states Customer Cohort
Economics
State Level
Economics
Enterprise
Economics
OSB Only: Total Customer Retention(1) OSB Only: Total Revenue Retention(2)
Cumulative
Customer 38%
Retention 79%
Net Revenue Per
Retained User Growth 124%
88% 90%
(vs. Prior Year)
100%
Year 1 Year 2 Year 1 Year 2 Revenue Indexed to Year 1
(N = 20) (N = 2) (N = 2) (N = 2)
Our customer retention improves every year of a cohort. These cohorts achieve >100% revenue retention year over year as retained customers increase their spend on our platform
• As of FY 2021, we have 90 quarterly cohorts across 14 states (3) since launch of OSB in Q3 2018
• 20 of 90 cohorts are in OSB only states and have four or more consecutive full quarters of OSB retention data
• 18 of the 20 cohorts have between four and seven consecutive full quarters of OSB data (“One Year Cohorts”), allowing us to measure Year 1 customer retention
• Two of the 20 cohorts have between eight and eleven consecutive full quarters of OSB data (“Two Year Cohorts”), allowing us to measure Year 1(4) customer retention, Year 2(5)
customer retention, and Year 1 to Year 2 revenue retention
• Applying our experience with DFS cohorts to OSB and iGaming cohorts, customer retention is likely to increase every year and flatten out at ~100%
Note: For further details on the definitions of customer retention and revenue retention and on the specific cohorts included in the analysis, refer to page 49 in the appendix of this presentation.
(1) Includes OSB customers for the 20 cohorts with four or more consecutive quarters of OSB data.
(2) Includes OSB net revenue for the two cohorts with eight full quarters of OSB data.
(3) Excludes Oregon B2B. DraftKings Sportsbook replaced the Scoreboard app on January 18, 2022.
(4) Year 1 is defined as the first 4 full quarters following a cohort’s acquisition quarter. For example, Year 1 is Q1 2019 to Q4 2019 for a customer acquired in Q4 2018. | 28
(5) Year 2 is defined as the 4 full quarters following a cohort’s Year 1. For example, Year 2 is Q1 2020 to Q4 2020 for a customer acquired in Q4 2018.Our strong retention is driven by acquiring quality customers, putting the customer first,
cross selling, and continuous product improvement Customer Cohort
Economics
State Level
Economics
Enterprise
Economics
Retention Flywheel
• Acquiring the right customers: Targeting high-quality customers is the first
step in strong cohort performance
• Always putting the customer first: Customer centricity in everything we
do drives best-in-class customer experience and customer service
• Cross selling: Data science and CRM drives frequency of play, player
activation, and engagement across new products
• Driving continuous product innovation: Continuous iteration and
improvement of products gives our customers more ways to play
| 29Gross margin leverage for a cohort is achieved over time due to promotional spend
decreasing, economies of scale, and operational initiatives Customer Cohort
Economics
State Level
Economics
Enterprise
Economics
Cohort Level Gross Margin Improvement
1 Many of our variable costs are tied to gross revenue, not net revenue; therefore, as
promotional rates decrease, gross margin increases
Given that new customer promotions are richer than existing customer promotions,
2 promotions as a percentage of GGR naturally decrease as we shift from acquisition
investments to retention and cross-sell investments
3 As we continue to grow revenue and deposit volume, certain variable costs decrease
as a percentage of revenue due to pricing tiers that result in volume discounts
4 Continuous focus on operational initiatives around platform costs, processing fees,
and revenue share drives margin increase across all cohorts
| 30Our financial disclosures provide sufficient information to validate our payback periods
on an LTM basis Customer Cohort
Economics
State Level
Economics
Enterprise
Economics
LTM Acquired Paid New Actives Calculation
LTM LTM MUPs LTM MUPs Player Retention Rate
Current Period Prior Period
Acquired
Paid New
Actives Months Played 12 Months
Per Average Player Per Year
Customer Acquisition Cost Calculation
Customer Acquisition Marketing Spend
(1)
Acquisition Acquired Paid New Actives
Cost
Gross Profit Payback Periods
Approximate Customer Acquisition Cost
Payback
Period LTM Months Played LTM
(In Years) ARPMUP Per Average Player Gross Margin
Note: See page 46 for example calculations for each LTM period in FY 2021.
(1) Over the last four LTM periods, our variable acquisition marketing spend was 77% to 81% of our total marketing spend and on average 79%. We expect this percentage to be in the low 70s in 2022 and going forward as we invest in fixed S&M and mix into more efficient national media
spend. | 31Using the previously outlined methodology, we can prove out sub three-year
payback periods Customer Cohort
Economics
State Level
Economics
Enterprise
Economics
Payback Periods by Acquisition Period Based on Actual Results
(Number of Years)
2.8 Years
2.5 Years 2.5 Years
2.2 Years
LTM Q1 2021 LTM Q2 2021 LTM Q3 2021 LTM Q4 2021
LTM MUPs
1,089k 1,296k 1,376k 1,494k
(Current Period)
LTM MUPs
709k 669k 769k 883k
(Prior Period)
LTM ARPMUP $56 $61 $62 $67
LTM Gross Margin 53% 51% 48% 47%
Note: Payback periods are calculated applying an 83% customer retention rate (see page 27 for reference) and assuming acquisition marketing spend to be 79% of total marketing spend. Over the last four LTM periods, our variable acquisition marketing spend was 77% to 81% of our total
marketing spend and on average was 79%. We expect this percentage to be in the low 70s in 2022 and going forward as we invest in fixed S&M and mix into more efficient national media spend. | 32The result of strong payback periods is that states turn positive after two to three years
Customer Cohort State Level Enterprise
Economics Economics Economics
DKNG State Launch and Profitability by State
State 2018 2019 2020 2021 2022E % Pop
NJ Q3 2018 Launch Profitable 2.7 %
WV Q3 2019 Launch Profitable 0.5 %
IN Q4 2019 Launch Profitable 2.1 %
PA Q4 2019 Launch Expected Profitable 3.9 %
NH Q4 2019 Launch Profitable 0.4 %
IA Q1 2020 Launch Expected Profitable 1.0 %
CO Q2 2020 Launch Expected Profitable 1.8 %
IL Q3 2020 Launch Profitable 3.9 %
TN Q4 2020 Launch 2.1 %
MI Q1 2021 Launch 3.0 %
VA Q1 2021 Launch 2.6 %
WY Q3 2021 Launch 0.2 %
AZ Q3 2021 Launch 2.2 %
CT Q4 2021 Launch Expected Profitable 1.1 %
NY Q1 2022 Launch 5.9 %
LA Q1 2022 Launch 1.4 %
Q1 2022 Launch
OR 1.3 %
Expected Profitable
Note: Does not include DFS or retail businesses. “Profitable” relates to contribution profit, which is a non-GAAP metric defined as gross profit less external marketing. | 33NJ was highly profitable in its third full year; expect profitability to continue to ramp
quickly in 2022 Customer Cohort
Economics
State Level
Economics
Enterprise
Economics
NGR and Contribution Profit – New Jersey
($ in millions)
Net Revenue Contribution Profit
Contribution
Margin
$239
$153
28%
$85
$68
5%
$21
(48)% (6)% $8
($5)
($10)
Launch Year Year 1 Year 2 Year 3
(2018 A) (2019 A) (2020 A) (2021 A)
Note: Does not include DFS or retail businesses. Contribution profit is a non-GAAP metric that reflects gross profit less external marketing. | 34Increased sales and marketing spend due to unprecedented number of new players at a
historically lower cost per acquired player Customer Cohort
Economics
State Level
Economics
Enterprise
Economics
Acquired and Cumulative Gaming Customers Over Time
Acquired Gaming Customers (1) Cumulative Gaming Customers (2)
8
7
6
5
4
3
1 2
Aug-18 Oct-18 Dec-18 Feb-19 Apr-19 Jun-19 Aug-19 Oct-19 Dec-19 Feb-20 Apr-20 Jun-20 Aug-20 Oct-20 Dec-20 Feb-21 Apr-21 Jun-21 Aug-21 Oct-21 Dec-21
Select State Launch Commentary
1• DKNG launches NJ OSB in August 2018 and NJ iGaming in December 2018
2• DKNG launches WV OSB in August 2019
3• DKNG launches IN OSB and PA OSB in October 2019 and November 2019, respectively
4• DKNG launches IL OSB in August 2020; start of first full NFL season for OSB states representing ~13% of the U.S. population (i.e., IN, PA, NH, IA, CO, and IL)
5• DKNG launches TN OSB in November 2020
6• DKNG launches MI OSB and iGaming and VA OSB in January 2021
7• DKNG launches WY OSB and AZ OSB in September 2021; start of first full NFL season for OSB states representing ~10% of the U.S. population (i.e., TN, MI, VA, AZ, and WY)
8• DKNG launches CT OSB and iGaming in October 2021
Note: Acquired gaming customers and cumulative gaming customers do not have the same Y axis scale.
(1) First time DraftKings OSB and/or iGaming players acquired in each month. | 35
(2) Cumulative DraftKings OSB and/or iGaming players since OSB launch in August 2018.We are acquiring customers much faster than before; more OSB customers per adult
acquired in AZ over two quarters than in NJ over eight quarters Customer Cohort
Economics
State Level
Economics
Enterprise
Economics
Cumulative Acquired OSB Customers Per Adult(1) Over Time
NJ (Actuals) (2) AZ (Actuals) (3)
We acquired ~3.5% of AZ’s adult population in our first
two quarters with OSB, compared to ~1.3% in our first
two quarters with OSB in NJ
Increased
marketing spend
vs. original state
launch playbook
at lower CPA
First Quarter Second Quarter Third Quarter Fourth Quarter Fifth Quarter Sixth Quarter Seventh Quarter Eighth Quarter
(1) Cumulative acquired OSB players per adult defined as distinct DraftKings users who played OSB in each respective state divided by the adult population in that state.
(2) Cumulative DraftKings OSB players per adult acquired in New Jersey; note New Jersey represents 2.7% of the U.S. adult population. | 36
(3) Cumulative DraftKings OSB players per adult acquired in Arizona; note Arizona represents 2.2% of the U.S. adult population.If no new states launch for the rest of FY 2022, we expect to be contribution profit
positive this year Customer Cohort
Economics
State Level
Economics
Enterprise
Economics
FY 2021 Contribution Profit Build FY 2022 Contribution Profit Build
Already Contribution Not Yet Contribution Cumulative Already Contribution Not Yet Contribution Cumulative
Profit Positive(1) Profit Positive(1) Contribution Profit Profit Positive(1) Profit Positive(1) Contribution Profit
Negative FY 2021 contribution profit was predominantly due to investing in customer acquisition Contribution profit turns positive as we shift from focusing on customer acquisition to customer
for states that launched in 2021 or early 2022 retention and realize operating leverage in more mature states
(1) Includes contribution profit from across the B2C platform. | 37ENTERPRISE
ECONOMICS
| 38Expected gross margin rate has come down by ~200bps primarily due to NY
Illustrative State Level Unit Economics (Expected Year 5), Blended OSB and iGaming Average (1)
(% of Net Revenue)
100%
(27)%
(5)%
56%
(8)%
(4)%
Net Revenue Taxes Platform Processing Revenue Gross
Share Margin
• Most states acting rationally with • Migration to in-house bet engine • Initiatives underway to improve Ability to renegotiate with existing
tax rates to maximize tax complete payment processor mix, skin providers
revenues and enable competitive renegotiate rates, and decrease
offerings versus the illegal • Continue to move to in-house deposit to withdrawal ratio Strong and mutually beneficial
offshore market games that improve GM% relationships with skin providers
Note: Cost buckets represent expected year 5 population weighted average across our 18 multi-operator states and provinces with legalized OSB or iGaming. Excludes any contribution from DFS which has ~80% gross margin. Including DFS, expected gross margin for the enterprise is ~58%.
(1) Includes 18 multi-operator OSB states and provinces and 6 multi-operator iGaming states and provinces. Taking an average across these states appropriately reflects that we will likely be live in more OSB states than OSB and iGaming states at maturity. States included in build are the | 39
following: NJ (OSB and iGaming), CO, IL, IN, IA, PA (OSB and iGaming), WV (OSB and iGaming), TN, MI (OSB and iGaming), VA, WY, AZ, LA, OH, MD, ON (OSB and iGaming), NY, and CT (OSB and iGaming).Long-term external marketing scale will be achieved through decreasing customer
acquisition spend and optimizing our CACs
Long-Term External Marketing Spend
1 External marketing is primarily a product of customer acquisition in newly launched
OSB and iGaming states and provinces
Applying current CACs to assumed annual customer acquisition at maturity accounts
2 for more than 90% of the decrease from current external marketing spend to long-
term external marketing spend
The remaining decrease in spend is due to optimizing CACs; optimization is due to a
3 variety of factors, the most notable being mix shift into more efficient national
advertising from local advertising
| 40Expected long-term SG&A will comfortably be in the mid-to-high teens as a percentage
of net revenue
Long-Term SG&A
Short-term cost growth due to unique North American online gaming industry
1 dynamics; pulled forward staffing to launch states and be competitive with at scale
global peers
2 Expect to see a meaningful slowdown in SG&A growth starting in 2023
3 Most of our SG&A costs do not require growth as we expand into newly launched
states and provinces
4 SG&A as a percentage of net revenue for at scale online gaming players is typically in
the mid teens
| 41Increasing long-term Adjusted EBITDA estimate to $2.1B before GNOG synergies,
Marketplace, Media, and any other new initiatives
($ in billions)
Canada(2) Other(1)
$ 6.7
$ 0.1
At 64% of Canada
Population $ 0.4
Legalized
iGaming(3)
At 30% of U.S.
Population $ 2.5
Legalized
$ 3.9
$(2.8)
$ 3.2
$(0.7)
Online Sports Book(4)
At 65% of U.S. $ 2.1
Population $ 3.3
Legalized $(1.1)
DFS
$ 0.4
(5)
Net Revenue COGS Gross Profit External Marketing Contribution Profit SG&A Adjusted EBITDA
• Assumes 65% of U.S. population has live OSB and 30% of U.S. population has live iGaming, and then rolls forward 5 years to “maturity”
• Assumes DKNG has 25% and 22.5% share in U.S. OSB and U.S. iGaming, respectively
• Assumes 64% of Canada population legalizes OSB and iGaming and DKNG achieves 15% share across OSB and iGaming
• Does not include any revenue or costs associated with GNOG synergies, Marketplace, Media, and any other new initiatives
Notes: Does not include $300mm in projected long-term EBITDA synergies from the announced acquisition of GNOG. ~$200mm of the projected synergies are attributable to GNOG revenue uplift (improved marketing and CRM efficacy) and gross margin rate improvement (GNOG migrating to
the DKNG technology platform). The remaining ~$100mm of projected synergies are predominantly external marketing and some SG&A savings. Achievement of any projected synergies is subject to the closing of the previously announced acquisition of GNOG.
(1) Includes B2B and retail revenue streams.
(2) Assumes 64% of Canadian population has access to legalized OSB and iGaming with DraftKings achieving 15% share. Net of promotional allowances (22% of gross revenues).
(3) Assumes 30% of U.S. population has access to legalized iGaming with DraftKings achieving 22.5% share. Net of promotional allowances (22% of gross revenues).
(4) Assumes 65% of U.S. population has access to legalized sports betting with DraftKings achieving 25% share. Net of promotional allowances (22% of gross revenues). | 42
(5) Based on bottoms up build from internal management plan and analysis of fixed vs. variable vs. semi-variable cost centers. SG&A includes compensation and non-compensation costs for Sales & Marketing, Product & Technology, and G&A expenses.MARKETPLACE
| 43DKNG has had early success with its NFT marketplace and has a clear right to play in the
space based on customer overlap; early innings of industry show massive TAM potential
DraftKings Marketplace Overview
115k ~20% Cross Sell 40%+
Unique Marketplace Of Customers Acquired on DKNG Customers Bought Crypto or
Customers in 5 Months(1) Marketplace to DFS, OSB, iGaming NFTs in Last Twelve Months(2)
All drops (110) Launching 6.6x more likely
Gamified NFT Collaboration @DraftKings Followers to Tweet About
Sold out in 2021
with NFLPA NFTs Versus Average U.S. Twitter User(3)
LTM NFT Secondary Sales and Monthly Unique Buyers(4)
($ in millions)
1081k
Monthly Unique
Buyers(5) $18,605
932k
$16,097
762k
$13,386
610k
$10,536
490k
$7,320
369k
226k 282k
103k 163k $2,829
23k 50k
$1,377 $1,700
$835 $1,089
$86 $449
Jan-21 Feb-21 Mar-21 Apr-21 May-21 Jun-21 Jul-21 Aug-21 Sep-21 Oct-21 Nov-21 Dec-21
Source: Internal DraftKings data and Cryptoslam.io
(1) DraftKings Marketplace launched in August 2021.
(2) Internal DraftKings CRM Database Analysis (online survey fielded June 21 to July 6, 2021, prior to DraftKings Marketplace launch), Current DraftKings Players Active in past 6 months, n=788. Q: Please indicate whether or not each of these describes you: I have bought cryptocurrency.
(3) Internal Twitter Lifestyle Analysis, June 2021.
(4) Calculated from transactions on all marketplaces tracked by CryptoSlam and only includes owner-to-owner sales (not initial sales from the product directly to the owners). | 44
(5) Calculated as the average monthly unique buyers tracked by CrytptoSlam over the LTM period.APPENDIX
| 45Financial disclosures and example payback period calculations LTM Q4 2021 Months Played New MUPS (k) Implied New Actives (k) Implied CAC ($) ARPMUP ($) Revenue / New Active ($) GM% GP ($) / New Paid Active Payback Period B2C Net Revenue ($ in mm) $1,199 2 761 4,564 $161 $67 $134 47% $63 2.5 Years ARPMUP $67 3 761 3,043 $241 $67 $201 47% $95 2.5 Years Enterprise GM% 47% 4 761 2,282 $322 $67 $267 47% $127 2.5 Years All-in Adj. Marketing Spend ($ in mm) $929 5 761 1,826 $402 $67 $334 47% $159 2.5 Years 79% of Marketing Spend ($ in mm) $734 6 761 1,521 $482 $67 $401 47% $190 2.5 Years LTM Q4 2020 MUPs (k) 883 7 761 1,304 $563 $67 $468 47% $222 2.5 Years LTM Q4 2021 MUPs (k) 1,494 8 761 1,141 $643 $67 $535 47% $254 2.5 Years Net Adds (k) 611 9 761 1,014 $724 $67 $602 47% $286 2.5 Years Gross Adds @ 17% Churn (k) 761 10 761 913 $804 $67 $669 47% $317 2.5 Years LTM Q3 2021 Months Played New MUPS (k) Implied New Actives (k) Implied CAC ($) ARPMUP ($) Revenue / New Active ($) GM% GP ($) / New Paid Active Payback Period B2C Net Revenue ($ in mm) $1,031 2 737 4,424 $152 $62 $125 48% $60 2.5 Years ARPMUP $62 3 737 2,949 $228 $62 $187 48% $90 2.5 Years Enterprise GM% 48% 4 737 2,212 $304 $62 $250 48% $121 2.5 Years All-in Adj. Marketing Spend ($ in mm) $850 5 737 1,770 $379 $62 $312 48% $151 2.5 Years 79% of Marketing Spend ($ in mm) $672 6 737 1,475 $455 $62 $375 48% $181 2.5 Years LTM Q3 2020 MUPs (k) 769 7 737 1,264 $531 $62 $437 48% $211 2.5 Years LTM Q3 2021 MUPs (k) 1,376 8 737 1,106 $607 $62 $500 48% $241 2.5 Years Net Adds (k) 607 9 737 983 $683 $62 $562 48% $271 2.5 Years Gross Adds @ 17% Churn (k) 737 10 737 885 $759 $62 $624 48% $302 2.5 Years LTM Q2 2021 Months Played New MUPS (k) Implied New Actives (k) Implied CAC ($) ARPMUP ($) Revenue / New Active ($) GM% GP ($) / New Paid Active Payback Period B2C Net Revenue ($ in mm) $945 2 741 4,443 $134 $61 $122 51% $62 2.2 Years ARPMUP $61 3 741 2,962 $201 $61 $182 51% $93 2.2 Years Enterprise GM% 51% 4 741 2,222 $267 $61 $243 51% $124 2.2 Years All-in Adj. Marketing Spend ($ in mm) $752 5 741 1,777 $334 $61 $304 51% $155 2.2 Years 79% of Marketing Spend ($ in mm) $594 6 741 1,481 $401 $61 $365 51% $186 2.2 Years LTM Q2 2020 MUPs (k) 669 7 741 1,270 $468 $61 $426 51% $217 2.2 Years LTM Q2 2021 MUPs (k) 1,296 8 741 1,111 $535 $61 $486 51% $248 2.2 Years Net Adds (k) 627 9 741 987 $602 $61 $547 51% $279 2.2 Years Gross Adds @ 17% Churn (k) 741 10 741 889 $669 $61 $608 51% $310 2.2 Years LTM Q1 2021 Months Played New MUPS (k) Implied New Actives (k) Implied CAC ($) ARPMUP ($) Revenue / New Active ($) GM% GP ($) / New Paid Active Payback Period B2C Net Revenue ($ in mm) $731 2.0 500 3,002 $168 $56 $112 53% $59 2.8 Years ARPMUP $56 3.0 500 2,001 $252 $56 $168 53% $89 2.8 Years Enterprise GM% 53% 4.0 500 1,501 $336 $56 $224 53% $119 2.8 Years All-in Adj. Marketing Spend ($ in mm) $638 5.0 500 1,201 $420 $56 $280 53% $149 2.8 Years 79% of Marketing Spend ($ in mm) $504 6.0 500 1,001 $504 $56 $336 53% $178 2.8 Years LTM Q1 2020 MUPs (k) 709 7.0 500 858 $588 $56 $392 53% $208 2.8 Years LTM Q1 2021 MUPs (k) 1,089 8.0 500 750 $672 $56 $448 53% $238 2.8 Years Net Adds (k) 380 9.0 500 667 $756 $56 $504 53% $267 2.8 Years Gross Adds @ 17% Churn (k) 500 10.0 500 600 $840 $56 $560 53% $297 2.8 Years Notes: Includes all B2C revenue from OSB, iGaming, DFS, and other. Implied new actives (k) = (12 / Months played) * New MUPs (k). | 46
Reconciliation of GAAP Operating Expenses to Non-GAAP Operating Expenses
FY 2020 to FY 2021 Operating Expenses Reconciliation
($ in millions)
31-Dec-21 30-Sep-21 30-Jun-21 31-Mar-21 31-Dec-20 30-Sep-20 30-Jun-20 31-Mar-20
GAAP Operating Expenses
Cost of Revenue $253 $171 $187 $183 $159 $97 $47 $43
Sales and Marketing $278 $304 $171 $229 $192 $203 $46 $54
General and Administrative $241 $220 $199 $169 $173 $127 $107(1) $39(1)
Product and Technology $70 $65 $63 $56 $66 $54 $31 $18
Total GAAP Operating Expenses $842 $759 $619 $637 $591 $481 $231 $155
Pro-Forma Operating Expense Adjustments
Cost of Revenue $0 $0 $0 $0 $6 $25
Sales and Marketing $0 $0 $0 $0 $1 $4
General and Administrative $0 $0 $0 $0 $0 $9 $5
Product and Technology $0 $0 $0 $0 $0 $6 $12
Total Pro-Forma Operating Expense Adjustments $22 $46
Non-GAAP Operating Expense Adjustments
(a) Stock-based compensation
Cost of Revenue (a) ($1) ($2) ($1) ($1) ($1) ($0) ($0) $0 expense
(b) ($20) ($20) ($21) ($19) ($18) ($19) ($18) ($18)
(d) ($9) ($7) ($7) ($7) ($6) ($6) ($4) ($4)
Amortization of acquired
Sales and Marketing (a) ($15) ($14) ($14) ($9) ($7) ($12) ($3) ($0) (b)
intangible assets
(d) ($0) ($0) ($0) ($0) ($0) ($0) ($0) ($0)
General and Administrative (a) ($142) ($134) ($132) ($122) ($116) ($83) ($54) ($4) (c) Transaction expenses
(c) ($10) ($4) ($8) ($3) ($2) ($4) ($25)(1) ($6)(1)
(d) ($1) ($1) ($1) ($1) ($1) ($1) ($1) ($1)
(d) Depreciation & Amortization
(e) ($1) ($5) ($4) ($1) ($1) ($2) ($2) ($1)
(f) ($13) ($18) ($13) ($2) ($1) ($2) ($3) ($0)
Product and Technology (a) ($26) ($26) ($25) ($20) ($25) ($22) ($8) ($0) (e) Litigation
(d) ($1) ($1) ($1) ($1) ($2) ($1) ($1) ($1)
(f) Other
Total Non-GAAP Operating Expense Adjustments ($241) ($233) ($226) ($186) ($180) ($151) ($119) ($35)
Adjusted Pro-Forma Operating Expenses
Cost of Revenue $223 $142 $159 $157 $134 $72 $32 $47
Sales and Marketing $263 $289 $157 $220 $184 $191 $43 $57
General and Administrative $74 $58 $41 $41 $52 $36 $33 $33
Product and Technology $42 $38 $36 $34 $39 $31 $27 $28
Total Adjusted Operating Expenses $601 $526 $393 $452 $410 $330 $135 $165
Note: Numbers may not foot due to rounding.
(1) Pursuant to the principles of Article 11 of Regulation S-X, the transaction costs related to the Business Combination have been eliminated in calculating our Pro-Forma Operating Expenses in Proforma Adjusted EBITDA tables in our 10K for the twelve months ended December 31, 2020. | 47
These costs were approximately $31mm for the year ended December 31, 2020 and are included in our GAAP Operating Expenses on this page.You can also read