Draft advice on Climate Change - NZ Automobile Association submission on: AA
←
→
Page content transcription
If your browser does not render page correctly, please read the page content below

26 March, 2021

NZ Automobile Association submission on:
Draft advice on Climate Change
SUBMISSION TO:                                   Climate Change Commission

REGARDING:                                       Response to CCC Draft Advice

DATE:                                            26th March 2021

ATTENTION:                                       Submissions analysis team

ADDRESS:                                         Climate Change Commission,
                                                 PO Box 24448,
                                                 Wellington 6142

SUBMISSION AUTHORISED BY:                        Mike Noon
                                                 General Manager, Motoring Affairs
                                                 New Zealand Automobile Association Incorporated (NZAA)
                                                 PO Box 1, Wellington, 6140

SUBMISSION AUTHOR:                               Peter King

AUTHOR E-MAIL:                                   Pking@aa.co.nz

AUTHOR PHONE:                                    (04) 931 9982

NOTE TO REQUESTOR:

The AA is happy to speak to this submission in person.

COPYRIGHT & PERMISSION TO REPRODUCE:

The content of this submission is the property of the NZAA. Information in it is relevant at the time
of authorship. The NZAA gives permission for content in it to be freely copied, cited and distributed,
but not altered, subject to due care that content used does not misrepresent the NZAA.

    NZAA submission: Climate Change Commission Draft Advice                                               2 of 57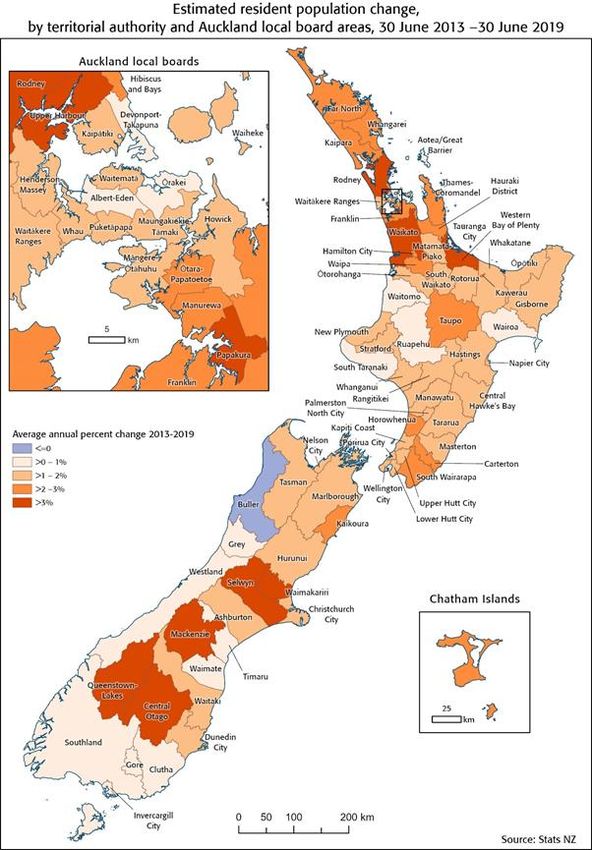
Contents
NZ Automobile Association submission on: Draft advice on Climate Change......................................... 1
   Introduction ........................................................................................................................................ 5
      Elevator Pitch .................................................................................................................................. 5
   What we think the Commission should do ......................................................................................... 7
   About the New Zealand Automobile Association ............................................................................... 9
Summary of contents and argument of this submission ...................................................................... 11
      Chapter One .................................................................................................................................. 11
      Chapter Two .................................................................................................................................. 11
      Chapter Three ............................................................................................................................... 11
      Chapter Four ................................................................................................................................. 11
      Chapter Five .................................................................................................................................. 11
      Chapter Six .................................................................................................................................... 12
Chapter One - AA Members and Climate Change ............................................................................... 13
Chapter Two –New Zealand Transport Emissions Since 2005. ............................................................. 14
   Traffic Congestion Increases Emissions ............................................................................................ 17
   Diesel Light Commercials and 3L Petrol SUVs are an issue .............................................................. 19
   What AA Members Think .................................................................................................................. 21
   Conclusions ....................................................................................................................................... 23
Chapter Three – Battery Electric Vehicle Supply and Demand............................................................. 24
   Effect of Electricity Carbon Intensity Internationally ........................................................................ 24
   Right Hand EV Production Rates ....................................................................................................... 25
   New Zealand uptake of EVs to date .................................................................................................. 29
   What AA Members think .................................................................................................................. 30
   Criticisms of the Climate Change Commission’s assumptions.......................................................... 32
   Conclusions ....................................................................................................................................... 33
Chapter Four – Phase Out of Internal Combustion Engines ................................................................. 34
   European Commission’s Previous Strategy was “Clean Diesel” ....................................................... 34
   Strategic concerns related to battery technology ............................................................................ 35
   Consequences of reliance on electric vehicles. ................................................................................ 38
   What AA Members think. ................................................................................................................. 39
   Conclusions ....................................................................................................................................... 42
Chapter Five – Biofuels: The Other Pathway ........................................................................................ 43

      NZAA submission: Climate Change Commission Draft Advice                                                                                                3 of 57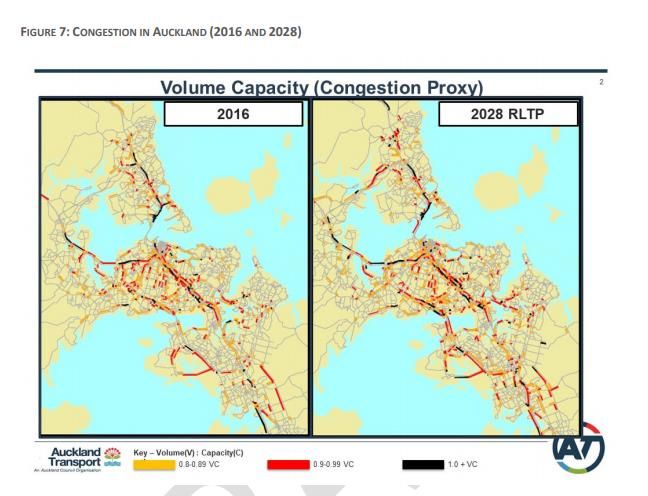
Chapter Six – Urban Development. ...................................................................................................... 50
Summing Up .......................................................................................................................................... 57

       NZAA submission: Climate Change Commission Draft Advice                                                                                             4 of 57
Introduction
The New Zealand Automobile Association (NZAA or AA) welcomes the opportunity to provide
comment on the Commission’s draft advice to Government on climate action in Aotearoa.

While the New Zealand Automobile Association will criticise the Commission’s findings with some
vigour this should not be interpreted as in any way criticism of either the Commission’s purpose or
the work of the Commission’s staff. The AA fully supports the purpose of the Commission and its role
as an independent advisor to the Government on climate change issues.

The AA is also impressed by the amount of work and the thoroughness that the Commission’s staff
have put into preparing the draft report. That said we also recognise that the Commission has, itself,
been working to a very tight timetable to prepare this draft report to a highly professional level and
that the draft report is only the first step in a very long journey. We hope this AA submission
provides useful antithetical thinking that can ultimately be synthesised into policy which benefits the
people of New Zealand.

Elevator Pitch:

        The Climate Change Commission has followed European thought leadership and has not
        contextualised its advice to recognise New Zealand as a small, impecunious right-hand drive
        nation in the Eastern hemisphere. Given the tight timeframes required to meet Climate
        Emergency and Paris Agreement emission targets more emphasis is needed on improving
        emissions from the existing fleet within existing urban frameworks.

Our broad critique is as follows:

1) Much of the Commissions economic modelling is based on techniques which cannot meet the
   fundamental questions of both the public and private sector. That is who, should optimally
   invest in which new emissions reducing technology and when? Instead Commission modellers
   make informed guesses of when these sectors might make such investments, and attempt to
   determine the effect this would have on the flow of goods and services in the economy.
   Unfortunately this then becomes a circular argument when the Commission raises the prospect
   of market interventions by government to force individual’s investments in particular
   technologies at particular times (e.g. a fossil fuel phase out).
    The fundamental questions for decision-makers remain:
   a) Which technology has what potential to reduce how much GhG emissions?
   b) What is the cost of these technologies to investors, infrastructure providers and regulators?
   c) Which agency (households, firms, govt) has what incentive to invest?
   d) Which agency has what means, knowledge and confidence to invest?
   e) How can these agencies be meaningfully and economically incentivized to invest?

    The Commission has not answered these critical questions.

    Another main concern is that the Commission’s general equilibrium model generates land value
    changes by industry based on changing trading conditions. It does not model the housing
    market. This means that the effect of land prices as an investment market in themselves is not
    captured. Given the massive impact of land values on the New Zealand economy and their

    NZAA submission: Climate Change Commission Draft Advice                                               5 of 57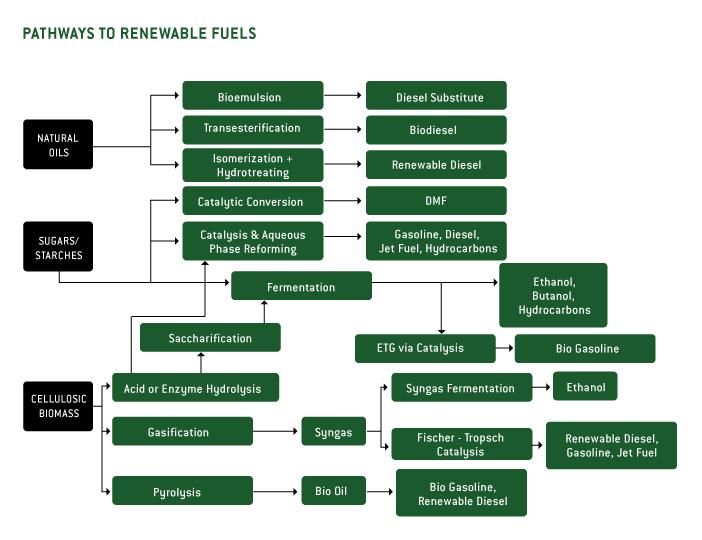
effects on the nation’s credit and costs of trade such limitations make the model an exercise in
    economic theory.

                                                     Value in the New Zealand Economy
                                         1,400,000

                                         1,200,000
       millions of New Zealand dollars

                                         1,000,000

                                          800,000
                                                                                             Property Values
                                          600,000                                            Money
                                                                                             home Loans
                                          400,000                                            All Credit

                                          200,000

                                                -
                                                     Mar-00
                                                     Mar-01
                                                     Mar-02
                                                     Mar-03
                                                     Mar-04
                                                     Mar-05
                                                     Mar-06
                                                     Mar-07
                                                     Mar-08
                                                     Mar-09
                                                     Mar-10
                                                     Mar-11
                                                     Mar-12
                                                     Mar-13
                                                     Mar-14
                                                     Mar-15
                                                     Mar-16
                                                     Mar-17
                                                     Mar-18
                                                     Mar-19
                                                     Mar-20
                                                               Quarters

2) The Commission has projected far too many savings from the rapid adoption of electric vehicles.
   These projections are not based on any historical rate of change in New Zealand or the
   automotive industry. We note that the EV target of 64,000 vehicles by 2021 set by Minister
   Bridges in 2016 will be undershot by roughly half this year (assuming 8,000 more EVs are added
   to the fleet to reach 32,000 this year) demonstrating the ease with which politicians can set
   distant targets without accountability. We will present evidence that the rates of change are not
   credible and reasons why the automotive world and indeed the influential purchasing nations in
   New Zealand’s Eastern Pacific and Indian Ocean hemisphere are not only unlikely to meet, but
   from a emissions reduction perspective would be unwise to meet.

3) The Commission has based its projections on a European regulator and technology push model
   which assumes that there is a domestic manufacturing base and all cars added to the register
   are new. In fact the automotive market in New Zealand is a far more complex balance of cultural
   supply and demand factors and costs and pricing are a vital part. The rise of the SUV in
   automotive culture should not be ignored. The axiom “culture eats strategy for breakfast” is
   completely relevant to any discussion on transformation and this culture has not been
   addressed by the Commission.

4) The Commission proposal relies too heavily on imported car technology by contrast Finland has
   adopted a strategy of adapting its fuel using domestically developed technology. The result is
   that Finnish companies are rapidly expanding globally to become leaders in biofuels. Ironically

    NZAA submission: Climate Change Commission Draft Advice                                               6 of 57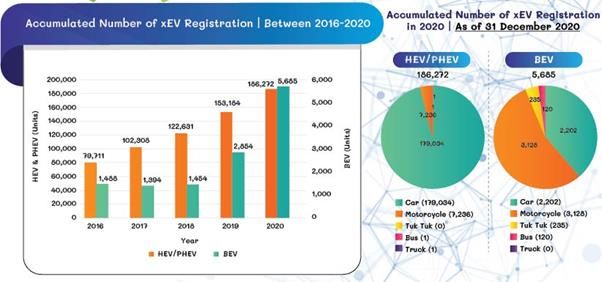
this means that at present New Zealand tallow is being processed in Finnish owned plants in
     Singapore for production of biofuels. There is a need for the Commission to look at opportunities
     as well as domestic costs.

5) The Commission has focused too much on urban transformation which it notes is a very long term
    strategy which (given the inevitable rise of EVs over a similar timeframe) is not strictly relevant
    to reducing New Zealand’s emissions. By contrast contemporary congestion has a very real
    effect on emissions due to the way the today’s internal combustion engine driven fleet operates.
    While mode shift is a potential mitigation pathway there is no evidence that mode shift is
    reducing emissions given the enormous growth in automotive transport demand. Responses to
    congestion are more to do with successful urban management some of which falls outside the
    scope of transport agencies.

What we think the Commission should do
While the commission has begun the useful process of centralising what is known about transport
and emissions the AA is concerned that a great deal remains unknown. This yields the following
recommendations for next steps for the Commission before releasing its final report.

1.       That the Commission immediately revise its EV modelling on emissions reductions based on
         the following:

         a.        EV uptake rates which reflect uptake rates of new automotive technology from
                   historical New Zealand precedents such as SUVs and hybrid technology.

         b.        The commission investigate the probability of EV supply constraints at prices New
                   Zealanders can afford

         c.        Investigate vehicle purchasing cycles in the motor vehicle register and using IDI data
                   examining fleets and households based on income, home ownership status and
                   vehicle age.

         d.        The commission model the emission effects of non-scrappage of the existing fleet in
                   the presence of high new vehicle prices

         e.        The debt effects on households of different levels of increased expenditure on
                   automotive technology, the access to debt markets and the significance of housing
                   equity, and the significance of increased depreciation rates for new automotive
                   technology, on households of different income levels.

2.       That the Commission itself soon commissions or co-commissions with other relevant
         government agencies a major investigation into the benefit costs of various synthetic fuels
         (stage two or above biofuels) strategies for New Zealand including:

     NZAA submission: Climate Change Commission Draft Advice                                                7 of 57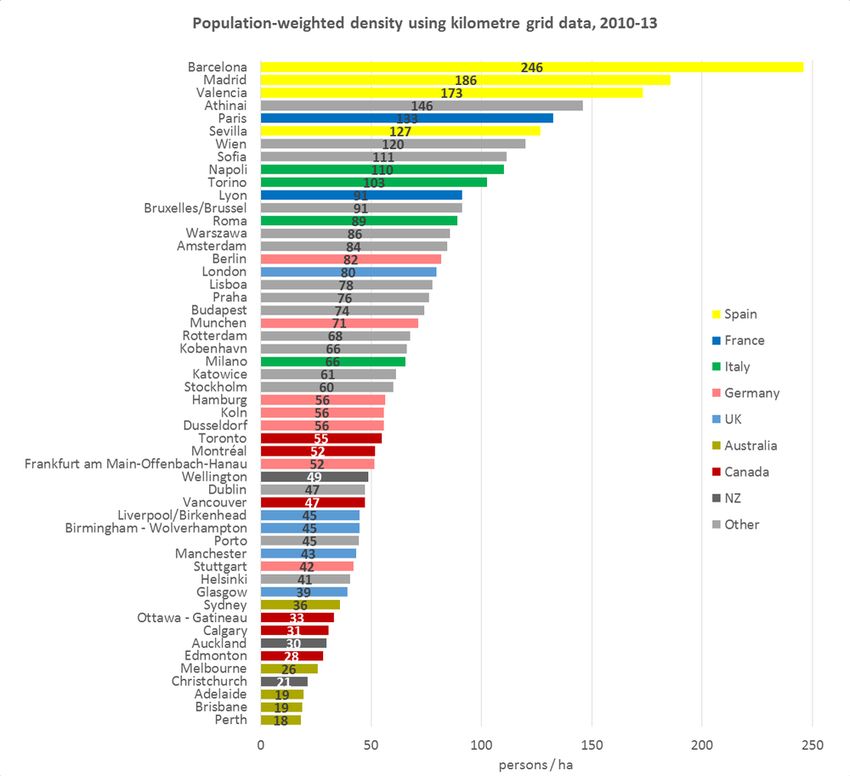
a.        The question of investment agency for synthetic drop-in replacement biofuels in
                   New Zealand. This should canvas public-private partnerships with local and
                   international firms as well as Iwi and local crown research agencies, the question of
                   competition between PPPs and the scope for other agencies to gain a level playing
                   field should they wish to enter the market.

         b.        The research and development and investment timeline needed for production of
                   drop-in replacement biofuels depending on the agency model adopted.

         c.        The construction, logistical and regulatory site requirements for synthetic fuel plants
                   in New Zealand and the return on investment levels at various rates of efficiency and
                   ETS price. Of particular concern here is the access to geothermal resources and
                   planning delay.

         d.        The export benefits of synthetic fuel supply from direct sales, and indirect sales via
                   tourism, exports at different levels of carbon tariffs in various markets (e.g. the EU).

         e.        A cost-benefit analysis of intervention options at various stages of the biofuels
                   development chain.

3.       That the commission ultimately investigates the relative emission time based cost/benefits
         of planning and non-transport technology policies on transport, in particular examining:

         a.        The effect on emissions of congestion and de-congestion on emissions allowing for
                   realistic mode change

         b.        The effect on emissions of proposed public transport investment allowing for urban
                   densification and mode change as well as technology shift to electric private
                   vehicles, compared to faster investments in alternate modes (e.g cycling and electric
                   pedestrian vehicles) and traffic management approaches.

         c.        The cost benefit of these different strategies in the context of the actual socio-
                   geographies of the rapid growth regions of Auckland, Waikato, Bay of Plenty and
                   Canterbury.

         d.        Investigate the emissions benefits of flexible and informal public transport systems
                   ranging from current Uber-style technology to semi and fully automated vehicles.

         e.        Investigate the emissions potential of increased uptake of electric pedestrian
                   mobility devices and the potential points of market failure that might hinder their
                   use

     NZAA submission: Climate Change Commission Draft Advice                                                  8 of 57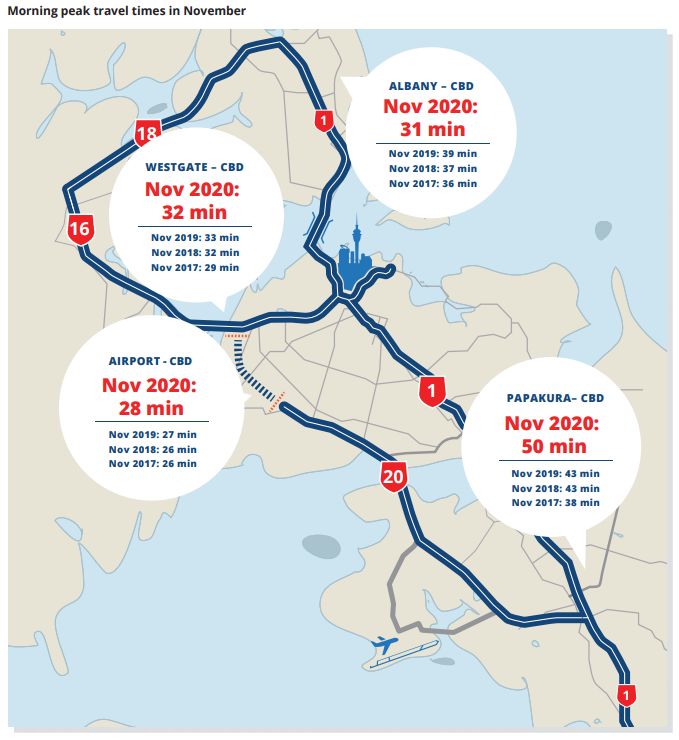
About the New Zealand Automobile Association
The NZAA is an incorporated society with over 1.7 million members, representing a large proportion
of New Zealand road users. The AA was founded in 1903 as an automobile users’ advocacy group,
but today our work reflects the wide range of interests of our large membership, many of whom are
cyclists and public transport users as well as private motorists.

Across New Zealand, the motoring public regularly come into contact with the AA through our
breakdown officers, 37 AA Centres and other AA businesses. Seventeen volunteer AA District
Councils around New Zealand meet each month to discuss local transport issues. Based in
Wellington and Auckland our professional policy and research team regularly surveys our Members
on transport issues and Members frequently contact us unsolicited to share their views. Via the AA
Research Foundation, we commission original research into current issues in transport and mobility.
Collectively, these networks, combined with our professional resource, help to guide our advocacy
work and enable the NZAA to develop a comprehensive view on mobility issues.

Motorists pay over $4 billion in taxes each year through fuel excise, road user charges, registration
fees, ACC levies, and GST. Much of this money is reinvested by the Government in our transport
system, funding road building and maintenance, public transport services, road safety work including
advertising, and Police enforcement activity. On behalf of AA Members, we advocate for sound and
transparent use of this money in ways that improve transport networks, enhance safety and keep
costs fair and reasonable.

Our advocacy takes the form of meetings with local and central government politicians and officials,
publication of research and policy papers, contributing to media on topical issues, and submissions
to select committees and local government hearings.

 Total Membership                                  1.7+ million members

                                                   Just over 1 million are personal members

                                                   0.7 million are business-based memberships

 % of licenced drivers                             Half of licenced drivers are AA Members

 Gender split                                      54%        Female

                                                   46%        Male

    NZAA submission: Climate Change Commission Draft Advice                                             9 of 57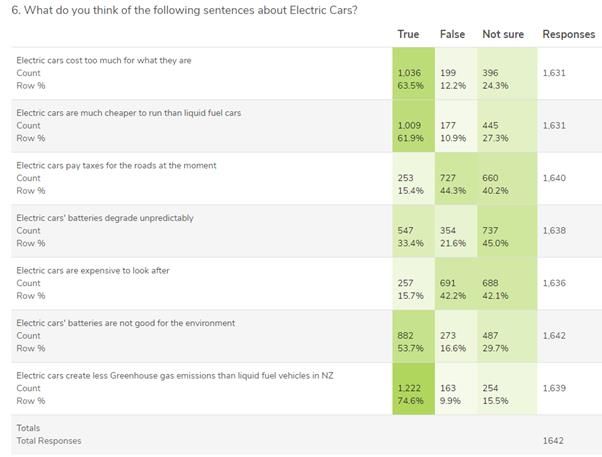
Age range & Membership retention
                                                                             Age of AA Members

                                                             65+ years old                             31%

                                                        45-65 years old                                      37%

                                                        25-45 years old                          22%

                                                    Under 25 years old                10%

                                                  Half of AA Members have been with us for 10 years or more.

   NZAA submission: Climate Change Commission Draft Advice                                                    10 of 57
Summary of contents and argument of this submission
Chapter One
AA Members support environmentalism but have low faith that the world will meet its climate
change targets and so are only willing to forego small sums of money toward climate change costs
(implying they think the sacrifice is futile). They support the concept of the clean car standard and
would like to see their ETS contribution from fuel purchases hypothecated to climate change
expenditure.
Chapter Two
New Zealand transport is dominated by the need for a car. The more people migrate to New Zealand
the more cars they buy and the more the car dominates emissions. However we show that
1. Migrants are focused into particular locations where congestion exacerbates their emissions
2. New Zealanders are buying larger and larger vehicles and that SUVs are a global issue. As the
IEA warns this cultural preference for SUVs threatens to swamp any savings from EVs in the
short term.
3. There is a gender equity issue in vehicle purchasing that needs to be considered.
Chapter Three
The EV is not a zero emissions vehicle, its emissions depend on the carbon intensity of the local
electricity supply. This explains why Australia has not moved to support the adoption of the EV, and
while some manufacturers believe they can produce non battery electric vehicles that emit less per
kilometre than the grid (in specific markets). This fully rational reluctance, plus the small size of the
right-hand-drive market, and the growing demand from the left-hand-drive market explains why
there could well be supply issues for right-hand-drive EVs
Chapter Four
Some nations have taken rhetorical stances in favour of phasing out fossil fuel vehicles though
legislation to this effect is much rarer. Deeper analysis however suggests phase outs may increase
emissions in those markets. It appears the European nations appear to backing out of a previous
policy blunders with so called “Clean diesel” vehicles. However the strategic issues around continuity
of supply of battery materials are far from settled for such move. There are also potential equity
issues over competition for electricity supply between EV owners and non EV owners in times of dry
year scarcity. AA Members see a phase out date as premature.
Chapter Five
Biofuels are recognized by the IPCC as a legitimate mitigation option. Second generation biofuels use
non-food vegetation (such as forestry) as feedstock New Zealand officials have not pursued biofuels
with vigour. However Finland (a small, forested nation of 5.5 million) has demonstrated that second
biofuels are a workable option and have been expanding their biofuels to the point that they will
probably achieve their 2029 target of 30%. This makes the Commissions estimate of 3% for New
Zealand look rather unambitious. Indeed New Zealand generally appears to be well behind the rest
of the world in biofuel development despite numerous natural advantages.
NZAA submission: Climate Change Commission Draft Advice 11 of 57Chapter Six
The cities in the main population growth centres in New Zealand are generating the greatest
increase in emissions are low density on a population weighted basis. This is partly due to increased
traffic but also because traffic management has not kept pace with growth creating increased
congestion. Urban authorities have tended to focus on very large public transport initiatives which
do not show a significant potential for emissions abatement but are mainly about reshaping cities
over the very long term. We suggest that instead of emphasizing marginal mode shift more focus
should be placed on improving the efficiency of the vast volume of traffic in the here and now. We
also suggest more effort be placed on examining problems of agency (i.e. is local government best
placed to reduce emissions) in terms of efficient investment in promoting working-from-home,
micro-mobility and ride hail innovations.
NZAA submission: Climate Change Commission Draft Advice 12 of 57Chapter One - AA Members and Climate Change
The following are the results of a Member survey before the general election in October 2020 which
mirror a similar survey in 2017. The number of respondents was 1079.
Question: How do Members feel about environmentalism?
Unequivocally supportive – 81% support or strongly support, a slight decrease on 2017
Question: What sort of transport habits do they have?
94% use a car (an eighth using cycles and public transport) and blame the car for three times more
greenhouse gas emissions (38%) than cars are actually responsible for (12%). Though their response
is correct if biogenic methane is excluded. Essentially the same as 2017.
Question: Have expectations regarding telework or electric vehicles changed?
In 2017 only 5.5% of employees were certain they would use teleconferencing, in 2020 48% of
employees worked from home one or more days a week. Prospects for electric vehicle purchases
were down slightly in line with increased financial concern related to the Covid-19 pandemic.
Question: Have views on global response to climate change changed?
No. As in 2017 two thirds still believe climate change targets are unlikely to be met by NZ and hardly
anyone believes the world will achieve them. At this time Donald Trump was still US President.
Question: How much do New Zealanders want to contribute to combating climate change now
compared to 2017:
As in 2017 half of those surveyed would still volunteer no more than $20 per month. But in 2020
those who are more committed to environmentalism volunteered more to increase the average
from $26 to $30 per month
Question: Have views about increased prices due to climate change shifted since 2017?
On a scale of 0 to 10 where 0 is relaxed and 10 is very upset a 5% increase in petrol and grocery
prices averages 5 in 2020, where it was 3.92 in 2017. A 25% increase has increased only slightly to 7
in 2020 when it was 6.6 in 2017.
Question: How would Members respond to higher prices now compared to 2017?
No change. A 5% fuel price increase makes almost no difference to travel choices. A 25% increase
would “certainly” make 11% change the way they travel, while 25% would “probably” change.
Question: What do Members think about the “Clean Car Standard”?
They support it 2:1, so long as it does not compromise road safety, locational and gender equity and
the extra cost is no more than the cost of the vehicle’s emissions above the standard over its
lifetime.
Question: What do Members think about hypothecating ETS income?
They support it 3:1.
The AA is firmly of the view that the income from the ETS (which at $39 a tonne would be $588
million per annum at 2019 volumes) should be hypothecated to climate change mitigation.
NZAA submission: Climate Change Commission Draft Advice 13 of 57Chapter Two – New Zealand Transport Emissions Since 2005.
We take as read the Commission’s focus on light vehicles. New Zealand is a highly car dependent
country. The more people there are the more cars we buy and drive on our roads.
The correlation between population and vehicle numbers is extremely high1. Therefore the more
people there are, the more cars they will buy, and the country has maintained a positive immigration
policy for quite some time.
Statistics New Zealand has published the following map showing the regions that have experienced
the most population growth in recent times.
1 2
r = 0.986845145, Students T-Test p-value= 1.76564x10⁻¹²
NZAA submission: Climate Change Commission Draft Advice 14 of 57Not surprisingly this is reflected in the change in kilometres travelled by region.
NZAA submission: Climate Change Commission Draft Advice 15 of 57Which shows that the growth in emissions has occurred where the population has grown the most.
This is hardly surprising but it does suggest that a geographically focused emissions abatement policy
on high growth areas makes more sense than on areas where growth is negative.
The Household Transport Survey shows the role of the car remains central to transport throughout
the whole country
NZAA submission: Climate Change Commission Draft Advice 16 of 57Traffic Congestion Increases Emissions
Congestion has a corrosive effect on internal combustion engine (ICE) vehicle efficiency. The internal
combustion engine expends 80% of its fuel energy as heat and noise and continues to do so whether
the vehicle is in free flow traffic or creeping in traffic jams. In general ICE vehicles are at their most
efficient when operating at between 60 and 80km/h. The efficiency of roading networks therefore
have a direct bearing on travel time and hence the emissions of the vehicle fleet when converting
fuel to completed trips. The more delay the more fuel an ICE vehicle expends and the more
emissions it creates. This is incontrovertible physics but because road controlling authorities are not
responsible for the emissions on their networks techniques to reduce emissions remain unmeasured
and untested. Barth and Booriboonsomsin (2010) suggest these could reduce emissions by 7- 12%.
Notably the Tomtom international congestion monitor for 2020 ranks Auckland the most congested
city in Australasia followed by Sydney, Wellington (3rd), and Hamilton (4th). Christchurch is ranked
seventh and Tauranga is ranked ninth. This correlates with the population growth in these areas but
also demonstrates that growth in travel by region can also correspond with a reduction in vehicle
efficiency in these areas due to growth in congestion. Failure to efficiently manage traffic growth, or
worse policies which regard congestion increases as a means to encourage modal shift (the evidence
being that in the absence of responsive alternatives minimal shift occurs) simply increase the
emissions beyond the rate due simply to population growth. To date the trade-off between
congestion reduction by direct means and mode shift has not been properly studied in a New
Zealand context. By contrast the costs of congestion have with NZIER (2017) finding that reducing
Auckland congestion would be worth 1% of Auckland’s GDP.
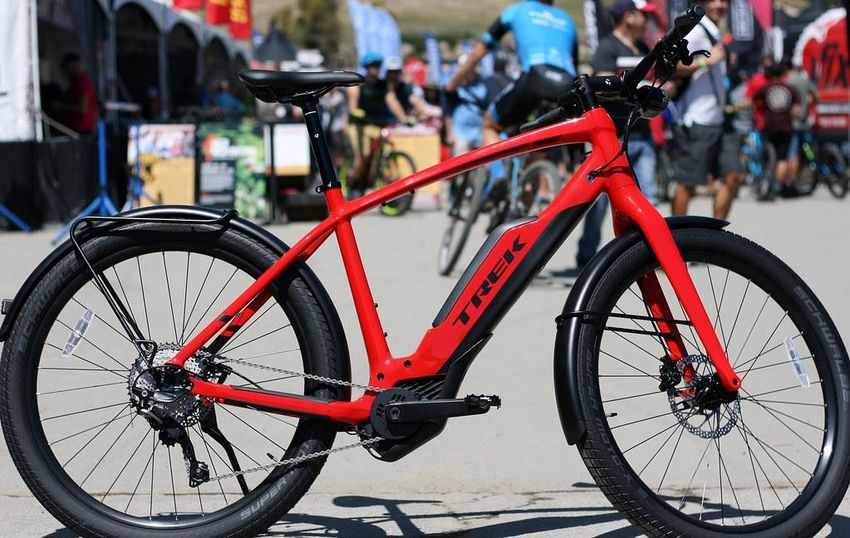
But it is not just about the quantity of cars on our roads. It is also about their qualities. This brings us
to the nature of the New Zealand fleet. The dispersed nature of settlement and low urban densities
in New Zealand means the public spend a significant amount of money ($8.7bn in 2019) on cars each
year. This has ranged from 3.5% to 1.9% of GDP over past fifteen years. The average value of each
imported vehicle (including Cost Insurance and Freight) ranged from around $12,000 up to $17,500
by 2019. Given that the average value of a new vehicle is considerably greater this suggests that the
imported value of used vehicles (3/5ths of imports) is considerably lower. That is because the
average age of a used vehicle at import has increased from 7.3 years to 10.23 years since 2000. In
short the public are voting with their wallets for low cost private transport.
NZAA submission: Climate Change Commission Draft Advice 17 of 5785% of all light vehicles are imported from Japan and 24% of all vehicles sold in New Zealand are
made by Toyota. Most of the remainder come from Europe or the Americas.
However it would be wrong to conclude that used vehicles contribute the most to Greenhouse gas
emissions because the older the vehicle the less distance on average it is driven per year (and the
less fuel it burns and hence the less emissions it makes). New Utes and vans are driven the furthest.
In fact most of the kilometres (and hence emissions) growth most has come from new diesel light
commercial vehicles and large petrol engine vehicles to 3 litres. These have replaced the medium
vehicle category to 2 litres. What we are effectively talking about is the rise of the SUV and Ute. This
is not just a New Zealand phenomenon.
NZAA submission: Climate Change Commission Draft Advice 18 of 57Diesel Light Commercials and 3L Petrol SUVs are an issue
As the following graph shows the light commercial fleet is mostly new and diesel.
The International Energy Agency reports that the global impact of the rising share of SUVs in the
global fleet has had a global effect on emissions. It states ”SUVs were the second-largest
contributor to the increase in global CO2 emissions since 2010 after the power sector“
The authors state “While discussions today see significant focus on electric vehicles and fuel
economy improvements, the analysis highlights the role of the average size of car fleet. Bigger and
heavier cars, like SUVs, are harder to electrify and growth in their rising demand may slow down
the development of clean and efficient car fleets. The development of SUV sales given its
substantial role in oil demand and CO2 emissions would affect the outlook for passenger cars and
the evolution of future oil demand and carbon emissions.”
It notes:” If consumers’ appetite for SUVs continues to grow at a similar pace seen in the last decade,
SUVs would add nearly 2 million barrels a day in global oil demand by 2040, offsetting the savings
from nearly 150 million electric cars”.
NZAA submission: Climate Change Commission Draft Advice 19 of 57SUV Sales as percentage of all light vehicle sales
However it should also be noted that there is a difference in usage between diesel and petrol
vehicles.
MoT Household Travel Survey data shows:
Purpose by % of VKT Petrol Diesel
01. Went home 32% 28%
03. Went to work 13% 16%
04. Shopping/personal 23% 20%
appointments/services/volunteer
05. Social visit/entertainment 16% 13%
06. Made a trip for work 8% 17%
07. Completed study/education 1% 1%
09. Accompany 6% 4%
someone/dropped someone
off/picked someone up
11. Sport and exercise 2% 2%
So not surprisingly diesel vehicles are used more for work than petrol vehicles. It should also be
remembered that not all SUVs are employed by farmers and tradespeople, some of that work may
be accountancy. It should also not be forgotten that trips for shopping or entertainment generate
trade and hence work for someone else.
What we are facing here, is, culture. New Zealanders have adopted a culture of buying large vehicles
in much the same way as Americans and Australians have. What we have seen to date is New
Zealanders replacing small, old hatchbacks which do not emit much in the way of Greenhouse Gases
with EVs, while the market for high emitting diesel light commercials continues to grow.
This has been partly because of the shortage of PHEV and BEV SUVs on the New Zealand market, but
mostly because the low purchase prices of conventional SUVs and Utes make the size to price
equation seem more attractive to buyers i.e. “More car for your money”.
NZAA submission: Climate Change Commission Draft Advice 20 of 57What AA Members Think
The latest AA Membership survey focused on the Climate Change Commission report and asked
Members how much they would be prepared to spend on replacing their current vehicle. It was
notable the difference in budgets and vehicle types between men and women.
Women (n=442)
Compared with
Men (n=662)
The income gap between men and women was 9.5% in 2020 . This suggests that the low cost second
hand vehicle is largely the domain of women. Women, on average, drive 8,000km per year
compared to men who drive more expensive vehicles on average 12,000km a year. Women drivers
therefore emit fewer GhG than men. Gender equity is a real issue.
AA Member Surveys (Carbon Costs October 2020) have found Members support (67%) increased
costs for importing high emitting vehicles but there were conditions:
NZAA submission: Climate Change Commission Draft Advice 21 of 571) Three quarters insisted on no compromises for road safety
2) Half felt that the policy should:
a) make a proportional contribution to climate change goals
b) be fair regardless of where people live
c) be fair with respect to gender
But simply increasing import costs runs the risk of a perverse outcome. If the price of new SUVs is
increased this will decrease supply against a clear demand and drive up the price of old SUVs in the
domestic fleet, and hence encourage owners to continue maintaining old diesel vehicles for even
longer than they do now. The simplest disincentive for using high emitting vehicles is a high carbon
price. This also serves as an incentive for buyers to switch to low emissions fuels.
At present the most important border controls on vehicles relate to safety. From 1 July 2015 all
imports were required to have electronic stability control. Frontal impact standards mean that
Japanese micro cars (Kei class) which make up a third of the Japanese fleet but which have tiny 650
to 800cc engines and emit less than 100gm CO2 per km.
The overall nature of the New Zealand fleet is determined by a raft of such rules rather than any
overall strategy on imports or retirement. Such a strategy is well overdue. This is not a call for
central planning of 5 million New Zealanders transport needs, but rather a call for a better grasp by
officials of the drivers of the vehicle market.
NZAA submission: Climate Change Commission Draft Advice 22 of 57Conclusions
• Immigration drives population growth and population increases drive transport demand
increases. As the Government sets immigration policy it is effectively setting emissions
policy via transport.
• The growth in emissions is largely concentrated in Auckland and the Waikato, Bay of Plenty
triangle, with some growth in Canterbury. It is clear that effective localised policies in these
areas could have more effect on emissions growth than national policies.
• Very high rates of congestion in these population growth areas compounds the inefficiency
of growing local fleets.
• New Zealanders spend significant sums on equipping themselves with cars to drive but
because New Zealand is a car dependent nation this means that disadvantaged groups (who
generally contribute less to emissions than more affluent groups) will be marginally more
disadvantaged by increased vehicle costs and flat taxes as opposed to progressive ones.
• 85% of all light vehicles imported into New Zealand are sourced from Japan due to the fact
both nations drive on the left side of the road. Some manufacturers (e.g GM) have
completely abandoned the right hand drive market. Therefore the manufacturers of Japan
effectively define the scope of what is possible within the New Zealand fleet.
• The trend towards SUVs has locally and internationally had a significant effect on emissions
growth since 2005. The physics of heavier vehicles necessitates increased energy per
kilometre travelled. The substitution effect of SUVs on medium vehicles may significantly
impact on emissions reducing effect of small numbers of very low emissions vehicles.
A better understanding of how New Zealand’s vehicle fleet meets its needs and how it could
be better structured to meet long term goals should form the basis of an overall fleet
strategy.
NZAA submission: Climate Change Commission Draft Advice 23 of 57Chapter Three – Battery Electric Vehicle Supply and Demand
There is no question that the automotive industry is being disrupted by the advent of battery electric
vehicles and shocked by the equity which Tesla has been able to raise (Tesla is the largest automaker
by market capitalization). However the question at issue for the Climate Change Commission is the
rate with which the New Zealand public will want to invest in electric technology vehicles.
To understand this a global view is needed. Unfortunately globally there is a widespread
misconception among environmental lobbyists that the absence of a tailpipe on battery electric
vehicles means that these vehicles are so-called “zero emission vehicles” and not responsible for any
Greenhouse gas emissions. This is simply not the case. Liquid fuels, pressurised gas fuels and solid
state batteries are all simply means to store energy. The energy in batteries comes from an
electricity grid and the generation and distribution of electricity produces greenhouse gas emissions.
In New Zealand the emissions intensity of electricity generation ranges from 150 grams per kilowatt
hour (September 2020 when hydro was 54% of generation) down to 72 grams per kilowatt hour
(December 2018 when hydro was 63% of generation). The Nissan Leaf is the most popular battery
electric car in New Zealand comprising about two thirds (64%) of the electric fleet and consumes (on
average) 17.2 kwH per 100 km. That means a Leaf was responsible for emitting 25g of CO2 per km in
September 2020 and half that in December 2018. The September 2020 figure is the equivalent of a
petrol vehicle with an efficiency of 1 litre per 100 kilometres.
Effect of Electricity Carbon Intensity Internationally
There is no question that in New Zealand a Leaf produces much less emissions than a conventional
ICE car. But this is not so in nations which do not boast the same share of renewable generation as
New Zealand does. For this reason replacing internal combustion engine vehicles with battery
electric vehicles is not necessarily an emissions reducing strategy for all nations.
In 2016 the Germany upper house resolved that all vehicle sales from 2030 should be electric. But
because Germany’s electricity carbon intensity is at best 401 grams per kilowatt hour (at maximum
wind and solar production) it is possible that such a mandate could actually increase German
Greenhouse gas emissions2 rather than reduce them because the shortfall in energy needed for
transport cannot be met by sufficient renewables. This will drive up the grid carbon intensity making
BEVs emit more.
While Australian environmentalists have complained that their government has fallen behind the
world for failing to mandate or stimulate the BEV car market in that country there are good reasons
why this has not happened. The problem is the emissions intensity of the Australian grid which is
mostly powered by coal.
2
https://theconversation.com/germanys-plan-for-100-electric-cars-may-actually-increase-carbon-
emissions-72997
NZAA submission: Climate Change Commission Draft Advice 24 of 57Australian Electricity Carbon Intensity as Petrol Vehicle Fuel Efficiency Equivalent
NSW/ACT VIC QLD WA SA TAS NT
GCO2/KWH 830 1080 790 700 490 140 640
GCO2/KM 160 209 153 135 95 27 124
Petrol 6.9 9.0 6.6 5.8 4.1 1.2 5.3
vehicle
L/100KM
Equivalent
Given that the average Toyota Corolla hybrid achieves 4.2L/100km a Nissan Leaf emits more CO2 per
kilometre in all Australian states except South Australia and Tasmania.
The Australian government has therefore rightly determined that the country does not stand to gain
from more electric vehicles. Unfortunately this pattern is true across almost all the nations that drive
on the left hand side of the road or manufacture vehicles for that market. This is the energy intensity
of these grids of these nations (best case), notably before new generation must be found for an
electric vehicle fleet.
JAPAN KOREA THAILAND SINGAPORE CHINA INDIA SOUTH UK
AFRICA
GCO2/KWH 506 500 445 250 555 708 928 347
GCO2/KM 87.5 86.5 77.0 43.3 96.0 122.5 160.5 60.0
L/100KM 3.8 3.7 3.3 1.9 4.1 5.3 6.9 2.6
EQ
Source: https://www.carbonfootprint.com/international_electricity_factors.html
One can understand why Akio Toyoda the president of Toyota has questioned the wisdom of
transferring the responsibility for reducing transport emissions and providing the necessary daily
energy to national grid operators. As a nation reliant on manufacturers in other countries providing
technology New Zealand policy makers should be more aware of the business drivers that could lead
to supply constraints on electric vehicles globally than has to date been the case.
Right Hand EV Production Rates
At present EVs are around 2.5% of global light vehicle sales. The largest manufacturer is Tesla which
in 2019 produced 370,000 units in 2019 and just shy of 500,000 in 2020. This annual output is less
than Toyota’s 750,000 unit monthly production. By far the bulk of deliveries are to left hand drive
markets with sales in Europe in particular growing on the back of strong incentive schemes.
NZAA submission: Climate Change Commission Draft Advice 25 of 57Source: McKinsey 2020
By contrast the main manufacture of right hand drive units is Japan which produces significantly less.
Japanese Production HYBRID PHEV BEV
2012 887,863 10,968 13,469
2013 921,045 14,122 14,756
2014 1,058,402 16,178 16,110
2015 1,074,926 14,188 10,467
2016 1,275,560 9,390 15,299
2017 1,385,343 36,004 18,092
2018 1,431,856 23,230 26,533
2019 1,472,281 17,609 21,281
12-YEARS Total 10,896,322 141,689 152,134
Source Data: Japanese Automobile Manufacturers Association
In short Japan’s total production of Battery Electric and Plug-in Hybrid vehicles to date is the
equivalent of one year’s imports to New Zealand.
If we compare the rate of production growth between Japan’s hybrid and battery electric
development it becomes apparent that Japanese manufacturers are not growing their BEV
production as quickly as hybrid production grew, when comparing year by year production (1996 is
year one for hybrids 2010 year one for BEVs)
NZAA submission: Climate Change Commission Draft Advice 26 of 57It is also important that any assumptions about the ability for manufacturers to economically
transform production lines from one technology to another is based on commercial realities rather
than ephemeral political edicts – especially those in Europe which has little to do with the NZ
market.
The transformation of the Japanese motor industry from conventional internal combustion engine
technology to hybrid technology has been evolutionary rather than revolutionary.
Source Data: Japanese Automobile Manufacturers Association
It has taken the Japanese automakers over 25 years to transform production from 100%
conventional technology to less than 20% hybrid. This is why Tesla has been able to claim such a
significant share of the EV market. It doesn’t have to rely on sales because capital markets have
given it such a vast market capitalisation (over US$653 billion at time of writing) to work from.
NZAA submission: Climate Change Commission Draft Advice 27 of 57Toyota aims to increase its EV production to 500,000 units annually by 2025 and has announced six
new models to achieve this. However, if you compare the exponents of the power equations
describing the Japanese growth of hybrids (2.5) vs the growth of BEVs (1.2) it becomes apparent that
if the Japanese had invested as much in BEVS as it did hybrids it would have already passed this
target by now. As it is it will have to take a leaf of Tesla’s book and develop completely new systems
and factories to have any chance of coming close to meeting this target.
Given the competition from Tesla it is highly likely that Toyota is more likely to compete in the
enormous left-hand drive EV market than the right-hand drive domestic market it already owns. The
only challenge could come from Tesla’s new Gigafactory in Shanghai which will reportedly
manufacture 100,000 right hand drive units per year. The obvious destination for most of these
vehicles is Japan.
Of the other manufacturing nations in the eastern hemisphere progress is even more limited.
South Korea exported 276,000 hybrid and electric vehicles in 2020. However of the 17,693 hybrids
and plug in hybrids sold in January 2021 only 1,654 (9.3%) were plug in hybrids. As Korea is a left
hand road nation it is not clear how many were right hand drive.
Thailand, the source of so many of the SUVs exported to Australasia is even further behind in both
take-up and manufacture with joint ventures with SAIC and Mitsubishi only recently started.
Source: Thai Electric Vehicle Association
While China is a huge manufacturer of electric vehicles it exports very few. This is largely because
the domestic market absorbs most of its production leaving exports to state owned corporations
such as SAIC Motor Corporation (formerly Shanghai Automotive Industry Corporation) which sells
under a number of brands including MG and Roewe. The major interest to New Zealand is the MG -
ZS range of electric SUVs built in Thailand, however the lack of any EV incentive scheme in Australia
means that the Australasian market is considered difficult to enter.
NZAA submission: Climate Change Commission Draft Advice 28 of 57Indian manufacturers like South African manufacturers have barely begun to start in electric vehicle
production and likewise have huge domestic markets to attend to.
To distribute cars to New Zealand any manufacturer must already be quite large and well established
globally. Indeed all auto manufacturers for new car sales regard New Zealand as part of the greater
Australasian market and anecdotally it has been difficult for fleet buyers seeking EVs to find a source
of supply. By itself New Zealand (without Australia, which has already seen the collapse of its
domestic manufacturing industry due to small scale) is a tiny right hand drive market in a vast left
hand drive world brimming with richer opportunities. All of this suggests that the international
availability of new right hand drive electric vehicles will be constrained.
New Zealand uptake of EVs to date
To date (end of 2020) the New Zealand EV market (totalling 24,037 vehicles) has not varied
significantly from the general automotive market. Second hand Nissan Leafs completely dominate
EV registrations. In that second hand imports make up at least half of it. Among new vehicle
registrations it is notable that Tesla has managed to achieve a sizeable share of the very small luxury
EV market.
Source Data: Ministry of Transport
NZAA submission: Climate Change Commission Draft Advice 29 of 57It is also plain that EVs are largely attractive to those living in our largest urban areas.
What AA Members think
For this submission the AA ran a Member survey which included questions on vehicle purchasing of
EVs.
We asked about attitudes to EVs, as well as budgets and common beliefs about EVs.
NZAA submission: Climate Change Commission Draft Advice 30 of 57n = 1,655
NZAA submission: Climate Change Commission Draft Advice 31 of 57Criticisms of the Climate Change Commission’s assumptions
The Climate Change Commission appears to have based its fleet EV uptake model on the Ministry of
Business Innovation and Enterprise’s Electricity Demand and Generation (EDG) Scenarios and the
Ministry of Transport Vehicle Fleet Model (VFEM). We say appears because the information that has
been released by the Commission is unfortunately obscure and unhelpful in this regard.
The EDG model is essentially based on an assumed preference for EVs as soon as the price reaches a
parity with internal combustion models. Models for the price differential are based on best guess
values derived from international literature. Unfortunately this literature is locked into nations
where vehicles entering the fleet are always new. This is not the case in New Zealand where over
half are used. While these vehicles have lower purchase prices they also have much shorter lives in
New Zealand than comparable internal combustion engine models – something the public is aware
of. Early versions (2015) of the EGD also assumed PHEV models would predominate however this
has proven not to be the case.
The VFEM model (kindly shared by the Ministry of Transport) does not explicitly state its
assumptions but provides a number of scenarios for the uptake of EVS. Unfortunately when
compared with reality there are interesting discrepancies. The VFEM seems to exclude the used
market from its totals.
Year Japanese VFEM Actual NZ Actual % New of % Used of
Registration BEV + PHEV Projections New Used Japanese Japanese
Production Registrations production Production
2014 32,288 325 362 127 1% 0%
2015 24,655 502 656 336 3% 1%
2016 24,689 1,493 1,360 1,129 6% 5%
2017 54,096 3,652 1,780 1,469 3% 3%
2018 49,763 5,415 3,942 7,696 8% 15%
2019 38,890 6,926 6,740 11,785 17% 30%
Source data: JAMA, MOT
NB: While most of the Used EVs are Japanese in origin this is not true of new vehicles.
The good news is that the VFEM model uses a more conservative growth curve than the actual rate
of production growth of hybrids. Unfortunately there is no evidence as yet that Japanese
manufacturers will replicate the hybrid rate with BEV and PHEV models and current growth is well
behind hybrids.
What however the percentage of Japanese production is showing is that New Zealand used car
dealers have been quick to supply the New Zealand market with used Leafs but are effectively
mining a dwindling resource. In short the uptake of EVs which has occurred in recent years has been
dependent on a supply of low cost second hand vehicles bought by-and-large by individuals rather
than fleet buyers.
This reinforces serious questions regarding vehicle retirement and scrappage. Second-hand electric
vehicles have a shorter working life in New Zealand than second-hand diesel vehicles which on
average drive 40,000km further than petrol vehicles. More to the point vehicles with both larger
NZAA submission: Climate Change Commission Draft Advice 32 of 57petrol and diesel engines tend to be driven further. This raises the question of whether electric
vehicles are simply substituting for small petrol vehicles and not the large petrol and diesel
commercials which have seen so much growth in the last fifteen years.
This could well mean that the effect of substituting a 25 gm CO2e /km Leaf for a 105gm CO2e Yaris
which is driven 80,000km less than the average Ute is not going to make any significant difference in
the short term, given population (and hence fleet) growth and the continuing demand for long-lived
large utilities.
Conclusions
There is no question that EVs are a sea-change in the automotive world. This is not in dispute. The
question at issue is volume supply to a small right-hand drive nation (New Zealand) which usually
coat-tails on a larger market (Australia) that is rightly sceptical about the benefits of EVs given the
carbon intensive nature of its electricity grid.
The benefits of EVs to New Zealand’s greenhouse gas emissions are not matched in many other
countries. This is especially important with regard to Australia to which automotive manufacturers
attach New Zealand as a single market for logistical convenience. Therefore supply of new models of
EVs is likely to continue to be dictated by the rate with which Australia greens its electricity
generation. In the used market the question will be whether the Japanese car industry is able to
convince its government that it can deliver lower emissions per vehicle than the Japanese grid.
The right hand drive market is a very small subset of the total automotive market. Even the Nissan
Leaf has mostly been sold to the left hand drive market. The main export manufacturers servicing
Australasia are Japan and Thailand. Japan sells both new and used small, and medium and large
engine vehicles plus second hand European vehicles. Thailand tends to supply larger engine SUVs.
Korea has entered the Australasian market in competition with Japan. China markets commercial
vehicles and sells right hand drive vehicles (especially the MG brand) to Britain. The European luxury
vehicle manufacturers have always had a presence in New Zealand. However the main action for
manufacturers is in the left hand drive market where the bulk of the world’s markets are and
competition for market share is becoming heated. We anticipate supply restrictions as
manufacturers pursue larger and more lucrative markets.
Scarcity of supply may well mean that prices do not fall as quickly as the Commission has assumed in
its modelling regardless of the costs of production.
We find AA members support EVs in theory but are dubious about them in practice and many lack
quite basic knowledge about them.
NZAA submission: Climate Change Commission Draft Advice 33 of 57Chapter Four – Phase Out of Internal Combustion Engines
A number of nations have declared the intention to introduce cut-off deadlines for the sale of non-
electric vehicles. Many of these are incorporated in climate action plans although actual enforceable
legislation is considerably less common. The objective appears to be to force manufacturers to make
technology transitions that would not occur under normal commercial conditions.
Source ICCT 2020
Germany in particular appears to be the main source of this movement with the Bundesrat (upper
house) passing a resolution (which is not a law, despite what numerous sources say) calling for a ban
by 2030 in 2016. A second part of the vote called for an elimination of EU policies that favour diesel
cars, including lower taxes on sales of new diesel automobiles and lower taxes on diesel fuel.
Government officials argued that these current lower costs for diesel cars are detrimental when
trying to encourage buyers to switch to zero emissions cars. While not enforceable the Bundesrat
vote is meant to guide legislators.
European Commission’s Previous Strategy was “Clean Diesel”
In some ways the German move brings to a close a decades-long effort by European officials to
favour so-called “clean diesel”. Carnes and Helmers (2015) trace the European Union’s efforts to
shift automobile production toward diesel power trains in the name of greenhouse gas reduction. By
contrast to Europe the US and Japan rejected the diesel substitution as infeasible and in fact not only
did greenhouse gas reduction in Europe not occur but Carnes and Helmers3 allege that European
3
Cames and Helmers Environmental Sciences Europe 2013, 25:15
http://www.enveurope.com/content/25/1/15
NZAA submission: Climate Change Commission Draft Advice 34 of 57officials were actually acting to find markets for European refineries facing shrinking demand for
heating oil in the face of a growing switch to LNG for home heating.
“Clean Diesel” VW Golf at US motor show in 2012.
Be that as it may the net result of the European Union’s excursion (through preferential regulatory
and fiscal discrimination) into diesel automobiles has been more carbon emissions than might
otherwise have been, growing and dangerous levels of local air pollution (particulate matter less
than ten microns in particular) and widespread fraud among automotive manufacturers (so called
Dieselgate) trying to resolve the contradictions between EU emissions regulations and feasible
engine technology.
Coincidentally in 2016 (as it was being pilloried for Dieselgate globally) Volkswagen (which that year
pipped Toyota to be Forbes’ world’s largest automotive manufacturer) announced an “electrification
strategy” to be completed by 2025. Days before the announcement Volkswagen, without
consultation, pulled the plug on its South Korean battery suppliers and switched to Chinese suppliers
While Volkswagen may be happy to rely on Chinese firms to provide the technological underpinning
of its diesel to electric pivot, in Brussels the EU was becoming concerned that Europe was in danger
of losing strategic control of automotive energy systems. The European Commission is not the only
one concerned about the sustainability of EV battery supply.
Strategic concerns related to battery technology
McKinsey4 notes that for its projections of 36 million EV units globally will depend on many things
including supply of Lithium and Cobalt. 86% of Lithium supply comes from Chile, Australia and China
while 69% of the world Cobalt is mined in appalling conditions in the Democratic Republic of Congo.
4
“Lithium and cobalt - a tale of two commodities”, McKinsey and Company, Metals and Mining, June 2018
NZAA submission: Climate Change Commission Draft Advice 35 of 57You can also read