Discrimination of selected species of pathogenic bacteria using near-infrared Raman spectroscopy and principal components analysis
←
→
Page content transcription
If your browser does not render page correctly, please read the page content below
Discrimination of selected species of
                 pathogenic bacteria using near-infrared
                 Raman spectroscopy and principal
                 components analysis

                 Fernanda SantAna de Siqueira e Oliveira
                 Hector Enrique Giana
                 Landulfo Silveira, Jr.

Downloaded From: https://www.spiedigitallibrary.org/journals/Journal-of-Biomedical-Optics on 02 Jul 2022
Terms of Use: https://www.spiedigitallibrary.org/terms-of-use
Journal of Biomedical Optics 17(10), 107004 (October 2012)
Discrimination of selected species of pathogenic bacteria
using near-infrared Raman spectroscopy and principal
components analysis
Fernanda SantAna de Siqueira e Oliveira,a Hector Enrique Giana,b and Landulfo Silveira Jr.c
a
Universidade Paulista—UNIP, Instituto de Ciências e Saúde, Rod. Pres. Dutra, km 157, São José dos Campos, SP, Brazil 12240-420
b
Laboratório Oswaldo Cruz, Pça. Cândida Maria Sawaya Giana, 128, São José dos Campos, SP, Brazil 12243-003
c
Universidade Camilo Castelo Branco—UNICASTELO, Biomedical Engineering Institute, Parque Tecnológico de São José dos Campos, Rod. Pres.
Dutra, km 138, São José dos Campos, SP, Brazil 12247-004
Abstract. A method, based on Raman spectroscopy, for identification of different microorganisms involved in bac-
terial urinary tract infections has been proposed. Spectra were collected from different bacterial colonies (Gram-
negative: Escherichia coli, Klebsiella pneumoniae, Proteus mirabilis, Pseudomonas aeruginosa and Enterobacter
cloacae, and Gram-positive: Staphylococcus aureus and Enterococcus spp.), grown on culture medium (agar),
using a Raman spectrometer with a fiber Raman probe (830 nm). Colonies were scraped from the agar surface
and placed on an aluminum foil for Raman measurements. After preprocessing, spectra were submitted to a prin-
cipal component analysis and Mahalanobis distance (PCA/MD) discrimination algorithm. We found that the mean
Raman spectra of different bacterial species show similar bands, and S. aureus was well characterized by strong
bands related to carotenoids. PCA/MD could discriminate Gram-positive bacteria with sensitivity and specificity of
100% and Gram-negative bacteria with sensitivity ranging from 58 to 88% and specificity ranging from 87% to
99%. © 2012 Society of Photo-Optical Instrumentation Engineers (SPIE). [DOI: 10.1117/1.JBO.17.10.107004]
Keywords: near-infrared Raman spectroscopy; discriminant analysis; Mahalanobis distance; principal components analysis.
Paper 12254P received Apr. 25, 2012; revised manuscript received Sep. 5, 2012; accepted for publication Sep. 11, 2012; published
online Oct. 9, 2012.
1 Introduction Researchers have proposed optical spectroscopic techniques
Rapid identification of infecting microorganisms, such as bac- for rapid and accurate identification of relevant microorganisms
teria and fungi, is a challenging task. The time required for iden- as these require no reagents or dyes, a minimum of sample pre-
tification of infectious microorganisms is an important issue in paration, hence allowing identification using small amounts of
hospitalized patients.1 Although in recent years, techniques have biomass.5–8 These techniques can provide information on the
been developed that allow direct identification of microorgan- biochemical constitution of various complex biological systems,
isms, culturing followed by observations of morphological including bacteria and fungi, enabling the collection of spectral
and biochemical reactions on different substrates is still recog- information even with reduced culture time.9 Among them,
nized as the gold standard for the microorganism identification. Raman spectroscopy has the ability to measure the molecular
The implementation of traditional techniques based on isola- vibrational energies of cellular constituents, such as proteins,
tion and further identification of the most clinically relevant spe- carbohydrates, lipids, and nucleic acids from membrane cell
cies by biochemical tests is usually laborious, requiring a pure wall and components, allowing information on the molecular
microbial culture and, in some cases, takes three to five days structure of cells and thereby discrimination of microbial
as it involves a combination of several methods in order to cor- species.6,7,10–13 It is important to evaluate differences in the spe-
rectly identify the microorganism.2 Sometimes, two or more tests cies influenced by the culture medium, incubation time, and the
are necessary to obtain the correct identification. Such limitations thickness/depth of the colony, since studies have shown that
can impact the patient's clinical diagnosis. In emergency cases, these factors influenced the spectra obtained.14 Given the strong
where action should be taken immediately and before microbial interest in rapid methods for microbiological analysis, Raman
spectroscopy has proved to be an important tool in the study
identification is complete, it is common for empiric administra-
of the structural and chemical characteristics of microorganisms
tion of broad-spectrum antibiotics to occur. As a side effect, this
in order to provide identification in a faster and less expensive
practice may lead to undesired resistance to antimicrobial agents,
manner and even directly on the culture plate.15
often delaying and ultimately disturbing the resolution of the
The objective of this study was to evaluate the ability of
infection.3 Kerremans et al.4 showed that shortening the time
Raman spectroscopy to identify, in vitro, the spectral differences
needed to identify the infectious agent and allowing administra-
of seven clinically relevant species of bacteria commonly found
tion of more specific drugs—would increase the chances of cure
in urinary tract infections, previously identified by conventional
with reduced costs and with lower morbidity and mortality rates.
biochemical methods. To do so, it has been necessary to develop
a classification model to discriminate these species according to
Address all correspondence to: Landulfo Silveira Jr., Universidade Camilo Castelo the spectral differences between them using the multivariate
Branco—UNICASTELO, Biomedical Engineering Institute, Parque Tecnológico de
São José dos Campos, Rod. Pres. Dutra, km 138, São José dos Campos, SP, Brazil
12247-004. Tel: +55(12)3905-4401; E-mail: landulfo.silveira@unicastelo.br 0091-3286/2012/$25.00 © 2012 SPIE
Journal of Biomedical Optics 107004-1 October 2012 • Vol. 17(10)
Downloaded From: https://www.spiedigitallibrary.org/journals/Journal-of-Biomedical-Optics on 02 Jul 2022
Terms of Use: https://www.spiedigitallibrary.org/terms-of-usede Siqueira e Oliveira, Giana, and Silveira: Discrimination of selected species of pathogenic bacteria using near-infrared : : :
statistical method of PCA (Principal Components Analysis) and scattered by the sample was performed by the Raman probe
the (statistical) Mahalanobis distance. coupled to the spectrometer. The acquisition and storage of
spectra is performed by a microcomputer using the software
2 Materials and Methods RamanSoft (Lambda Solutions, Inc., MA) via USB connection,
which controlled the exposure time of the detector and the num-
2.1 Selection of the Culture Media ber of acquisitions per sample and stored the spectra for further
analysis and interpretation.
We conducted a preliminary study to choose the agar that pre-
The exposure time for obtaining the spectra was set to 5 s,
sented the least interference in the spectra of bacteria. Four cul-
and accumulation was set to 10 (total 50 s collecting time).
ture media [MacConkey, Mueller Hinton with 5% sheep blood
All strains were scanned in five replicates (each replicate was
(blood), Mueller Hinton and cysteine lactose electrolyte defi-
considered a sample in the discrimination model), each one
cient (CLED) agars]) were tested and one strain of Escherichia
collected from a random place on the agar surface, allowing eva-
coli was grown on each of these. Following growth, agars and
luation of the reproducibility of the spectra. Two spectra were
colonies were subjected to Raman spectroscopy as follows:
not considered due to CCD saturation. A total of 182 spectra
1. agar without bacteria growth; were obtained from all 38 samples. Spectra were preprocessed
to remove background fluorescence using a 7th order polyno-
2. agar with bacteria growth, but in areas with no mial fitted over the spectral range and subtracted from the
colonies; gross spectrum,16 normalized to the intensity of the Raman
peak at 1453 cm−1 and then averaged and plotted with the
3. samples of colonies of E. coli grown on each medium.
aim of identifying spectral differences between all species
For 1 and 2, one fragment of approximately 2 × 2 mm2 of that could be relevant for identification. Polynomial filtering
each agar was removed and evaluated spectrally. For 3, a small has as an advantage very easy implementation and low spectral
amount of biomass of E. coli grown on each medium was distortion.16,17
collected using a bacteriological inoculating disposable loop
(10 μL capacity) and placed on a piece of reflective aluminum
foil. Also, a spectrum of agar without additives (Biobrás Diag- 2.4 Bacteria Discrimination Using PCA
nósticos, MG, Brazil) was taken for comparison purpose.
In order to develop a classification model to discriminate
between the Raman spectra of the clinical species, according
2.2 Origin and Types of Bacteria Samples to similarity in the relevant spectral characteristics related to
We used 38 clinical strains obtained from urine delivered to the bacteria species, spectra were submitted to PCA. PCA is a sta-
municipal laboratory health service of Jacareí (SP, Brazil) for tistical tool that can be used to analyze data of a multivariate
microbiological analysis. The strains used in this study belong nature, which transforms a set of inter-correlated original vari-
to the Gram-negative species: Escherichia coli (n ¼ 5), Kleb- ables into a new set of uncorrelated variables called principal
siella pneumoniae (n ¼ 7), Enterobacter cloacae (n ¼ 5), component (PCs) spectral vectors. With PCA, it is possible to
Proteus mirabilis (n ¼ 6) and Pseudomonas aeruginosa identify patterns in the dataset and to highlight similarities
(n ¼ 5) and Gram-positive species: Staphylococcus aureus and differences according to similarities and differences in the
(n ¼ 5) and Enterococcus spp. (n ¼ 5). The strains of both samples and group together the variables that are highly corre-
Gram-positive and Gram-negative bacteria were grown and lated. Through linear transformation of the data to a new coor-
stored on Mueller Hinton agar in a refrigerator at 4°C to 8°C, dinate system, the largest variance of all projections will be
except for Enterococcus spp., which was grown in blood positioned as the first coordinate (principal component 1—
agar due to difficulty in growing it on Mueller Hinton agar. PC1), the second largest variance, orthogonal to the first one,
A day before spectral analysis, the strains were inoculated in will be the second coordinate (principal component 2—PC2)
agar plates, incubated at 35 2°C for 16 to 18 h and verified for and so on. Each principal component has a weight score (SC),
signs of contamination. Agar plates were then safely packed in a which is the intensity of each principal component to recover
biohazard box, cooled to 4 to 8ºC with ice and transported the original data.
(about 30 min.) to the Laboratory of Biomolecular Spectroscopy For separation of the bacteria species with similar spectral
(BioSpecLab) at UNICASTELO. At the time of spectral analy- information, the Mahalanobis distance was applied to the SCs
sis, a small volume of the biomass (approx. 10 μL) was carefully that showed higher differences among groups. Mahalanobis
removed from the colonies, with the aid of a disposable loop, distance can be used to separate or discriminate groups accord-
and transferred by touching the loop to the aluminum foil. ing to differences in the selected variables (in our case the SC)
and also to check the consistency in the distribution of the clus-
2.3 Raman Measurements tered points of an experiment. Mahalanobis distance takes into
account the covariance matrix of the dataset instead of only the
Raman spectra were acquired using a dispersive Raman spectro- distance of a point from the centroid of the distribution, allowing
meter (Lambda Solutions, Inc., Massachusetts, model P1) com- examination of an eventual ellipsoid shape of the data cloud.
posed of a diode laser (830 nm) as excitation source, coupled to The PCA was calculated through a routine written under
an optical fiber cable “Raman probe,” an imaging spectrograph MATLAB 6 using all spectra of different strains. The resulting
with diffraction grating of 1200 lines∕mm coupled to a “back variable PC was plotted in Excel in order to identify main peaks
thinned, deep-depleted” CCD camera of 1340 × 100 pixels, related to bacteria type. The bacteria species grouping was done
thermoelectrically cooled to −75°C. Spectrometer resolution by evaluating the binary plot of the first five SC ðSC1 × SC2;
was about 2 cm−1 . The resulting laser output power was about SC1 × SC3; : : : ; SC4 × SC5Þ and calculating the mean
300 mW at the Raman probe. The collection of the light Mahalanobis distance between the groups. The routine for
Journal of Biomedical Optics 107004-2 October 2012 • Vol. 17(10)
Downloaded From: https://www.spiedigitallibrary.org/journals/Journal-of-Biomedical-Optics on 02 Jul 2022
Terms of Use: https://www.spiedigitallibrary.org/terms-of-usede Siqueira e Oliveira, Giana, and Silveira: Discrimination of selected species of pathogenic bacteria using near-infrared : : :
calculating the Mahalanobis distance was adapted from the
original developed by Galhanone (unpublished data).
3 Results and Discussion
3.1 Selection of Culture Medium
Initially, the influence of different culture media (agar) on the
Raman spectra using one specie (E. coli) was verified in order
to determine which medium was most suitable. The spectra of
MacConkey, blood, Mueller Hinton and CLED agars with and
without E. coli growth, as well as a spectrum for pure agar, are
presented in Fig. 1. Also, the spectra of E. coli grown in each Fig. 2 Raman spectra of E. coli grown in four different types of culture
media. The symbol * represents Raman bands of CLED agar that
one of the selected media are presented in Fig. 2. It was found appeared in the bacteria spectrum probably due to medium’s intake
that the Raman spectra of the different agars [Fig. 1(a)] showed by the microorganism. Spectra were displaced for better viewing.
some bands in the same positions as pure agar [Fig. 1(b)] and
other bands in different positions and different intensities. These
differences can be explained by the composition of each med- The spectrum of MacConkey agar [Fig. 1(a)] presented an
ium, since different substances are added to agar with specific intense peak in 1270 cm−1 when compared with the spectra of
objectives, such as to inhibit the growth of some species, reveal agar without additive [Fig. 1(b)], which can be attributed to
the presence of metabolic products, classify bacteria according lactose present in this medium. CLED agar has a different com-
to the growth characteristics, differences in manufacturers and position, with the addition of various substances that can pro-
lots, etc. Table 1 shows the main Raman peaks of the four agar duce colonies colored according to microbial metabolism. This
spectra and the tentative assignment for the most relevant bands pigment fluoresces and may influence the spectral analysis. This
of agar and media. medium has peaks with higher intensity at 890, 1084, and
1469 cm−1 compared to the other media. It also has lactose
in its composition, as implied by the presence of the character-
istic peak at 1270 cm−1 . Mueller Hinton agar is a medium com-
monly employed to perform antibiograms, with basic chemical
constitution and nutrients that do not interfere with the anti-
microbial’s effectiveness, making it an option for use in optical
techniques. This agar presents peaks at 935, 1004, and
1450 cm−1 , which can be assigned to the protein extract.5,14,22
Although there are only small amounts of additives in the
blood agar, hemoglobin can influence the bacterial spectral pat-
tern. The peaks in the region of 1004, 1226, 1450, 1562, and
1624 cm−1 may be attributed to hemoglobin and other blood
proteins.6,7
With bacterial growth [Fig. 1(c)], the MacConkey agar pre-
sented bands of lower intensity in the whole spectral range
because of the strong fluorescence generated by the marker phe-
nol red, indicating fermentation of lactose (producing lactic
acid) and changing the color of the agar. This coloration can
be transmitted to bacterial colonies and can decrease the signal-
to-noise ratio of the Raman spectrum. Blood agar had small fea-
tures from hemoglobin and decreased signal-to-noise ratio. The
CLED agar had spectral features in the 700 to 1000 cm−1
region, with intense peaks in the same positions as the pure
agar and bands of lower peak intensity (around 1460 m cm−1 )
that may be attributed to changes in the polarizability of the agar
molecule induced by changes in the pH.
The spectra of E. coli after growth in each one of the culture
medium (Fig. 2) presented features depending on the medium
used. As observed in the spectrum of the medium after culture,
the spectrum of E. coli grown in MacConkey presented a few
spectral features with a very low signal-to-noise ratio due to the
strong fluorescence background, which decreases the Raman
Fig. 1 Normalized Raman spectra of fragments of the four types of agar: signal quality. The spectra of E. coli grown in blood and Mueller
(a) without bacterial growth; (b) reference spectrum of agar without Hinton agars presented similar spectral features, since these
additives, (c) with E. coli growth. The symbol ° represents different
media presented similar constitution. A small feature can be
peaks in each of the agars and are suggestive of differences in the com-
position of the culture media and the symbol * represents Raman bands seen at 1611 cm−1 . The E. coli grown in CLED presented strong
suggestive of products of bacterial metabolism. Spectra were displaced peaks at 886, 1480, and 1620 cm−1 , which are the same features
for better viewing. appearing in the spectrum of CLED agar. This reflects the
Journal of Biomedical Optics 107004-3 October 2012 • Vol. 17(10)
Downloaded From: https://www.spiedigitallibrary.org/journals/Journal-of-Biomedical-Optics on 02 Jul 2022
Terms of Use: https://www.spiedigitallibrary.org/terms-of-usede Siqueira e Oliveira, Giana, and Silveira: Discrimination of selected species of pathogenic bacteria using near-infrared : : :
Table 1 Peak positions and tentative attributions for Raman spectra of culture media and bacteria used in the study based on recent
literature.5,8,14,16,17,18,19,20,21
Raman shift (cm−1 ) Attribution Origin
538 COC glycosidic ring deformation Bacteria
545 CCC deformation Agar
624 CC twisting—tryptophan Bacteria
645 Tyrosine Bacteria
672 Valine Bacteria
721 Agar Agar
726 Adenine ring stretching; peptidoglycan Bacteria
742 CC skeletal deformation—galactose ring Agar
759 Tryptophan Bacteria
774 CC skeletal deformation—galactose ring Agar
784 Cytosine, uracil (ring stretching) Bacteria
814 C–O–P–O–C—RNA binding Bacteria
829 Tyrosine Bacteria
846 CC deformation/OCO wagging/CH vibrations with C–OH Agar
857 C–O–C stretching of glycosidic linkage (saccharides); C–C proline stretching and CCH deformation ring Bacteria
breathing of tyrosine (protein); teicuronic acid of Gram positives cell wall
890 CCH deformation Agar
907 C–O–C stretching of glycosidic linkage (saccharides); teicuronic acid of Gram positives cell wall Bacteria
b
930 Saccharides Agar
935 C–C skeletal stretching—protein Culture media
938 C–C stretching (amide III)—protein Bacteria
966 CCH deformation Agar
951 Phenylalanine, proline Agar
a
1004 C–C skeletal stretching of aromatic ring phenylalanine—protein Agar
1007 C–C skeletal stretching of aromatic ring—phenylalanine/tyrosine Bacteria
1020b Bacteria metabolism (?) Culture media
1049 C–O exocyclic stretching Agar
1030–1130 Carbohydrates, mainly C–C, C–O, C–O–H stretching Bacteria
1033 C–H in-plane deformation—phenylalanine/proline (proteins); C–O and C–C stretching—saccharides Bacteria
1084 COH deformation/CCO stretching Agar
1099 Nucleic acids (PO2 − symmetrical stretching); C–C and C–O–C skeletal stretching—glycosidic linkage of Bacteria
saccharides
1130 C–C skeletal stretching acyl (trans conformation) of lipids; C–O and C–C—saccharides stretching Bacteria
1132 COH sugar deformation Agar
1155 COH deformation Agar
Journal of Biomedical Optics 107004-4 October 2012 • Vol. 17(10)
Downloaded From: https://www.spiedigitallibrary.org/journals/Journal-of-Biomedical-Optics on 02 Jul 2022
Terms of Use: https://www.spiedigitallibrary.org/terms-of-usede Siqueira e Oliveira, Giana, and Silveira: Discrimination of selected species of pathogenic bacteria using near-infrared : : :
Table 1 (Continued).
Raman shift (cm−1 ) Attribution Origin
1156 C–C and C–N—protein stretching; C–O and C–C—saccharides Bacteria
1162 –C–C– conjugated stretching—carotenoids Bacteria
1173 C–H wagging of tyrosine; guanine and cytosine; fatty acids (stearic acids) Bacteria
1211 Amide III; C–C tyrosine stretching, phenylalanine, tryptophan (protein) Bacteria
1226a C–H stretching—hemoglobin Agar
1261 C–N e N–H stretching (amide III); thymine and adenine (ring breathing); CH2 lipids deformation; saccharides Bacteria
1270a Lactose Agar
1285 CH2 twisting Agar
1293 CH2 fatty acids deformation; cytosine Bacteria
1320 C–N and N–H stretching (amide III); CH2 and CH3 —protein deformation; guanine breathing ring Bacteria
1340 CH2 and CH3 —fatty acids and protein deformation; N–H stretching (amide III); C–C stretching—tryptophan; Bacteria
adenine, guanine (ring breathing)
1350 CH2 wagging Agar
1382 –COO− symmetric and asymmetric stretching—peptidoglycan Bacteria
1413 CH deformation Agar
1421 Adenine, guanine, –C–O vibration modes—peptidoglycan Bacteria
1450a CH2 ∕CH3 deformation—proteins Agar
1453 CH2 and CH3 deformations—lipids and proteins Bacteria
1469 CH2 deformation Agar
1525 –C–C conjugated stretching—carotenoids Bacteria
1557 Tryptophan; exopolysaccharides Bacteria
1562a CH2 stretching—hemoglobin Agar
1578 Adenine, guanine (ring stretching); –C–O vibration modes—peptidoglycan Bacteria
1611 C–C ring stretching—phenylalanine, tyrosine and tryptophan Bacteria
1624a C–C asymmetric stretching—hemoglobin Agar
1644 C–O stretching (amide I)—protein, O–H wagging (water) Agar
1660 C–O stretching (amide I); C–C stretching—lipids Bacteria
a
Peaks related to the differences in the composition of the culture media.
b
Peaks that appeared in the culture media after bacteria growth.
interference of the medium’s composition in the bacteria spec- different bacteria species (Fig. 3). These Raman spectra
trum; this might reflect the agar intake by the microorganism. showed peaks at positions characteristic of the bacteria’s bio-
Mueller Hinton agar, which consists of basic nutrients and no chemical constitution, with peak assignments of these bands
additives that could significantly influence the spectral pattern, shown in Table 1. By analyzing Fig. 3, it can be seen that
proved to be the best option for use in Raman spectroscopy. This there is similarity between the spectra of different species,
agar has been used in several studies,14,22 almost certainly due to represented by the peaks in the same positions and same inten-
this characteristic. sity of all bacteria analyzed, namely: 538, 624, 645, 726, 784,
814, 829, 857, 907, 938, 1007, 1033, 1099, 1130, 1211, 1261,
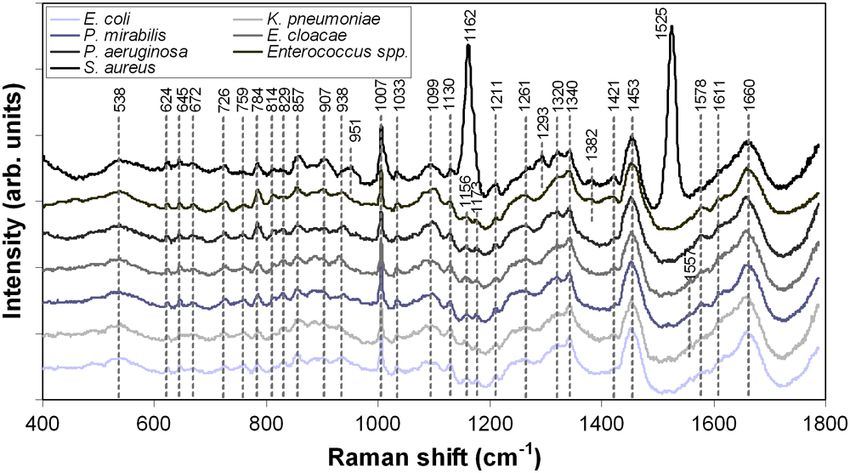
3.2 Spectra of Bacteria 1320, 1340, 1421, 1453, 1578, 1611, and 1660 cm−1 . This
reflects a general similarity in the biochemical composition
In order to develop an optical technique for bacteria identifica- of all species, in agreement with the results observed in
tion, we obtained the spectra of clinical strains of seven other studies.12
Journal of Biomedical Optics 107004-5 October 2012 • Vol. 17(10)
Downloaded From: https://www.spiedigitallibrary.org/journals/Journal-of-Biomedical-Optics on 02 Jul 2022
Terms of Use: https://www.spiedigitallibrary.org/terms-of-usede Siqueira e Oliveira, Giana, and Silveira: Discrimination of selected species of pathogenic bacteria using near-infrared : : :
Fig. 3 Mean spectra of all bacteria (Gram-positive and Gram-negative)
used in the discrimination model.
It was observed that the peak at 1382 cm−1 appears only in
Gram-positive strains (S. aureus and Enterococcus spp.), while
the peaks at 726, 857, 907, 1340, and 1421 cm−1 are present in
both groups but with increased intensity in Gram-positive spe-
cies, which could indicate a higher concentration of the cell wall
constituents peptidoglycan and teichoic or teichuronic acids,18,23
being thicker in Gram-positive species23 as described in a study
developed by Jarvis et al.,12 who presented the peak at
1340 cm−1 as being important in distinguishing between the
species (Gram-positive and Gram-negative). S. aureus shows Fig. 4 PCA scores for bacteria discrimination: a) SC2 × SC3 for
very characteristic peaks at 951, 1162, 1293, and 1525 cm−1 , discriminating Gram-positive and b) SC4 × SC5 for discriminating
which can be attributed to pigments of the carotenoid family, Gram-negative.
characteristic of this type of microorganism.19,24 The species
Enterococcus spp., P. aeruginosa, and S. aureus showed a
slightly more intense peak at 784 cm−1 when compared to of the spectral variations between groups and show the highest
other species. The species Enterococcus spp. and S. aureus relevance to bacterial discrimination. In both cases, groups were
showed a peak at 1007 cm−1 of higher intensity when compared separated by the average Mahalanobis distance between specie.
to other species. The peak at 759 cm−1 had reduced intensity in The score SC2 × SC3 was able to discriminate Gram-negative
S. aureus and Enterococcus spp. The peak at 1578 cm−1 from Gram-positive bacteria, including the species. The score
appeared more intense in Enterococcus spp., P. aeruginosa, SC4 × SC5 was able to discriminate Gram-negative bacteria.
and P. mirabilis. The species of E. cloacae and K. pneumoniae In terms of spectral information, the principal components
showed a peak at 1557 cm−1 of higher intensity. The peak at PC2 and PC3 vectors (not shown) have spectral features related
1130 cm−1 appeared more intense in E. coli and P. mirabilis to Raman peaks of carotenoids, which can be used to separate S.
compared to the other species. The differences in peak intensi- aureus from other micro-organisms. Gram-negative bacteria
ties are related to differences in the biochemical constitution of were classified using SC4 and SC5. The PC4 and PC5 vectors
bacteria and are in accordance with recent literature.6,12,14,24,25 (not shown) presented Raman peaks at around 900, 1000, 1100,
1200, 1300, 1400, 1470, 1530, and 1600 cm−1 , and the discri-
3.3 Bacteria Discrimination Using PCA mination can be related to differences in the biochemical
constitution of cell walls (peptidoglycan and teichoic or tei-
In order to develop a routine for classification of bacterial spe- churonic acids) and other cell structure constituents of E. coli,
cies due to Raman spectral characteristics (inter-group differ- K. pneumoniae, P. mirabilis, E. cloacae, and P. aeruginosa,
ences and intra-group similarities), all spectra were submitted which enabled differentiation of bacteria species through Raman
to PCA. Following PCA, group discrimination by means of spectroscopy.
Mahalanobis distance, related to the bacteria species, was Table 2 lists the rate of successful classification of clinical
applied to the principal component scores (SCs). To do so, strains through PCA and Mahalanobis distance analyses. The
all the normalized spectra were submitted to PCA calculation. percentage of correct discrimination of Gram-positive bacteria,
The output variables (PC, SC and latent variable—LV) were or the sensitivity, was 100%, including the differentiation of
then used to correlate the spectral differences with the bacterial species. The percentage of true negative, or the specificity,
species. The LV of the dataset indicated that principal compo- was also 100%, including the differentiation of species. The
nents PC1 to PC5 are responsible for 98.8% of all spectral sensitivity values for the discrimination of Gram-negative bac-
variations (PC1 ¼ 90.3%; PC2 ¼ 5.0%; PC3 ¼ 2.3%; PC4 ¼ teria was 64.0% for E. coli, 58.3% for E. cloacae, 88.5% for
0.9%; PC5 ¼ 0.3%); these PCs were then used in the discrimi- K. pneumoniae, 87.1% for P. mirabilis, and 85.0% for
nation model. The scores of principal components PC1 to PC5 P. aeruginosa. The specificity values for each species were
(SC1 to SC5) were binary plotted in combination to determine 95.4%, 98.1%, 93.0%, 99.0%, and 87.0%, respectively. The
which SC would provide the best discrimination. overall accuracy of the discrimination model was 83%.
Figure 4 presents binary plots of the principal components The high specificity of the discrimination model is a positive
SC2 × SC3 and SC4 × SC5, which were found to carry most factor for the practical application of bacterial identification
Journal of Biomedical Optics 107004-6 October 2012 • Vol. 17(10)
Downloaded From: https://www.spiedigitallibrary.org/journals/Journal-of-Biomedical-Optics on 02 Jul 2022
Terms of Use: https://www.spiedigitallibrary.org/terms-of-usede Siqueira e Oliveira, Giana, and Silveira: Discrimination of selected species of pathogenic bacteria using near-infrared : : :
Table 2 Results of classification of the Raman spectra of clinical strains of bacteria using PCA/Mahalanobis distance
PCA/Mahalanobis identification
Gram-positives Gram-negatives
Biochemical identification
(gold-standard) S. aureus Enter. spp. E. coli E. cloacae K. pneum. P. mirab. P. aerug.
S. aureus (22) 22 0 0 0 0 0 0
Enteroccus spp. (25) 0 25 0 0 0 0 0
E. coli (25) 0 0 16 0 0 1 8
E. cloacae (24) 0 0 1 14 6 0 3
K. pneumoniae (35) 0 0 0 2 31 0 2
P. mirabilis (31) 0 0 2 0 0 27 2
P. aeruginosa (20) 0 0 2 0 1 0 17
Sensitivity 100% 100% 64% 58% 88% 87% 85%
Specificity 100% 100% 95% 98% 93% 99% 87%
through Raman spectroscopy. For a disease of infectious origin, Raman spectroscopy directly in the bacteria colony, grouping
the correct identification of the microbial agent is important, these strains according to spectral differences using PCA. Stu-
but the correct exclusion of a microorganism from being dies are under way to increase the number of strains to the 15
involved in the process is essential for an appropriate therapeutic most common found in the urinary tract, together with an auto-
approach, avoiding administration of antimicrobials to patients mated spectral collection and processing, being closer to the
without such infectious agents. clinical setup.
In this study, we found that the bacteria’s spectrum can Advantages of the Raman technique include there being no
be influenced by the medium used in the culture. E. coli spectra need for further sample preparation, that results can be obtained
presented different features depending on the medium that rapidly through Raman probes with small amounts of biomass,
could be important in the PCA discrimination algorithm, and the reproducibility. These characteristics are important
leading to errors in grouping the bacterium genus if its for an early identification of clinical strains, allowing a most
influence is not considered (mainly when using CLED, with appropriate treatment for the patient and reducing the occur-
strong peaks at 886, 1480, and 1620 cm−1 ). To minimize rence of bacterial resistance due to inaccurate empirical therapy,
the impact of such differences, a standardization of the medium usually employed due to the delay in identification of microor-
used in each microorganism is needed, so that the PCA ganisms by classical microbiological techniques. This
algorithm could handle with these medium-related Raman would reduce the morbidity and mortality related to serious
bands. infections. Thus, Raman spectroscopy could be a promising
A previous study done by Giana et al.26 showed that three technique as a rapid method for bacterial species identification
pathogenic bacteria strains (E. coli, E. faecalis, and S. aureus) in microbiology.
could be selectively discriminated though an algorithm based on
PCA and Euclidean distance applied to fluorescence spectra 4 Conclusion
using selected excitation wavelength in the visible region. Buij- Raman spectroscopy was able to identify spectral differences
tels et al.27 evaluated differences in the Raman spectra of species related to the biochemical content of seven different clinical spe-
of Mycobacterium tuberculosis and nontuberculous mycobac- cies of bacteria involved in urinary tract infections (S. aureus,
teria using hierarchical cluster analysis (HCA) for identification Enterococcus spp., E. coli, K. pneumoniae, E. cloacae, P.
purposes, reaching sensitivity of 95%. Maquelin et al.28 mirabilis, and P. aeruginosa), which were grown on Mueller
employed Raman spectroscopy and HCA for typing different Hinton and blood agars. A discriminant model based on
species of Acinetobacter, concluding that the grouping by PCA and Mahalanobis distance applied to Raman spectra
Raman/HCA is correlated to the results found using molecular collected in vitro was able to group those samples with good
biology techniques. Kirschner et al.11 discriminated enterococci sensitivity and high specificity, as well as separate two Gram-
at the species level by using vibrational techniques correlated to positive species according to differences in the cell wall
the molecular biology techniques: the results of phenotypic components (Enterococcus spp.) and presence of carotenoids
method were correlated to the Fourier-Transform Infrared (S. aureus), with 100% sensitivity and specificity. The Raman
(FT-IR) spectroscopy with discrepancies for certain strains; gen- spectral information proved to be reproducible using a small
otypic methods confirmed the results obtained by FT-IR. In this amount of biomass, demonstrating it to be a fast, low cost,
work, we showed that it is possible to increase the number of and easily implemented technique for an early identification
strains from three to seven and use the vibrational technique of pathogenic microorganisms.
Journal of Biomedical Optics 107004-7 October 2012 • Vol. 17(10)
Downloaded From: https://www.spiedigitallibrary.org/journals/Journal-of-Biomedical-Optics on 02 Jul 2022
Terms of Use: https://www.spiedigitallibrary.org/terms-of-usede Siqueira e Oliveira, Giana, and Silveira: Discrimination of selected species of pathogenic bacteria using near-infrared : : :
Acknowledgments 13. R. M. Jarvis and R. Goodacre, “Characterization and identification of
bacteria using SERS,” Chem. Soc. Rev. 37(5), 931–936 (2008).
L. Silveira Jr. gratefully acknowledges FAPESP (São Paulo 14. G. J. Puppels et al., “Raman spectroscopic method for identification of
Research Foundation) (Proc. No. 2009/01788-5) for their partial clinically relevant microorganisms growing on solid culture medium,”
financial support. Anal. Chem. 72(1), 12–19 (2000).
15. W. E. Huang et al., “Raman microscopic analysis of single microbial
cells,” Anal. Chem. 76(15), 4452–4458 (2004).
References 16. L. Silveira et al., “Discrete wavelet transform for denoising Raman spec-
tra of human skin tissues used in a discriminant diagnostic algorithm,”
1. E. H. Ibrahim et al., “The influence of inadequate antimicrobial treat- Instrum. Sci. Technol. 38(4), 268–282 (2010).
ment of bloodstream infections on patient outcomes in the ICU setting,” 17. C. A. Lieber and A. Mahadevan-Jansen, “Automated method for
Chest 118(1), 146–155 (2000). subtraction of fluorescence from biological Raman spectra,” Appl.
2. H. K. Walker, W. D. Hall, and J. W. Hurst, Clinical Methods: The Spectrosc. 57(11), 1363–1367 (2003).
History, Physical, and Laboratory Examinations, pp. 999–1004, 18. J. R. Goodwin, “Vibrational Microspectroscopy of Bacterial Colonies,”
Butterworths, Boston (1990). (MS Thesis), pp. 36–46 School of Chemical and Physical Sciences at
3. D. I. Andersson and D. Hughes, “Antibiotic resistance and its cost: is it Queensland University of Technology, Brisbane (2006).
possible to reverse resistance?,” Nat. Rev. Microbiol. 8(4), 260–271 19. J. Popp et al., “Micro-Raman spectroscopic identification of bacterial
(2010).
cells of genus Staphylococcus and dependence on their cultivation
4. J. J. Kerremans et al., “Rapid identification and antimicrobial sus-
conditions,” Analyst 130(11), 1543–1550 (2005).
ceptibility testing reduce antibiotic use and accelerate pathogen-
20. Z. Movasaghi, S. Rehman, and I. U. Rehman, “Raman spectroscopy
directed antibiotic use,” J. Antimicrob. Chemother. 61(2), 428–435
of biological tissues,” Appl. Spectrosc. Rev. 42(5), 493–541 (2007).
(2008).
21. J. Popp et al., “The influence of intracellular storage material on bacter-
5. K. Maquelin et al., “Identification of medically relevant microorgan-
ial identification by means of Raman spectroscopy,” Anal. Bioanal.
isms by vibrational spectroscopy,” J. Microbiol. Meth. 51(3), 255–271
Chem. 397(7), 2929–2937 (2010).
(2002).
22. D. Naumann et al., “Infrared spectroscopy, a tool for probing bacterial
6. K. Maquelin et al., “Prospective study of the performance of vibrational
Peptidoglycan. Potentialities of infrared spectroscopy for cell wall
spectroscopies for rapid identification of bacterial and fungal pathogens
analytical studies and rejection of models based on crystalline chitin,”
recovered from blood cultures,” J. Clin. Microbiol. 41(1), 324–329
Eur. J. Biochem. 125(3), 505–515 (1982).
(2003).
23. K. Maquelin et al., “Raman spectroscopic typing reveals the presence of
7. L. P. Choo-Smith et al., “Investigating microbial (micro)colony hetero-
carotenoids in Mycoplasma pneumonia,” Microbiol. 155(6), 2068–2077
geneity by vibrational spectroscopy,” Appl. Environ. Microbiol. 67(4),
(2009).
1461–1469 (2001).
24. S. Efrima et al., “Surface-enhanced Raman spectroscopy as a tool for
8. W. E. Huang et al., “Single-cell Raman spectral profiles of Pseudomo-
probing specific biochemical components in bacteria,” Appl. Spectrosc.
nas fluorescens SBW25 reflects in vitro and in planta metabolic history,”
58(1), 33–40 (2004).
Microb. Ecol. 53(3), 414–425 (2007).
9. W. H. Nelson, R. Manoharan, and J. F. Sperry, “UV resonance Raman 25. M. L. Paret et al., “Biochemical characterization of Gram-positive and
studies of bacteria,” Appl. Spectrosc. 27(1), 67–124 (1992). Gram-negative plant-associated bacteria with micro-Raman spectros-
10. D. Naumann et al., “FT-IR spectroscopy and FT-Raman are powerful copy,” Appl. Spectrosc. 64(4), 433–441 (2010).
analytical tools for the non-invasive characterization of intact microbial 26. H. E. Giana et al., “ Rapid identification of bacterial species by fluo-
cells,” J. Mol. Struct. 347, 399–405 (1995). rescence spectroscopy and classification through principal components
11. C. Kirschner et al., “Classification and identification of Enterococci: a analysis,” J. Fluoresc. 13 (6), 489–493 (2003).
comparative phenotypic, genotypic, and vibrational spectroscopic 27. P. C. Buijtels et al., “ Rapid identification of mycobacteria by Raman
study,” J. Clin. Microbiol. 39(5), 1763–1770 (2001). spectroscopy,” J. Clin. Microbiol. 46(3), 961–965 (2008).
12. R. M. Jarvis and R. Goodacre, “Discrimination of bacteria using 28. K. Maquelin et al., “Rapid epidemiological analysis of Acinetobacter
surface-enhanced Raman spectroscopy,” Anal. Chem. 76(1), 40–47 strains by Raman spectroscopy,” J. Microbiol. Meth. 64(1), 126–131
(2004). (2006).
Journal of Biomedical Optics 107004-8 October 2012 • Vol. 17(10)
Downloaded From: https://www.spiedigitallibrary.org/journals/Journal-of-Biomedical-Optics on 02 Jul 2022
Terms of Use: https://www.spiedigitallibrary.org/terms-of-useYou can also read