Digital Assets in A Post-Cycle World - 2022 Outlook - Sean FarrellAC - FSInsight
←
→
Page content transcription
If your browser does not render page correctly, please read the page content below
2022 Outlook

Digital Assets in A
Post-Cycle World
Sean FarrellAC
Head of Digital Asset Strategy
Twitter: @Seanmfarrell

                                 1
Table of       1   Introduction

               2   Bitcoin
Contents
               3   Ethereum

               4   Crypto Thesis Update

               5   Crypto Equities

           2
Things to Keep in Mind
• Bitcoin is still King

• Ethereum is different than Bitcoin

• The rest is venture capital (or call options)

• Demand matters now

• Flows > Fundamentals

• You will not time the market correctly

• Info Asymmetry = Advantage

• Every dip looks like a buying opportunity in hindsight

                                                  3
2021 Performance Recap
                                                                      Chart 2021 Performance
   7.0

              Asset/Index                     % Return

   6.0        Global Crypto Market Cap              188%
              Ethereum                              398%
              Bitcoin                               59%
   5.0
              Nasdaq 100                            27%
              S&P 500                               29%
   4.0

   3.0

   2.0

   1.0

   0.0
    Dec '20           Jan '21   Feb '21   Mar '21      Apr '21    May '21      Jun '21         Jul '21        Aug '21    Sep '21   Oct '21   Nov '21   Dec '21
                                           Global Crypto Market Cap       Ethereum       Bitcoin         Nasdaq 100     S&P 500

Source: TradingView
                                                                                     4
Survey Results Show Importance of Demographics
                           What is your primary reason for investing in Bitcoin?                                          Are you happy with the crypto investment options at your current
                            (Of respondents with >0% allocation to crypto)                                                                     brokerage account?

                                                                   A hedge against inflation
                                        11%
                                16%                                A lack of correlation to other asset                                     23%
                                                10%
                                                                   classes                                                                                                      No
                                                     8%            Distrust in the current financial system                                                                     Not Applicable
                                                                                                                                                          55%
                                                                                                                                                                                Yes
                               55%
                                                                   High-growth technology investment                                        21%
Still a Risk
Asset for most                                                     Price seems to go up a lot

                     Out of the Following Entities, which do you trust the most?                                             Average of “How likely are you to increase your allocation to
                                                                                                                             crypto over the next 12 months?” (Segmented by Age Group)
            53%                                                                                                                           (0 = Very Unlikely, 10 = Very Likely)                        Demographics
                                                                                                                    6.5                                                                                are destiny
                  41%                                                                                                              5.9            6.1
                                                                              39%                                                                                                                5.7
                                                                        35%                                                                                5.4
                        31%                                                                                                                                           4.8
                                                                                                  29%
                                                                  24%                                                                                                              3.9
                                                                                        21% 20%

                                      2%   4%
                                                 2%

                 Bitcoin              Facebook (Meta)             Goldman Sachs         US Government
                                                > 44      45-54     55+                                           25 to 34       35 to 44     45 to 54   55 to 64   65 to 74   75 or older   Overall

       Source: FSI Digital Assets Quarterly Survey
                                                                                                              5
2022 is much different than 2018
• Correlation to macro factors is much more pronounced. Bitcoin and broader crypto market now correlate strongly with tech
  stocks due to legacy market capital entering the fold.
• In 2017, traditional hedge funds, banks, and wealth managers did not have capital tied up in crypto. Therefore, the
  drawdown was mainly due to decreased sentiment among crypto-natives and, quite frankly, a general lack of good
  projects to trust with your capital.

Source: FS Insight, TradingView
                                                             6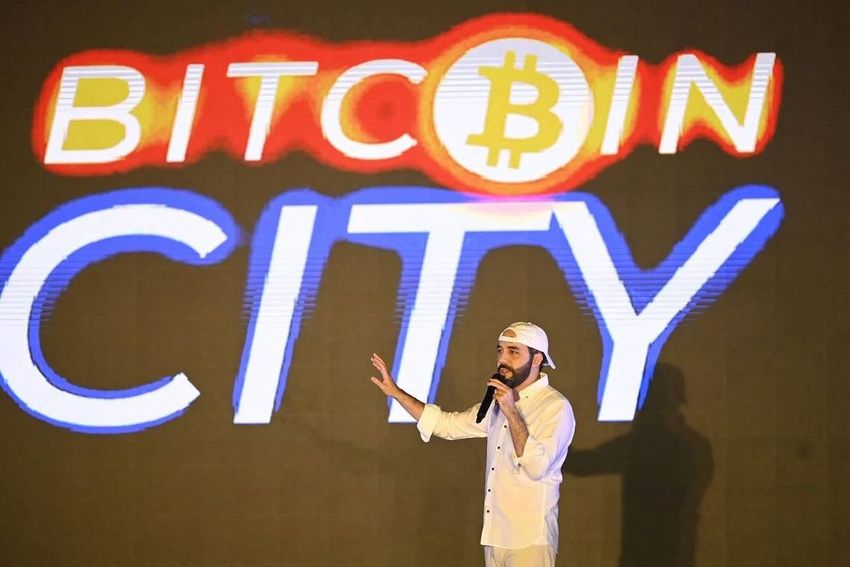
2022 is much different than 2018
• BTC is demonstrating a strong inverse correlation to the US 10Y
• Despite the slew of reasons to be constructive on the industry, the fear & greed index is in “extreme fear” territory.

Source: FS Insight, TradingView, Alternative.me
                                                               7
2022 is much different than 2018
• Crypto mining was banned from Mainland China in June, only to recover and reach an ATH less than 7 months later.
• This eliminated a major perceived risk to the network, put the United States at the forefront of the mining industry, and
  augmented the geopolitical relevance of Bitcoin.
• Plurality of hash rate in an environmentally greener state with comparatively open capital markets

                                          China bans
                                          BTC mining

                                                       Hash Rate ATH
2022 is much different than 2018
• A deluge of long-term oriented capital entered the market in 2021, as VCs rushed to fund projects across DeFi, Web3,
  NFTs, Infrastructure, and centralized finance (the onramps)

                            Crypto VC Funding ($billions)                                2021 VC Deal Breakdown

                                                            $30.2                                      6%

                                                                                                                    19%

                                                                                 52%

                                                                                                                   23%

              $2.9                            $3.1

              2019                            2020          2021                  DeFi     Web3/NFTs   Infrastructure    CeFi

Source: FS Insight, Google, Dove Metrics, The Block
                                                                    9
2022 is much different than 2018
• As previously noted, the industry has experienced massive growth. The emergence of an application layer generating
  economic activity for token holders is one of the starkest differences between now and the end of the prior halvening cycle.

                            Worldwide Google Trends                                              Top dApps by Revenue ($billions)
100
                                                                                         $1.80
 90
                                                                                         $1.60
 80
                                                                                         $1.40
 70
                                                                                         $1.20
 60
                                                                                         $1.00
 50
                                                                                         $0.80
 40
                                                                                         $0.60
 30
                                                                                         $0.40
 20
                                                                                         $0.20
 10
                                                                                         $0.00
  0
  Jan '21              Apr '21                 Jul '21             Oct '21

                         Web3        Bitcoin        NFT      Ethereum

Source: TokenTerminal, Google, dApp Revenue is for the 365 days through 1/31/2022
                                                                                    10
The Playing Field Looks Much Different Now
• Corporates, traders, funds, and countries embraced Digital Gold on a global scale
• El Salvador was the first – what happens if more join?
Genesis Q4 2021 Quarterly Report
$140
2020 2021
$120
$100
$80
$60
$40
$20
$0
Loan Originations Total Active Loans Spot Volume Derivatives Notional
Traded Value Traded
Source: Glassnode, Cambridge University
11In Summary:
N’T Coming
12Table of 1 Introduction
2 Bitcoin
Contents
3 Ethereum
4 Crypto Thesis Update
5 Crypto Equities
13What happened to $100k?
• Institutional adoption is a double-edged sword. Despite bullish underlying supply trends, BTC became heavily correlated
with equities toward the end of Q4 2021, and consequently sold-off in the face of Fed tightening.
• Using realized cap as a proxy for inflows, we can see that demand vanished in late November.
Source: Glassnode, TradingView
14Cycle Comparison • While price rebounded in 2021, we never achieved what many would consider an overly frothy valuation. • Price relative to security spend (P/B) peaked well short of the high reached in the prior two cycles • Interestingly, thus far the median P/B is much higher than the prior two halvening cycles – a sign of maturation? Source: FS Insight, Glassnode 15
Cycle Comparison
        • BTC valuation multiples were much “flatter” compared to prior halvening cycles, pointing toward more efficient price
          discovery and perhaps signaling the transition from payment network to store-of-value.
        • Are we are moving to a post-cycle world? We think so.

                2012 vs 2020 Halvening - Market Cap / Realized Value

7.0x
                             5.9x                      6.4x

6.0x

                                       3.7x                                  2012
5.0x
                                                                             2020

4.0x
                                                              2.7x

3.0x

2.0x

1.0x

0.0x
       1           101           201          301    401         501   601     701

                                       Days Post Halvening

       Source: FS Insight, Glassnode                                                 16
Incredibly Bullish Supply-Side Dynamics
• An often-overlooked element of investing in BTC is the variable liquidity of the market as some wallets are less likely to
liquidate holdings compared to others.
• Illiquid entities(1) briefly sold-off in early 2021 but have since accumulated steadily – now comprise >75% of circulating
supply.
• The current supply dynamics can best be described as a powder keg. The question remains who lights the match.
Illiquid entities
BTC to non- accumulating
custodial wallets
Source: FS Insight, Glassnode
17Demand Matters (“the match”)
• The supply shocks of a halvening event used to be the major driver of inflows. Given widespread adoption of crypto -
macro, geopolitical, and industry-specific factors must be considered.
Source: FS Insight, Glassnode
18Bull Markets Determined by Inflows Not Cycles
• Viewing bull and bear markets through the lens of cycles is limiting.
• We think a better way to delineate between bull and bear markets in a post-cycle world is inflows, best estimated by
realized cap.
Source: FS Insight, Glassnode
19Regardless of Path Forward, BTC on Sale
• Market-value-to-realized-value (MVRV) measures the profitability of coins presently held across the entire network.
Naturally, the higher that this metric rises, the “frothier” the market price for bitcoin is, and the more selling pressure there
will be from holders.
• Notably, this metric is now at a level last witnessed in April 2020, when the price was still well below $10,000. This speaks
to the amount of capital invested into the network since that time as the cost-basis has increased significantly.
Source: FS Insight, Glassnode
20Our Forecast = Choppy 1H, BTC to $200k in 2H
• If inflows move us higher, what historical data can we observe to estimate what the next wave of demand will bring?
• We observe a strong relationship between “days between ATH’s” and the relative increase in realized cap between said
ATH’s.
• Starting with the assumption that BTC benefits from macro tailwinds in 2H, we can use this relationship to estimate what
increased demand in 2H 22 would bring to the asset and measure the reasonableness of this calculation against the
comparable TAMs highlighted on slide 36.
Source: FS Insight, Glassnode
21Our Forecast = Choppy 1H, BTC to $200k in 2H
• We applied an MVRV ratio of 3.2x, which is the historical median for Bitcoin when an ATH is reached, to the projected
realized cap.
• We sensitized the model to reach range of $138k to $222k.
Metric 2011 2012 2013 2014 2015 2016 2017 2018 2019 2020 2021 2022
Price ($) 5 14 730 321 430 969 13,921 3,687 7,167 29,023 46,355 199,924
% Growth NA 187% 5286% -56% 34% 126% 1337% -74% 94% 305% 60% 331%
Supply (Millions) 8 11 12 14 15 16 17 17 18 19 19 19
Market Cap ($Millions) 38 144 8,901 4,384 6,458 15,577 233,524 64,362 129,970 539,438 876,857 3,846,412
% Growth NA 281% 6091% -51% 47% 141% 1399% -72% 102% 315% 63% 339%
Realized Cap ($Millions) 39 80 3,279 4,380 4,529 6,940 83,783 79,251 101,001 171,741 463,116 1,198,092
% Growth NA 103% 4015% 34% 3% 53% 1107% -5% 27% 70% 170% 159%
Incremental Value Stored ($Millions) NA 40 3,200 1,101 149 2,411 76,842 (4,532) 21,750 70,740 291,374 734,977
% Growth NA NA 7813% -66% -86% 1520% 3087% -106% -580% 225% 312% 152%
Market Cap/Realized Cap 1.0x 1.8x 2.7x 1.0x 1.4x 2.2x 2.8x 0.8x 1.3x 3.1x 1.9x 3.2x
Market Cap to Realized Cap / Proj. Realized Cap Increase (%)
199,924 3.0x 3.1x 3.2x 3.3x 3.4x
90% 138,064 142,666 147,749 151,870 156,472
110% 152,597 157,683 163,301 167,856 172,943
157% 186,819 193,046 199,924 205,501 211,728
150% 181,663 187,718 194,406 199,829 205,884
170% 196,196 202,735 209,958 215,815 222,355
Source: FS Insight, Coin Metrics
22How does this play out?
1. Market continues experience volatility through the first rate
increase
2. The liquidity of bitcoin’s supply will continue to decrease as coins
shift to LTH
3. Fed liftoff after “extreme fear” already priced in (TINA?)
4. Several potential catalysts on the horizon
23What Are Potential Catalysts?
1. TINA-driven investment (most probable “match”)
2. Top-down emerging market adoption (see: Central America)
3. Bottoms-up emerging market adoption (see: Turkey)
We think that there is a
strong case to be made
4. Spot ETF Approval that outsized inflation
and geopolitical
instability might push
developing countries with
volatile currencies to
follow in El Salvador’s
footsteps. While unlikely,
this catalyst is the most
underpriced.
24Following the “Smart Money” On Chain
• Throughout our research we have highlighted the signal derived from longer-term oriented wallets that are accustomed to
accumulating during consolidation periods and selling into bull markets
• Despite price >$35,000, LTH supply is at an all-time high and these wallets appear to be accumulating more BTC
30-Day Long-term Holder BTC Net Position Change
LTH Sell into frothier
markets
LTH recently
started
accumulating
Jun '20 Sep '20 Dec '20 Mar '21 Jun '21 Sep '21 Dec '21
Increase Decrease Price (USD)
Source: FS Insight, Glassnode
25….But Never to 0% Allocation
• Sitting on the sidelines can be costly. If you missed the 10 best trading days of the past 10 years, your annualized returns
would have shrunk from 147.1% to 90.9%.
• The results are even more pronounced when applying the “best trading days” exercise to last year. Missing the best 4
trading days would leave you with negative returns.
Bitcoin Returns - 2021
Bitcoin Returns
147.1%
2013 Through 2021
59.7%
90.9%
61.3%
-1.8%
-10.9%
39.1% -19.0%
-26.3%
21.5% -33.0%
-39.0%
-44.3%
7.0%
Total Top 4 Top 5 Top 6 Top 7 Top 8 Top 9 Top 10
Total Return Top 10 Top 20 Top 30 Top 40 Top 50 Return
Returns without X trading days
Returns without X trading days
Source: FS Insight, TradingView 26Global Crypto Market Cap = $9.6 Trillion
• Our best estimate for the global crypto market cap under such a scenario for BTC would be $9.6 trillion,
• This estimate is based on the Bitcoin dominance support at approximately 40% throughout 2021
BTC Dominance vs. Crypto Market Cap
Bitcoin dominance has
found support at
approximately 40% three
times in 2021
Forecast
Bitcoin Market Cap (billions) $3,846
Bitcoin Dominance 40%
Global Crypto Market Cap (billions) $9,616
Source: FS Insight, TradingView
27Summary
Source: FS Insight, Google
28Table of 1 Introduction
2 Bitcoin
Contents
3 Ethereum
4 Crypto Thesis Update
5 Crypto Equities
29Ethereum Generated nearly $10 billion in fees
• DeFi, Stablecoins, NFTs, and other Web3 applications drove incredible growth of the network.
• Some of the top gas-consuming smart contracts OpenSea (NFTs), Uniswap (DeFi), Tether (Stablecoins), and MetaMask
(DeFi)
Annual Fees ($millions) ETH Fees ($millions)
$12,000 $2,000
$1,800
9,920
$10,000
$1,600
$1,400
$8,000
$1,200
$6,000 $1,000
$800
$4,000
1,564% Annual $600
Growth
$400
$2,000
596 $200
47 160 35
$0 $0
2017 2018 2019 2020 2021 Jan '21 Apr '21 Jul '21 Oct '21
Source: FS Insight, Coin Metrics 30…Despite Competition
• The L1 wars began in earnest 2021, as venture-backed chains offered new options for developers and users, most often
competing on scalability.
Layer 1 Multiple Comparison
Project P/S ratio
Terra 13,117.4x
Polkadot 12,932.3x
Cosmos 6,760.6x
Cardano 2,613.1x Tough to comp against other
speculative Layer 1’s Avalanche Solana Polkadot
Tezos 1,723.3x (AVAX) (SOL) (DOT)
NEAR Protocol 912.5x
Solana 801.5x
Elrond 460.8x
Avalanche 357.8x
Polygon 214.0x
Fantom 81.3x Terra Algorand Cardano
Ethereum 17.7x (LUNA) (ALGO) (ADA)
Source: FS Insight, Token Terminal 31ETH Supply Dynamics
• EIP 1559 enacted a burning mechanism that results in disinflationary pressure on supply when fees are paid to miners.
While we do not necessarily believe this to make ETH “sound” money, it is certainly beneficial for price.
• There are now over 9 million ETH locked until the merge, as the year progresses, we think this should continue to increase
as we achieve more clarity around timing. This could result in additional disinflationary pressure on the network.
ETH Net Issuance Since EIP 1559 (ETH)
20,000
15,000
10,000 > 9 million ETH locked
5,000
-
(5,000)
(10,000)
(15,000)
(20,000)
(25,000)
8/5/2021 9/5/2021 10/5/2021 11/5/2021 12/5/2021 1/5/2022
Total Issuance (ETH) Total Base Fees Burnt (ETH) Net Issuance (ETH)
Source: FS Insight, Coin Metrics, Glassnode 32Ethereum Undervalued Relative to Cloud Platforms
• If we were to apply a grow-adjusted multiple to the Ethereum network based on emerging cloud companies, we would
conclude on a fair value for 1 ETH in the $38k - $46k range.
• We do not think that there is sufficient evidence that market participants measure ETH against Web2 cloud companies,
and therefore do not project ETH to reach this value range. However, this exercise demonstrates how one could conclude
that ETH is fundamentally undervalued.
160.0x $6,000 Growth
The BVP Nasdaq Emerging Cloud EV / Annualized Revenue Growth Adjusted
Comp Index Constituents Revenue Rate EV/Revenue
140.0x
$5,000 MEAN 12.9x 37.6% 34.4x
120.0x
MEDIAN 9.8x 33.5% 29.3x
$4,000
100.0x
Implied Value
80.0x $3,000
Low High
60.0x ETH Fees Annual Growth Rate 1564% 1564%
17x $2,000
40.0x Growth-Adjusted EV/Revenue Multiple 458.1x 538.6x
$1,000 ETH Annualized Fees ($billions) $9,920 $9,920
20.0x
Implied Ethereum EV ($billions) $4,543,947 $5,343,295
0.0x $0
Jul '20 Oct '20 Jan '21 Apr '21 Jul '21 Oct '21 ETH Circulating Supply (millions) 118 118
ETH Market Cap/Annualized Fees (Rolling 30-Day Total) Price (USD) Implied Price Per Token $38,617 $45,410
Source: FS Insight, BVP Cloud Index, Glassnode 33We Think ETH Reaches $12k in 2022
• Despite a comp set of layer 1’s to comp to, we don’t think the market is necessarily pricing these assets based on
fundamentals just yet. However, qualitatively, we feel that Ethereum is remarkably undervalued.
• Instead, we applied a similar analysis to ETH (based on inflows and estimated MVRV) to arrive at a price target of $12,000
Metric 2015 2016 2017 2018 2019 2020 2021 2022E
Price ($) 1 8 742 131 129 739 3,687 11,892
% Growth NA 756% 9034% -82% -2% 475% 399% 223%
Supply (Millions) 76 87 97 104 109 114 118 121
% Growth NA 15% 11% 8% 5% 5% 3% 3%
Market Cap ($Millions) 72 711 71,770 13,618 14,020 84,297 433,787 1,443,197
% Growth NA 884% 9998% -81% 3% 501% 415% 233%
Realized Cap ($Millions) 32 736 34,453 28,819 23,469 49,297 261,448 681,423
% Growth NA 2166% 4583% -16% -19% 110% 430% 161%
Incremental Inflows ($Millions) NA 703 33,717 (5,634) (5,350) 25,828 212,151 419,975
% Growth NA NA 4694% -117% -5% -583% 721% 98%
Market Cap/Realized Cap 2.2x 1.0x 2.1x 0.5x 0.6x 1.7x 1.7x 2.1x
Market Cap to Realized Cap / Proj. Realized Cap Increase (%)
11,892 2.2x 2.3x 2.1x 2.5x 2.6x
140% 11,532 12,056 11,101 13,104 13,628
150% 12,012 12,558 11,564 13,650 14,196
157% 12,353 12,915 11,892 14,038 14,599
170% 12,973 13,563 12,489 14,742 15,332
180% 13,454 14,065 12,952 15,288 15,900
Source: FS Insight, Coin Metrics 34Potential Catalysts
It has been expressed within the Ethereum
community that there is optimism
surrounding the transition to PoS in 2022,
which if it were to transpire, would likely
1. The merge result in capital inflows irrespective of BTC
performance.
2. BTC demand increase (rotations!)
3. Layer 2 development
4. ETF launch (futures or spot)
35Table of 1 Introduction
2 Bitcoin
Contents
3 Ethereum
4 Crypto Thesis Update
5 Crypto Equities
36Bitcoin Provides a Global Value Settlement Layer
• A trustless, P2P electronic payment system
• Bitcoin’s transparent and immutable architecture coupled with its finite and fungible supply allows it to serve as a superior
store of value for investors. For this reason, many have dubbed Bitcoin as digital gold.
• We think that other short- and long-term stores of value such as real estate and bond markets present equally compelling
market-sizing comparisons for Bitcoin.
Bitcoin:Smart Contract Platforms Provide Decentralized Computing
• People saw what BTC could do and wanted to do more things in a trustless manner. Ethereum was launched in 2015
with smart contract functionality, thus providing a distributed computing platform.
• In the years following Ethereum’s gain in popularity, several additional layer 1 platforms were launched to compete with
and against Ethereum. These platforms include the likes of Solana, Cardano, Avalanche, and Polkadot.
• Many refer to these open protocols as decentralized cloud services, since they allow for computation and storage without
the closed and siloed architecture of AWS or Microsoft Azure.
Cloud Infrasructure Market Revenues (Bn)
Rank Company Market Cap ($Bn)
$300 14%
1 Ethereum $321
2 Adobe 236 $250 12%
3 Salesforce 208
10%
4 PayPal 184 $200
5 Shopify 109 8%
6 ServiceNow 96 $150
6%
7 Snowflake 78 $100
8 Atlassian 74 4%
9 Workday 56 $50 2%
10 Square 52
11 Zoom 42 $0 0%
Q3 2020 Q4 2020 Q1 2021 Q2 2021 Q3 2021 Q4 2021 Q1 2022 Q2 2022 Q3 2022 Q4 2022
Ethereum is Quarterly Trailing Twelve Months Annualized Quarterly Growth
larger than all • Cloud Infrastructure revenues continue to grow at a rapid clip, surpassing $182 billion in
annualized quarterly revenue in Q3 2021
companies in the
• Assuming a quarterly growth rate of 7%, annualized revenues will surpass $250 billion next
BVP Cloud Index year
Source: FS Insight, Bessemer Venture Partners, Synergy Research Group 38Smart Contract Platforms Provide Decentralized Computing
• L1 platforms are the new rails on which value is stored and exchanged. For the first time software is eating trust-based
services.
• the goal of these platforms is to house native apps in their respective digital ecosystems, comparing these platforms to
centralized cloud companies may be limiting. Instead, we think it might be more reasonable to compare them to digital
“economies” with proprietary sets of rules governing value creation, storage, and transfer.
Total Stock (Crypto) Total Stock (Crypto)
Rank Country Market Cap Rank Country Market Cap
1 United States 40,720 16 South Africa 1,052
2 China 12,214 17 Brazil 988
All Smart Contract
3 Japan 6,718 18 Spain 759 platforms
4 Hong Kong SAR, China 6,130 19 Russian Federation 695 combined would be
5 United Kingdom 3,571 20 Singapore 653 equal to the 23rd
6 Canada 2,641 21 Italy 587 Largest Economy
7 India 2,595 22 Thailand 543
8 Saudi Arabia 2,429 23 All L1's 520
9 France 2,366 24 Indonesia 496
10 Germany 2,284 25 Malaysia 437
11 Korea, Rep. 2,176 26 Mexico 400 Ethereum would
12 Switzerland 2,002 27 Ethereum 321 be the 27th largest
13 Australia 1,721 28 Belgium 321 economy
14 Iran, Islamic Rep. 1,218 29 Norway 296
15 Netherlands 1,100 30 United Arab Emirates 295
Slide 39
Source: FS Insight, World Bank, Messari, CoinMarketCapDecentralized Apps (dApp) Bring Economic Productivity
• The GDP of decentralized digital ecosystems will be powered by dApps. Current dApps fall into several major categories
including Decentralized Finance (DeFi), NFTs/Metaverse/Gaming, Web3, and DAOs.
• The first “killer” dApps in crypto were DeFi applications that entered the mainstream in 2020 and continue to be widely
used today. DeFi consists of financial applications built on blockchains that are designed with composability,
interoperability, and tokenized incentives.
A Complete Financial Services Suite Growth in Assets Invested
Current DeFi Market Cap: $65 billion(1)
Every day, there are new applications Total Value Locked (TVL), the amount
being built and brought online that of capital dedicated to DeFi protocols,
service the entire spectrum of financial has increased to $245B, and it isn’t
products such as lending, exchanges, slowing down
payments, asset management, etc. Market Cap of Global Financial Services Sector:
TVL is equivalent to 1.4% of all $9,160 billion(1) (140x DeFi)
669 deposits in US Commercial Banks
Protocols to Choose From Over the past year, the number of DeFi
Lending Payments users has grown 4.5x
Global DeFi TVL (2021) A 10% market capture would result in 14x
$245B
returns from today
Exchanges Assets
+600% % Market Theorized
Capture Market Cap Return
5% 458 7.0x
Insurance Derivatives 10% 916 14.1x
$35B
15% 1,374 21.1x
20% 1,832 28.2x
Jan Feb Mar Apr May Jun Jul Aug Sep Oct
Source: FS Insight, University of Cambridge, Statista, Bloomberg, Fidelity, Market Data as of November 2021
40Web3
• “Web3” has evolved to take on a variety of meanings. We view web3 as crypto networks that unbundle internet
infrastructure and disrupt gatekeepers.
• The concept behind Web3 aims to unbundle the legacy internet infrastructure by providing decentralized alternatives to
highly centralized incumbent companies.
• Decentralized Web3 protocols earn revenues by charging fees for usage – paid in the native token.
Web2 Web3 Summary
• Protocols like Livepeer and Akash consolidate excess
Computation computational resources – creating a censorship-resistant
decentralized network to host apps and content.
• Protocols like Filecoin and Arweave provide decentralized trustless
Storage storage for web2 files and web3 assets like NFTs.
• The Graph indexes blockchain and protocol data like Google
Indexing indexes web2 data – making it easily accessible and searchable.
• Web3 provides content creators several benefits over Web2
Content including instant streaming payments, cheaper project funding &
distribution, and closer relationships with fans.
• Web3 networking protocols allow for zero-capex network growth
Networking by decentralizing cellular infrastructure. Participants are
incentivized to run nodes providing a wireless mesh network.
Source: FS Insight 41Web3 Networking
Example of Web3 Networking: Helium
• Rethinking traditional communications infrastructure, Helium deployed and operates the world’s largest Long Range Wide
Area Network (LoRaWAN) of over 300k hotspots – without physical infrastructure costs (CAPEX) or bandwidth costs
(OPEX).
• Participants are incentivized to grow the network by deploying hotspots that facilitate data transfers. Customers utilizing
the Helium Network pay a fee – in the native HNT token – to hotspot owners for each successful transfer.
IoT TAM Network Coverage Today
Total Annual Market Revenue: $200B
Smart Personal Safety
Trackers Tracking
$0.5B $3B
Micromobility Pet & Livestock
Tracking Tracking
$1B $5.5B
Agricultural IoT Fleet Tracking
$11B $18B
Smart Buildings Smart City
$66B Infrastructure
$100B
Current Customers Hotspot Development
Today
Disruption Targets
Exp. 2022
LoRaWAN 5G
Source: FS Insight, Fortune Business Insights, Helium
42Web3 Content
Audius: Removing Middlemen in Music
• The music industry generates $42 billion in annual revenue, artists only capture 12%. Audius allows artists to capture 90%.
• Artists get paid in real-time compared to the legacy multi-month payout system.
Current Streaming Platforms
Streaming Platform Fee
88% Record Label Cut 12%
Artist Share
Admin/Ops Costs
Audius
10%
90%
Launched Tracks Artists MAU
Node
Artist Share
Operators 2019 450k 100k 5M
vs competition Adoption
In the news Artists
Deadmau5 Skrillex Lido RAC
3lau Alina Baraz Zeds Dead REZZ
Source: FS Insight, Audius, CNBC
43Decentralized Autonomous Organizations (DAOs)
• Change how entities coordinate and work through aligned incentives
• DAOs are communities that align around a mission, typically through a community treasury and a shared set of rules
enforced on a blockchain. While DAOs offer a novel way of coordinating, they need to overcome some hurdles before
getting adopted by the mainstream. Majority of tooling for DAOs still rely on Web 2.0 and sustainable incentive
structures for core / full-time contributors have yet to surface.
Traditional DAOs Summary
• Traditional corporations typically operate in teams, with tight organizational structures
centered around a key figure.
• DAO members mostly function as sole contributors to the DAO mission, working together
Rigid Flexible with one another as needed.
• Corporations are governed from the top-down and typically have a singular leader who
leads corporations to achieve goals.
• DAO members submit proposals on which other members can vote. Most DAOs adopt a ‘1-
Hierarchical Grassroots token-1-vote’ model.
• Corporations typically provide audited financial statements, a historical view of the
company at a point in time.
• Since activity is recorded on the blockchain, DAOs provide transparency in the form of real-
Not usually transparent Transparent time transactions, recipients, and timestamps.
• Corporations typically are “invite-only”, hiring individuals with desired values and skills to
help further the entity’s vision.
• DAOs are open for anyone to join, but typically require minimum token holdings to align
Invite-only Open interests before allowing participation.
• Some corporations are global-first, but most start local and expand across geographies as
business lines grow.
• DAOs are global by default, and due to their global nature, still require Web 2.0 tooling to
Not always global Fully global coordinate and work across geographies.
Source: FS Insight, Forefront, Snapshot, Deepdao.io
44Decentralized Autonomous Organizations (DAOs)
• Change how entities coordinate and work through aligned incentives
• Today, there are more than 2,000 DAOs managing over $100B in assets, attracting an estimated 2M DAO members
and token holders. Ideated in 2017, DAOs are still in the early innings of changing the way we coordinate.
Protocol DAOs – Uniswap Investment DAOs – The LAO
• Protocol DAOs govern and vote on proposals put forth by its • Investment DAOs focus on investments through pooled funds with
members to allocate funds in protocol treasuries. The modus the explicit purpose of wealth creation.
operandi of different DAOs vary widely to serve different purposes. • The LAO is the first limited-liability for-profit DAO launched by
• Uniswap’s ($UNI) treasury directs native token emissions to OpenLaw, enabling members to invest ETH to generate profits.
contributor grants, community initiatives, and liquidity mining. • The treasury holds $37M of dry powder in its treasury and has
• UNI tokens can be used to vote on governance proposals or invested $70m in over 120 investments at writing.
delegated to protocol delegates to vote on their behalf. • Investment DAOs are generally perceived as competitors to
• Through the flows described above, Uniswap currently holds over traditional venture capital, with some protocols preferring DAO
$4B in its treasury, with approximately half of that in liquid assets. funding because of their shared grassroots nature.
Grant-giving DAOs – BitDAO Social DAOs – Friends with Benefits
• Grant-giving DAOs support the decentralized economy by supplying • Social DAOs are often described as ‘modern-day country clubs’, with
funding to proposals across subsectors, including economic token values backed by an individual, brand or community.
alignment, treasury management, and governance. • One such example is Friends with Benefits ($FWB), a cultural
• BitDAO is a DAO launched by Singapore-based Bybit exchange, membership powered by a community of creators.
having raised 112,000 ETH on Sushiswap’s MISO launchpad. • It leverages a tiered membership model where members hold $FWB
• It is the largest grant-giving DAO (treasury over $3.5B), and counts tokens to get access to online and in-person events, editorials, its
Peter Thiel, Pantera Capital and Dragonfly as investors. proprietary auction platform and local meet-ups.
• Potential proposals include project partnerships, ecosystem funds, • Boasting over 2,000 members and $18M in its treasury, FWB has
artist guilds, farming cooperatives, and R&D labs. grown from a token-gated group chat to a full-featured online space.
These DAO subcategories are not mutually exclusive – many combine one or more subcategories to differentiate from one another
Source: FS Insight, Etherscan.io, 45The Non-fungible World is Much Larger Than the Fungible
• DLT can be used to verify ownership and transfer of unique assets
• NFTs burst into the mainstream in 2021 with increasingly popular profile picture (pfp) NFTs such as CryptoPunks and
Bored Ape Yacht Club. Digital art also gained traction as a whole new cohort of crypto investors entered the fold,
realizing the ability to monetize and financialize art and cultural assets.
• Ultimately, any non-fungible asset (collectibles, art, real estate, auto, etc) will be secured and traded on digital rails.
NFT Volume
$3 $14
$12
$2
Proven NFT use-cases point to a
$10
current addressable market of $1
$2 trillion in annual sales
$8
$6
$1
$4
Market 2020 Sales (Bn)
$1 Art Market $50
$2 Collectibles 175
Luxury Goods 254
$0 $0 Gaming 179
Oct '20 Jan '21 Apr '21 Jul '21 Oct '21 Gambling 403
Weekly Volume (LHS, Mn) Cumulative Volume (RHS, Bn) Current NFT Addressable Market $1,061
Source: Loup Funds, Art Basel, DappRadar
46The Layers of the Metaverse Technology Stack
• Metaverse is a virtual world and interconnected ecosystem where users and businesses can create, interact, and monetize
by proving services and creating content. The seven layers of the Metaverse help create, maintain, monetize, and develop
the virtual worlds.
Front Ends & Interfaces
Issuance & Marketplaces Lending Liquidity Goods & IaaS Hardware
Management
Compute
Content,
Assets, ID
Services
Metaverse
Networking
NFT Financialization
Payment
Gaming & Virtual Worlds Sports Utility Music & Gov.
Services
Interchange Virtual
Tools & Platforms
Verticals & Applications
Standards
Layer-2 & Sidechains
Layer-1
Infrastructure
Source: FS Insight 47Table of 1 Introduction
2 Bitcoin
Contents
3 Ethereum
4 Crypto Thesis Update
5 Crypto Equities
48Crypto Equities Might Offer Crypto Beta
Type Company Ticker ($Million) Type Company Ticker ($Million)
Miners Marathon Digital Holdings MARA 2,117 Exchanges Coinbase COIN 37,090
Riot Blockchain RIOT 1,626 Bakkt Holdings BKKT 2,369
Hut 8 Mining HUT 884 Voyager Digital VYGVF 1,206
Terawulf Inc WULF 1,017 Mogo MOGO 152
Cipher Mining Inc CIFR 679
Hive Blockchain HIVE 684 Banks/ Other Signature Bank SBNY 18,453
Galaxy Digital GLXY CN 5,027
Iris Energy IREN 589
Silvergate Bank SI 2,807
Bitfarms Ltd. BITF 617
Metropolitan Bank MCB 1,061
Canaan Inc CAN 650 Bitwise Crypto Industry ETF BITQ 88
Greenidge Generation GREE 428
Argo Blockchaim ARBK 327 Crypto SPACs Power&Digital Infra. SPAC I XPDI 365
Stronghold Digital Mining SDIG 371 Blockchain Coinvestors SPAC BCSAU 407
Bit Mining Ltd BTCM 211 Power&Digital Infra. SPAC II XPDBU 358
CleanSpark Inc CLSK 251 Adit EdTech Acquisition Corp ADEX 341
Bit Digital Inc BTBT 252 Crypto 1 Acquisition Corp DAOOU 290
Ebang International EBON 162 Abri SPAC I ASPAU 77
The9 Ltd NCTY 82
Bitcoin/Crypto Grayscale Bitcoin Trust GBTC 17,550
DMG Blockchain Solutions DMGI CN 105
Balance Sheet MicroStrategy MSTR 3,500
Taal Distributed Information TAAL CN 108
Plays ProShares Bitcoin ETF BITO 33
Cryptostar Corp CSTR CN 40 Bitwise 10 Index Fund BITW 621
Sysorex Inc SYSX 14 VanEck Bitcoin Strategy ETF XBTF 18
Source: FS Insight, Bloomberg 49Bitcoin Miners Behave as Leveraged Plays on BTC Source: FS Insight, TradingView 50
Sean Farrell
                               Twitter: @SeanMFarrell

                               Will McEvoy
                               Twitter: @will__mcevoy

The Digital Assets Team
                               Walter Teng

                               Jack Runge

                          51
Disclosures
This research is for the clients of FS Insight only. For important disclosures and rating histories regarding sectors or companies that are the subject of this report, please contact your sales representative or FS Insight at
150 East 52nd Street, New York, NY, 10022 USA.
Analyst Certification (Reg AC)
Sean Farrell, the research analyst denoted by an “AC” on the cover of this report, hereby certifies that all of the views expressed in this report accurately reflect my personal views, which have not been influenced by
considerations of the firm’s business or client relationships.
Neither I (Sean Farrell), nor a member of my household is an officer, director, or advisory board member of the issuer(s) or has another significant affiliation with the issuer(s) that is/are the subject of this research report.
There is a possibility that we will from time to time have long or short positions in, and buy or sell, the securities or derivatives, if any, referred to in this research
Conflicts of Interest
This research contains the views, opinions and recommendations of FS Insight. This report is intended for research and educational purposes.
Analyst Industry/Sector Views
Positive (+): The analyst expects the performance of his industry/sector coverage universe over the next 6-18 months to be attractive vs. the relevant broad market benchmark, being the S&P 500 for North America.
Neutral (N): The analyst expects the performance of his or her industry/sector coverage universe over the next 6-18 months to be in line with the relevant broad market benchmark, being the S&P 500 for North America.
Negative (-): The analyst expects his or her industry coverage universe over the next 6-18 months to underperform vs. the relevant broad market benchmark, being the S&P 500 for North America.
General Disclosures
FS Insight is an independent research company and is not a registered investment advisor and is not acting as a broker dealer under any federal or state securities laws. FS Insight is a member of IRC Securities’ Research
Prime Services Platform. IRC Securities is a FINRA registered broker-dealer that is focused on supporting the independent research industry. Certain personnel of FS Insight (i.e. Research Analysts) are registered
representatives of IRC Securities, a FINRA member firm registered as a broker-dealer with the Securities and Exchange Commission and certain state securities regulators. As registered representatives and independent
contractors of IRC Securities, such personnel June receive commissions paid to or shared with IRC Securities for transactions placed by FS Insight clients directly with IRC Securities or with securities firms that June share
commissions with IRC Securities in accordance with applicable SEC and FINRA requirements. IRC Securities does not distribute the research of FS Insight, which is available to select institutional clients that have engaged
FS Insight.
As registered representatives of IRC Securities our analysts must follow IRC Securities’ Written Supervisory Procedures. Notable compliance policies include (1) prohibition of insider trading or the facilitation thereof, (2)
maintaining client confidentiality, (3) archival of electronic communications, and (4) appropriate use of electronic communications, amongst other compliance related policies.
FS Insight does not have the same conflicts that traditional sell-side research organizations have because FS Insight (1) does not conduct any investment banking activities and (2) does not manage any investment funds.
This research is for the clients of FS Insight only. Additional information is available upon request. Information has been obtained from sources believed to be reliable but FS Insight does not warrant its completeness or
accuracy except with respect to any disclosures relative to FS Insight and the analyst's involvement (if any) with any of the subject companies of the research. All pricing is as of the market close for the securities
discussed, unless otherwise stated. Opinions and estimates constitute our judgment as of the date of this material and are subject to change without notice. Past performance is not indicative of future results. This
material is not intended as an offer or solicitation for the purchase or sale of any financial instrument. The opinions and recommendations herein do not take into account individual client circumstances, risk tolerance,
objectives, or needs and are not intended as recommendations of particular securities, financial instruments or strategies. The recipient of this report must make its own independent decision regarding any securities or
financial instruments mentioned herein. Except in circumstances where FS Insight expressly agrees otherwise in writing, FS Insight is not acting as a municipal advisor and the opinions or views contained herein are not
intended to be, and do not constitute, advice, including within the meaning of Section 15B of the Securities Exchange Act of 1934. All research reports are disseminated and available to all clients simultaneously through
electronic publication to our internal client website, FS Insight.com. Not all research content is redistributed to our clients or made available to third-party aggregators or the media. Please contact your sales
representative if you would like to receive any of our research publications.
Copyright 2021 FS Insight LLC. All rights reserved. No part of this material may be reprinted, sold or redistributed without the prior written consent of FS Insight LLC.
Slide 52You can also read