Development and Application of the Fireshed Registry - USDA ...
←
→
Page content transcription
If your browser does not render page correctly, please read the page content below
Forest Service
                          U.S. DEPARTMENT OF AGRICULTURE

Rocky Mountain Research Station         General Technical Report RMRS-GTR-425        May 2021

Development and Application of the Fireshed Registry

Alan A. Ager, Michelle A. Day, Chris Ringo, Cody R. Evers, Fermin J. Alcasena,
Rachel M. Houtman, Michael Scanlon, and Tania Ellersick

                                  Assessment

                                                               Prioritization

                                                                                Treatment
Ager, Alan A.; Day, Michelle A.; Ringo, Chris; Evers, Cody R.; Alcasena, Fermin J.; Houtman,
    Rachel M.; Scanlon, Michael; Ellersick, Tania. 2021. Development and application of the
    fireshed registry. Gen. Tech. Rep. RMRS-GTR-425. Fort Collins, CO: U.S. Department of
    Agriculture, Forest Service, Rocky Mountain Research Station. 47 p. https://doi.org/10.2737/
    RMRS-GTR-425.

Abstract
      The Fireshed Registry is an interactive geospatial data portal providing access to data
describing past, present, and future trends regarding wildfire exposure to communities and forest
and fuel management. The registry employs a nested spatial framework that organizes landscape
variation in wildfire risk to developed areas into containers or “firesheds” and displays these data
on a background of maps on management and disturbances, including past and predicted wildfire
events and their potential impacts. It was built in close cooperation with USDA Forest Service
staff and establishes a nationally consistent, all-lands, scalable framework for classifying fireshed
conditions in terms of underlying wildfire transmission and the potential to mitigate exposure and
risk. Foremost, the framework provides a foundation for communication and coordination with
external agencies and partners for cross-boundary collaboration and can potentially improve
agency national reporting and monitoring of programs. The registry provides the Forest Service
with a planning framework for tracking changes in fireshed conditions with respect to wildfire
exposure at forest, regional, and national scales. We describe the process of building the system,
sources of data, and its application within the agency for decision support and reporting for multiple
ongoing programs related to forest and landscape management.

Keywords: collaborative forest planning, wildfire risk, scenario planning, fuel management,
          wildland urban interface

Cover photo
The Fireshed Registry incorporates an exposure “Assessment” using a national map of the 7,688
firesheds created from community wildfire transmission data with areas in red/orange representing
hotspots of modeled sources of fire transmission to buildings in adjacent or nearby communities;
and “Prioritization” through scenario planning to identify areas for “Treatment” within priority
firesheds, such as the example prescribed fire hazardous fuels “Treatment” on the Finley National
Wildlife Refuge (USFWS photo by Brent Lawrence, licensed under CC BY-ND 2.0).

        All Rocky Mountain Research Station publications are published by U.S. Forest Service employees and
        are in the public domain and available at no cost. Even though U.S. Forest Service publications are not
        copyrighted, they are formatted according to U.S. Department of Agriculture standards and research
        findings and formatting cannot be altered in reprints. Altering content or formatting, including the
        cover and title page, is strictly prohibited.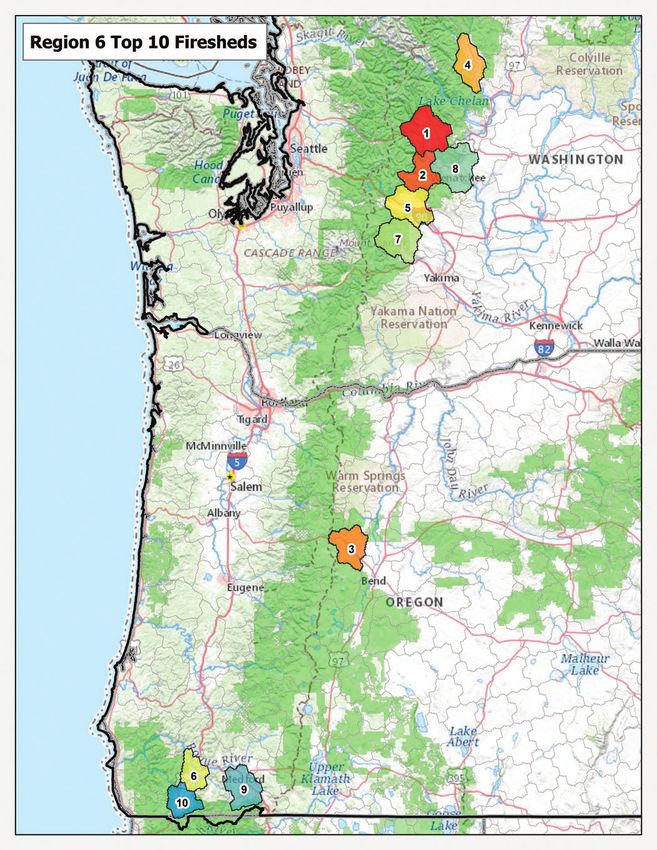
Authors
Alan A. Ager is a Research Forester in the Fire, Fuel, and Smoke Research Program, Rocky
Mountain Research Station, Missoula, Montana.

Michelle A. Day is a Biological Scientist in the Fire, Fuel, and Smoke Research Program, Rocky
Mountain Research Station, Missoula, Montana.

Chris Ringo is a Senior Faculty Research Assistant in the Department of Crop and Soil Science in
the College of Agricultural Sciences at Oregon State University in Corvallis, Oregon.

Cody R. Evers is a Research Associate in the Department of Environmental Science and
Management at Portland State University in Portland, Oregon.
Fermin J. Alcasena is a USDA Forest Service International Visiting Scholar at Oregon State
University in Corvallis, Oregon.

Rachel M. Houtman is a Faculty Research Assistant in the Department of Forest Ecosystems &
Society in the College of Forestry at Oregon State University in Corvallis, Oregon.

Michael Scanlon is a Software Systems Analyst detailed to the Fire, Fuel, and Smoke Research
Program from the USDA Forest Service Chief Information Office in Corvallis, Oregon.

Tania Ellersick is a Senior Policy Analyst in the Washington Office – Forest Management, Range
Management, and Vegetation Ecology Staff in Washington, DC.

Acknowledgments
      The Fireshed Registry was funded by USDA Forest Service, State and Private Forestry.
Thanks to Ken Bunzel for geospatial processing and to Lucy Coleman and Joseph Munyao at ESRI
for initial work on the geospatial dashboard. Conversations with John Phipps guided the conceptual
framework behind the registry.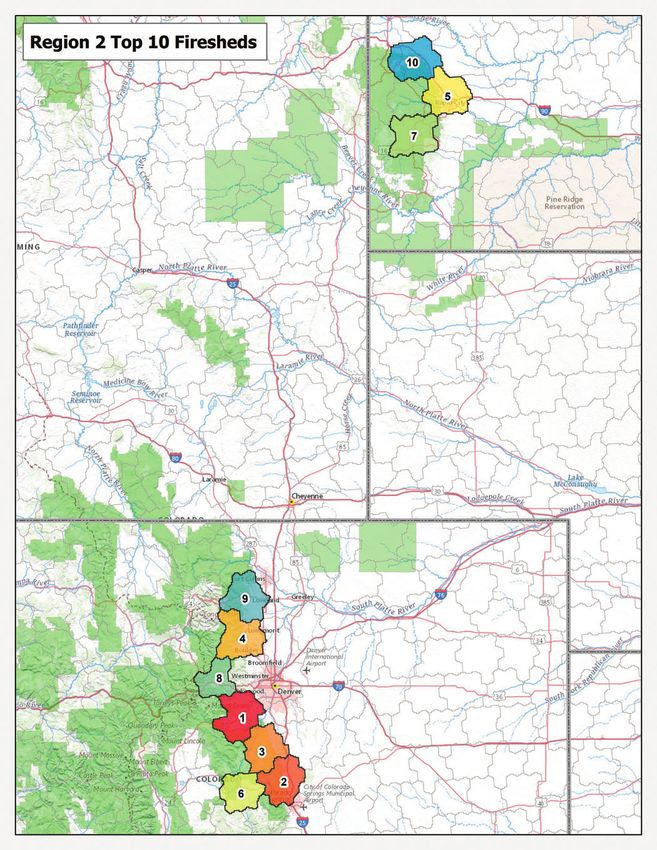
Contents

Introduction . . . . . . . . . . . . . . . . . . . . . . . . . . . . . . . . . . . . . . . . . . . . . . . . . . . . . . . . . . . . 1
Methods . . . . . . . . . . . . . . . . . . . . . . . . . . . . . . . . . . . . . . . . . . . . . . . . . . . . . . . . . . . . . . . 3
   Geographic Extent of the Registry  . . . . . . . . . . . . . . . . . . . . . . . . . . . . . . . . . . . . . . . 3
   Estimating Wildfire Exposure to the WUI  . . . . . . . . . . . . . . . . . . . . . . . . . . . . . . . . . . 3
   Delineating Firesheds  . . . . . . . . . . . . . . . . . . . . . . . . . . . . . . . . . . . . . . . . . . . . . . . . 6
   Delineating Communities  . . . . . . . . . . . . . . . . . . . . . . . . . . . . . . . . . . . . . . . . . . . . . . 8
   Data Describing Fireshed Conditions  . . . . . . . . . . . . . . . . . . . . . . . . . . . . . . . . . . . . 8
   Geospatial Registry . . . . . . . . . . . . . . . . . . . . . . . . . . . . . . . . . . . . . . . . . . . . . . . . . . 13
   Identification of Priority Firesheds . . . . . . . . . . . . . . . . . . . . . . . . . . . . . . . . . . . . . . . 14
Application . . . . . . . . . . . . . . . . . . . . . . . . . . . . . . . . . . . . . . . . . . . . . . . . . . . . . . . . . . . . 16
   Fiscal Year 2021 National Fuels Investment Strategy  . . . . . . . . . . . . . . . . . . . . . . . 16
   Executive Order (EO) 13855 . . . . . . . . . . . . . . . . . . . . . . . . . . . . . . . . . . . . . . . . . . . 17
   Scenarios for Revision of the National Fire Plan  . . . . . . . . . . . . . . . . . . . . . . . . . . . 18
   Performance Metrics for Shared Stewardship  . . . . . . . . . . . . . . . . . . . . . . . . . . . . . 20
   Prioritization of Restoration Partnership Projects . . . . . . . . . . . . . . . . . . . . . . . . . . . 21
   Evaluating Collaborative Forest Landscape Restoration Program Proposals  . . . . . 21
   Additional Applications of the Fireshed Registry  . . . . . . . . . . . . . . . . . . . . . . . . . . . 22
Discussion . . . . . . . . . . . . . . . . . . . . . . . . . . . . . . . . . . . . . . . . . . . . . . . . . . . . . . . . . . . . 23
References .  . . . . . . . . . . . . . . . . . . . . . . . . . . . . . . . . . . . . . . . . . . . . . . . . . . . . . . . . . . 27
Appendix A. Fireshed Registry Data Details . . . . . . . . . . . . . . . . . . . . . . . . . . . . . . . . . .34
   References  . . . . . . . . . . . . . . . . . . . . . . . . . . . . . . . . . . . . . . . . . . . . . . . . . . . . . . . . 38
Appendix B. Top 10 Firesheds by Forest Service Region . . . . . . . . . . . . . . . . . . . . . . . . 40
Introduction

                                  The impacts of the 2020 fire season on people, property, natural resources,
                                  and fire suppression budgets have stimulated wide-ranging policy discussions
                                  about the role of active forest management to reduce hazardous fuels on
                                  federal and private wildlands. Wildfire impacts to developed areas are
                                  increasing in frequency, driven by multiple social and biophysical factors
                                  including the expanding wildland urban interface (WUI, Radeloff et al.
                                  2018), increasing fire occurrence from human ignitions (Abatzoglou et al.
                                  2018; Balch et al. 2017; Nagy et al. 2018), and changing climate (Abatzoglou
                                  and Williams 2016; Littell et al. 2018; McKenzie and Littell 2017). In the
                                  western United States, the buildup of forest fuels on public lands from fire
                                  exclusion in fire-adapted forests, coupled with regional droughts (Littell et
                                  al. 2016) and high-wind events (Abatzoglou et al. 2018), are catalyzing large
                                  pyro-convective fire events that spread to developed areas and consume
                                  housing subdivisions despite local fire hazard efforts within and around
                                  them (e.g., 2018 Carr Fire). These fire events increasingly challenge risk
                                  governance systems at multiple administrative and jurisdictional scales
                                  owing to their uncertainty in time and space, overlaid by fragmented risk
                                  governance across the boundaries that fires burn and the fuels they consume
                                  (Fischer et al. 2016; Steelman 2016).
                                  As in other natural disasters, managing wildfire risk is a multiscale, cross-
                                  boundary problem that requires spatial planning frameworks to organize
                                  location-specific mitigation measures and efficiently allocate finite resources
                                  for both predisaster planning and postdisaster recovery (Greiving and
                                  Angignard 2014; Sapountzaki et al. 2011). Here, spatial containers are
                                  designed and scaled with the process at hand considering both the source of
                                  risk and what is at risk. Spatial planning frameworks exist for many other
                                  contexts (e.g., airsheds, watersheds, flood control districts, fire suppression).
                                  Within these containers, mitigation planning uses localized assessments to
                                  design site-specific mitigation programs to reduce impacts (e.g., floodplain
                                  mapping, development and building codes, dams). However, in the case
                                  of community disaster planning for wildfire, mitigation planning has been
                                  organized around individual community boundaries (e.g., community
                                  wildfire protection plans) (Jakes and Sturtevant 2013; USDA-USDI 2013),
                                  rather than spatial containers that delineate the scale of wildfire risk to them.
                                  Mitigation plans are thus decoupled from landscape efforts to manage fuels
                                  and ignitions on the larger landscape of public and private wildlands, creating
                                  a scale mismatch (Ager et al. 2016; Cumming et al. 2006; Turner et al. 2002).
                                  Communities are also inefficient spatial units for organizing and prioritizing
                                  federal assistance from public land management agencies. Developed areas
                                  in the western United States that are most exposed to wildfire risk often
                                  occur outside of formal community boundaries or are artificially grouped

USDA Forest Service RMRS GTR-425. 2021.                                                                          1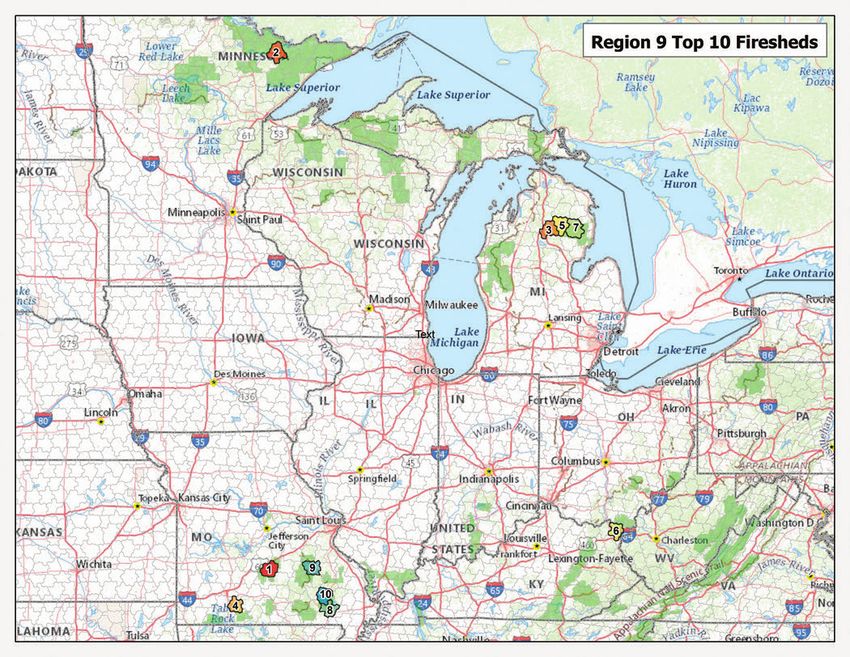
together based on historical factors unrelated to fire risk, thereby rendering
                                  community distinctions cloudy for anything other than city scale governance
                                  or access to federal funding. Moreover, in the larger wildland landscape, a
                                  single land parcel can contribute risk to multiple communities and, thus, the
                                  priority for fuel management should be based on the sum of the projected
                                  effect rather than any one community that it exposes.
                                  Wildfire disaster planning can be improved with an assessment framework
                                  that connects social (ownership, jurisdictions) and biophysical (wildfire
                                  risk) conditions at scales meaningful in terms of large fires and forest and
                                  fuel management (Ager et al. 2016). Beyond assessments, spatial planning
                                  frameworks are required to ingest assessments and analyze how scarce
                                  financial resources can be allocated for forest and fuel management to
                                  target high leverage landscapes in terms of reducing wildfire risk. Linking
                                  assessment and planning systems provides a clear path to make progress
                                  towards the goals of the cohesive strategy (i.e., fire resilient communities
                                  fire adapted landscapes, safe and effective response [USDA-USDI 2013]).
                                  Widespread use of spatial planning models to explore fundamental questions
                                  about tradeoffs, outcomes, and spatial allocation efficiencies (Borges et al.
                                  2017; Kline and Mazzotta 2012; Schroder et al. 2016) to respond to the
                                  escalating fire problem remain in a discussion phase in most federal land
                                  management agencies (Ager et al. 2017).
                                  In this paper we describe the development and application of a geospatial
                                  information system that organizes landscape risk to developed areas into
                                  a planning framework. The system provides the first spatial assessment
                                  framework to specifically address wildfire risk to developed areas (Ager et
                                  al., in review). The Fireshed Registry is an ArcGIS Online dashboard that
                                  organizes the source of community exposure into hierarchical management
                                  containers, and it attributes these containers with information about past,
                                  present, and future plans with respect to management and disturbance.
                                  Just as watersheds are functional geographic delineations to manage water
                                  resources and airsheds are delineated to manage air quality, firesheds provide
                                  an organizing principle to manage wildfire risk to communities. In this paper,
                                  we describe the process of building the system, the sources of data, and its
                                  application within the agency to provide decision support and reporting
                                  capability for multiple ongoing agency initiatives.

USDA Forest Service RMRS GTR-425. 2021.                                                                        2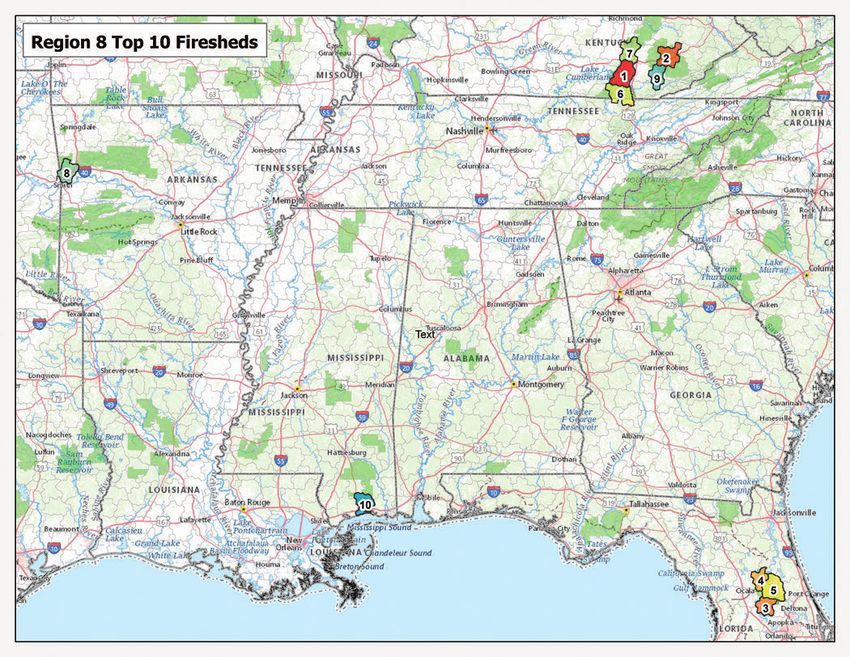
Methods

Geographic Extent                 Firesheds were delineated and attributed for all lands in the continental
of the Registry                   United States and include 192 million ha of forest land (USGS 2011).
                                  National Forest System lands cover over 69 million ha. Delineations
                                  of firesheds did not consider administrative, jurisdictional, or other
                                  anthropogenic boundaries.

Estimating Wildfire               We used wildfire simulation data from the national FSim library (Short et
Exposure to the WUI               al. 2020a; fire perimeters not publicly available) with 79.4 million simulated
                                  fires for the continental United States. FSim consists of modules for weather
                                  generation, large-fire occurrence, growth, and suppression (Finney et al.
                                  2011; Short et al. 2020a). For the most recent simulations (Short et al.
                                  2020a), fuel conditions circa 2014 were used (LANDFIRE 2017), and
                                  weather was based on a national gridded dataset from the North American
                                  Land Data Assimilation System (NLDAS), a contemporary surface weather
                                  data assimilation system (Abatzoglou 2013). The NLDAS data were
                                  analyzed to produce daily spatiotemporal realizations of a fire danger index
                                  (Energy Release Component) retaining the spatial covariance structure
                                  and temporal auto-correlation of weather inputs (Grenfell et al. 2010),
                                  maintaining synchrony across weather scenarios used among independently
                                  simulated geographic areas. The geographic units used in simulations by
                                  Short et al. (2020a) were regions of relatively homogenous contemporary
                                  fire regimes called “pyromes” (Short et al. 2020b) with 128 pyromes across
                                  the continental United States. Between 10,000 and 100,000 hypothetical
                                  fire seasons were simulated for each pyrome, depending on the historical
                                  large fire frequency. The processes of calibrating and validating FSim area
                                  burned outputs and fire-size distributions from prior CONUS simulations
                                  are presented in Finney et al. (2011), with advances described by Short et
                                  al. (2020a). For each simulated fire, we obtained the ignition location and
                                  associated perimeter for each fire as output in shapefiles, along with the burn
                                  probability raster at 270-m resolution.
                                  Building locations were obtained from the vector building dataset created
                                  by the Bing Maps team at Microsoft (Microsoft 2018). The dataset includes
                                  housing units, apartments, and farm, storage, and industrial buildings, etc. We
                                  extracted the 124,828,569 footprints for the continental United States. The
                                  data were converted to points where each point represents a single building.
                                  The data represent building locations in 2015 (table 1; Appendix A). We then
                                  intersected simulated fire perimeters with the building footprints and used the
                                  outputs to attribute each fire ignition with the number of buildings exposed
                                  (within the fire perimeter) by a given ignition.

USDA Forest Service RMRS GTR-425. 2021.                                                                         3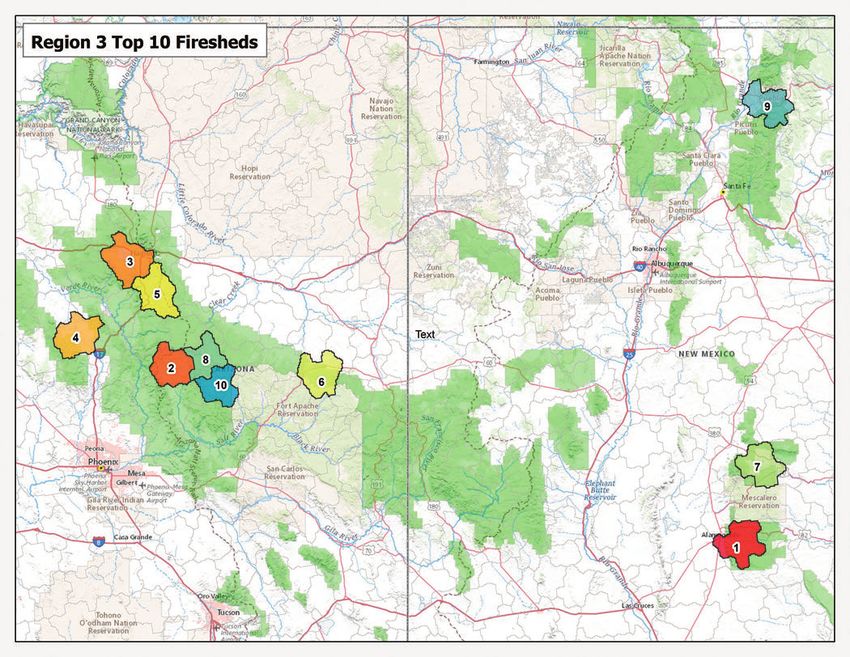
Table 1—Spatial data descriptions, sources, and vintages used in the Fireshed Registry and prioritization process listed by dashboard tab. See Appendix A for
non-spatial data sources.
Dashboard tab
and fuels
Overview
treatments
Ownership
Historic fires
Communities
and treatments
Simulated fires
Planned/proposed
Spatial layer Description Source Data vintage
USFS Regions USFS Regional boundaries AGOL/USFS Current X X X X X X
USFS national forest USFS administrative AGOL/USFS Current X X X X X
USDA Forest Service RMRS GTR-425. 2021.
boundaries boundaries
Firesheds Fireshed boundaries Evers et al. (2020) 2019 X X X X X X
Project areas Project area boundaries Evers et al. (2020) 2019 X X
Building locations Building footprints Microsoft (2018) 2015 X X X X X X
Fire perimeters Historical fire perimeters AGOL/USFS; MTBS 2017 X X X X
Data Access (2020)
Prioritized treatment Treated stands output from Ager et al. (In review) 2019 X X
locations scenario planning
WUI WUI interface & intermix SILVIS Lab (2012) 2010 X X X X
Ownership Major ownership groups Protected areas 2016: Western United X X X
database (USGS 2016, States; 2019: Eastern
2019) United States
Fuel types 40 Scott and Burgan Fire LANDFIRE (2017) 2014 X X
behavior fuel models
Historic fuels Prescribed fire treatments MTBS Data Access 2010–2017 (MTBS); X
treatments—prescribed completed within the fireshed (2020); LANDFIRE 2010–2014 (LANDFIRE);
fire (2014); FACTS (USDA 2010–2019 (FACTS)
FS 2020)
Historic fuels Canopy thinning treatments LANDFIRE (2014); 2010–2014 (LANDFIRE); X
treatments—thinning completed within the fireshed FACTS (USDA FS 2020) 2010–2019 (FACTS)
4
(continued on next page)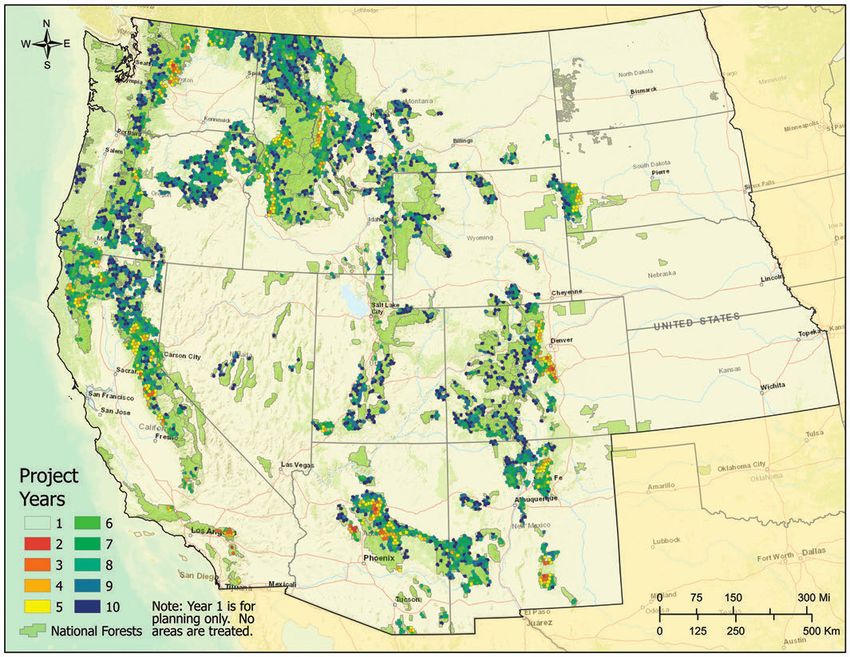
Table 1 (continued)—Spatial data descriptions, sources, and vintages used in the Fireshed Registry and prioritization process listed by dashboard tab. See
                                          Appendix A for non-spatial data sources.

                                                                                                                                                                                   Dashboard tab

                                                                                                                                                                       and fuels

                                                                                                                                                            Overview
                                                                                                                                                                                                                          treatments

                                                                                                                                                                       Ownership
                                                                                                                                                                                    Historic fires
                                                                                                                                                                                                                                          Communities

                                                                                                                                                                                   and treatments
                                                                                                                                                                                                     Simulated fires
                                                                                                                                                                                                                       Planned/proposed

                                          Spatial layer              Description                     Source                    Data vintage

                                          Historic fuels             Mastication treatments          LANDFIRE (2014),          2010–2014 (LANDFIRE);                                    X
                                          treatments—mastication     completed within the fireshed   FACTS (USDA FS 2020)      2010–2019 (FACTS)

USDA Forest Service RMRS GTR-425. 2021.
                                          Planned fuel treatments    Planned USFS treatments         FACTS; Region 2           2020–2030                                                X
                                                                                                     CFLRP, Joint Chiefs,
                                                                                                     Forest Focus Areas,
                                                                                                     RMRI

                                          Thinning volume            Potential merchantable          Forest Inventory and       2017; data do not                                       X                                    X
                                                                     timber volume from              Analysis imputed tree list account for recent
                                                                     treatments (MBF) for the        data 2014 (Riley et al.    disturbance
                                                                     western United States           2016)

                                          Building exposure index    Interpolated / smoothed         Ager et al. (in review)   2015 (MS footprint)                                                       X                   X
                                                                     building exposure raster

                                          Top five simulated fire    Top five simulated fires        FSim (Short et al.        2015 (MS footprint)                                                       X
                                          perimeters by fireshed     igniting within each fireshed   2020a); MS footprints
                                                                     (in terms of building           (Microsoft 2018)
                                                                     exposure)
                                          Top five simulated         Top five simulated fires        FSim (Short et al.        2015 (MS footprint)                                                                                           X
                                          fire perimeters by         igniting within each            2020a); MS footprints
                                          community                  community (in terms of          (Microsoft 2018)
                                                                     building exposure)
                                          Community zones            Community zones based on        Bunzel et al. (2021)      2010                                                                                                          X
                                                                     45-minute drive time from
                                                                     U.S. Census designated
                                                                     places.
                                          Firewise communities       Firewise USA sites in good      NFPA (2015)               2020                                                                                                          X
                                                                     standing (n = 1,689)

5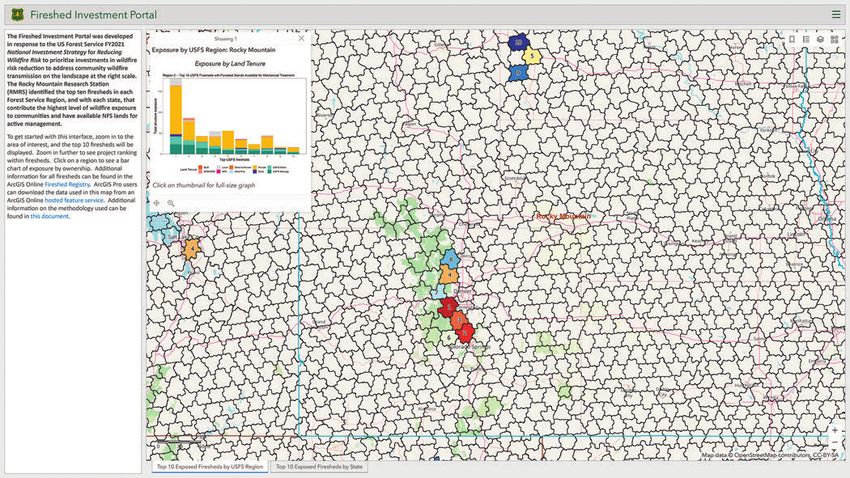
Ignitions attributed with building exposure were then used to create a
                                  smoothed building exposure map using inverse distance weighting in ArcGIS
                                  using a search radius of 2,500 m, a power of 0.5, and a cell size of 90 m. This
                                  resulted in a map of building exposure given a fire occurs. To correct for the
                                  probability of ignition, an ignition probability raster was created (ignitions/
                                  acre/yr) using the ArcGIS point density tool with a 2,500-m circular search
                                  radius, area units as acres, and the population field set to ignitions per year.
                                  The building exposure raster described above was multiplied by the ignition
                                  probability raster to create a smoothed building exposure raster where each
                                  cell represents the number of buildings affected by fires igniting in the
                                  surrounding acre in 1 year. Units are buildings exposed/acre/year. Thus, the
                                  outputs represent expected exposure, calculated as the product of likelihood
                                  and total exposure given a fire occurs. This formulation is similar to expected
                                  loss (risk) except that exposure only predicts the juxtaposition of wildfire and
                                  buildings, and excludes prediction of effects.

Delineating Firesheds             Firesheds within the registry are accounting units that are delineated based on
                                  a smoothed building exposure map of the continental United States created
                                  from the building exposure map described above.1 The fireshed boundaries
                                  were created by dividing up the landscape into regular-sized units that
                                  represent similar source levels of community exposure to wildfire (described
                                  above). To account for the fact that wildfire risk and risk mitigation efforts
                                  occur at multiple scales, exposure at stand-, project-, and fireshed-level scales
                                  was assessed (fig. 1). These layers were created in such a way that a finer-
                                  scale was nested within a coarser-scale, in much the same way as a drainage

                                  Figure 1—Nested spatial framework for firesheds. Each scale has specific
                                  functionality in terms of the planning processes. Firesheds are the broad scale
                                  unit of prioritization, but planning areas within them are also prioritized as part of
                                  implementation of treatments. Planning areas are roughly the size that national
                                  forests use for conducting vegetation and fuel management projects. The relative
                                  variation among firesheds compared to variation within them controls the relative
                                  emphasis on selecting firesheds versus individual planning areas. Figure modified
                                  from Ager et al. (in review).

                                  1
                                   The original fireshed boundaries were based on a smoothed structure exposure map based
                                  on SILVIS wildland urban interface housing unit density data (SILVIS Lab 2010) as described in
                                  Ager et al. (2019b).

USDA Forest Service RMRS GTR-425. 2021.                                                                                            6
is nested within a larger watershed. The exposure grid developed above was
first log10-transformed and then smoothed using focal statistics with a 10-km
radius moving window in ArcMap. The transformed exposure grid described
above was divided into roughly equal-sized mapping units (firesheds) using
an optimized version of Simple Linear Iterative Clustering (SLIC; Achanta
et al. 2012), an image segmentation algorithm based on a modified form
of K-means clustering that includes an adaptive parameter controlling the
compactness of the resulting segments. The algorithm was applied using the
OpenImageR package. Starting points for clusters were placed on a hexagon
grid, the total count of which was adjusted such that the image segments had
a mean value centered on the desired scale (e.g., 10,000 ha, 100,000 ha). To
ensure the segments from the fireshed and planning area scales were perfectly
nested, we assigned each planning area (i.e., 10,000 ha) to a parent fireshed
(i.e., 100,000 ha) based on where a majority of its area fell. Once assigned,
we reconstructed the boundaries of the larger firesheds by merging planning
areas sharing the same parent. The stands level of the hierarchy was created
by intersecting a polygon layer of 100 hectare hexagons with a land tenure
layer, which created stand polygons that represented a single ownership and
manageability status. Finally, each stand was assigned to both a planning
area and a fireshed based on where the majority of its area fell. As such, each
stand belonged to a single planning area, and each planning area belonged to
a single fireshed, with the unit area of each scale centered at the desired sizes
of 100 ha, 10,000 ha, and 100,000 ha respectively. The delineation process
resulted in 7,688 fireshed polygons for the continental United States (fig. 2),
77,112 planning areas, and 9,726,460 stands (stands ranged in size from 5 ha
to 117 ha; mean = 80 ha) (Evers et al. 2020). The average area is 101,325 ha
for the firesheds and 10,102 ha for the planning areas.
Figure 2—National map of the 7,688 firesheds created from community wildfire transmission data (Evers et al. 2020). The
fireshed boundaries were created with a process that delineates hotspots of fire transmission to buildings in adjacent or nearby
communities. See the Methods section for details on delineating firesheds.
USDA Forest Service RMRS GTR-425. 2021. 7Delineating We created community boundaries that included both core areas defined
Communities by the U.S. Census populated places data (U.S. Census Bureau 2016) and
the adjacent WUI as defined by the SILVIS Lab (2012) (Ager et al. 2019c;
Bunzel et al. 2021). The U.S. Census data identifies 28,816 settlements and
communities in the continental United States in the place names database.
These communities are identified as polygons or points and map the locations
of incorporated and unincorporated towns, cities, and settlements. To
create a map of discrete communities that included the surrounding WUI,
we aggregated the core communities in the U.S. Census Bureau data with
the SILVIS WUI. We attached SILVIS WUI polygons (SILVIS Lab 2012)
to the core communities (U.S. Census Bureau 2016) using road networks
(ESRI 2012) and minimum travel time from the community’s core to each
WUI polygon. Travel speed was used to create a cost raster that was input
into the Cost Allocation ArcGIS tool with a maximum distance equal to 45
minutes driving time. The process organized 98.3 percent of WUI polygons
into 28,816 communities, representing 300 million people and 129 million
buildings as estimated by SILVIS. For specifically delineating communities
(versus estimating exposure by WUI category), we removed SILVIS WUI
polygons that were smaller than 0.1 ha or had building density less than two
housing units per km2; thus, our definition of WUI includes lower density
census blocks than Radeloff et al. (2005) and includes no thresholds for
wildland vegetation. To create the driving time cost raster, first the North
America Detailed Streets dataset was converted to a 30-m raster using
the speed field as the value, and then reclassed so that values equaled the
number of minutes to cross the cell. This was done by reclassifying the
raster where values = 1 were converted to 10 for 4-wheel drive, and No Data
were converted to 3 for walking speed. A new raster with values of 1.11 was
created and divided by the speed raster to create the time or cost raster in
minutes. LANDFIRE Scott and Burgan fuel model data were used to correct
for water bodies. Where fuel model = 98 (water), the cost raster was set to
No Data.
Data Describing
Fireshed Conditions Stands in the registry were attributed with data compiled from numerous
public and agency geospatial data sources (table 1; Appendix A tables A1
and A2) in addition to data on exposure and communities we generated
above. A portion of the data cover all lands, whereas some information is
only available for National Forest System lands. Data are briefly summarized
below, with additional details provided in table 1 and Appendix A.
Wildfire Transmission to Developed Areas
To attribute the stand layer with building exposure, we first excluded
nonburnable pixels using the 30-m Scott and Burgan (2005) standard fuel
model grid downloaded from LANDFIRE. Specifically, we cleared from
the grid the nonburnable fuel pixels including developed areas, agricultural
or irrigated lands, open water, and bare ground. The exposure value for
each stand was calculated as the sum of the pixel values in the underlying
exposure raster. Finally, we locally adjusted the stand values so that the sum
was equal to the total exposure within the fireshed (i.e., number of exposed
USDA Forest Service RMRS GTR-425. 2021. 8buildings per year). This correction was conducted using the exposure results
from all fire ignitions within each fireshed. In this way, we preserved the
complex spatial pattern of the smoothed grid as well as the landscape-scale
contribution of highly stochastic extreme fires.
Current Conditions
Spatial and tabular data on ownership composition, wildland urban interface
area, number of communities and buildings, and fuels composition assessed
at the fireshed scale were obtained from sources listed in table 1 and
Appendix A and used to describe current fireshed conditions (fig. 3). This
information provides a context for users to assess the contribution to total
risk by different landowners and the potential for active management to
reduce wildfire impacts on developed areas.
Wildfire and Treatment History
Historical fire perimeters from MTBS (MTBS Data Access 2020) and
hazardous fuels treatment polygons from FACTS (USDA FS 2020) are
provided to describe the fireshed in terms of disturbance history (table 1;
Appendix A; fig. 4). Summary statistics on area burned and acres treated
are provided at the fireshed scale as well as the percentage of the fireshed
disturbed by type. In the interactive portal, information is available by
individual fire perimeter and individual treatment polygon.
Figure 3—Screen display of the Fireshed Registry showing current conditions in terms of ownership, fuel composition, and
buildings for Sisters, Oregon. See table 1 for information on data sources and vintages.
USDA Forest Service RMRS GTR-425. 2021. 9Figure 4—Screen display of the Fireshed Registry showing wildfire and treatment history. Users can select individual historical
fire perimeters and treatment polygons for more detailed information. Information on area burned and acres treated is
summarized for the entire selected fireshed. See table 1 for information on data sources and vintages.
Fireshed Exposure Profiles
In order to assess the effects of extreme wildfire events, we extracted
simulated wildfires that started within a given fireshed and exposed the
largest number of buildings in adjacent communities (table 1; Appendix A;
fig. 5). Communities may be located within or outside the fireshed if a fire
ignited in the fireshed and spread to adjacent areas. Total building exposure
and area burned are reported for each of these extreme events.
At the community scale, the registry reports total building exposure by
simulated fires ignited within a fireshed by community, with average
exposure across all fire season scenarios that impacted each community, and
maximum exposure from a single wildfire season (Appendix A). Building
footprints are included as a spatial layer that can be overlaid with the
smoothed exposure map described above to provide exposure at the scale of
individual buildings.
Planned Treatments
We obtained data from FACTS (USDA FS 2020) on individual national
forests that mapped future proposed treatments (2010–2019) (table 1). We
found these data for roughly half of the national forests, and thus the data are
incomplete and included for demonstration purposes.
USDA Forest Service RMRS GTR-425. 2021. 10Figure 5—Screen display of the Fireshed Registry showing the fireshed exposure profile for the Sisters, Oregon fireshed.
Users can select individual simulated fire perimeters and see building exposure and area burned by perimeter. Building
exposure by ignitions within the fireshed for the most affected communities are summarized with average and maximum
building exposure. See table 1 for information on data sources and vintages.
Prioritized Treatment Locations
We used results from a single prioritization scenario using the R version
of the scenario planning model, ForSys, to simulate a 10-year forest
management plan for the continental United States (Ager et al. 2019b). The
western and eastern United States were analyzed and prioritized separately
to eliminate scale effects. The land base was filtered to only prioritize stands
classified as conifer (west) or forested (east) based on Forest Vegetation
Simulator (Crookston and Dixon 2005) forest types. Stands were also filtered
to only include those (1) available for mechanical treatment according to
the USGS Protected Areas Database (USGS 2019) corrected with Forest
Service Roadless and Nationally Designated Areas (USDA FS 2017a,b), and
(2) undisturbed by recent wildfire and mechanical treatments, as determined
in MTBS (MTBS Data Access 2020) and FACTS (USDA FS 2020),
respectively (table 1; Appendix A).
The effect of land administration and vegetation filters was to remove 64
percent and 30 percent of the exposure to developed areas available to treat
from the western and eastern U.S. Forest Service land bases, respectively
(fig. 6) (table 2). Note that the total exposure was based on simulations
completed with the 2014 fuels data, and the removal of lands disturbed since
then by wildfire and management activities reduced the total exposure by
USDA Forest Service RMRS GTR-425. 2021. 11Figure 6—Percent of total building exposure by progressive land base filters on
national forest lands in the western and eastern United States. Each column is
a subset of the column to its left within each panel. The final columns (in green)
represent the land base filter used in the scenarios in the Fireshed Registry: conifer or
forest stands available for mechanical treatment that have not been recently disturbed
by wildfires or treatments (including wildfires as of October 2020). Note that the
treatment target only treats 6.8 percent and < 1 percent of the total exposure from all
undisturbed lands in the west and east, respectively, versus national forest lands only.
16 percent and 23 percent for west and east, respectively, resulting in the
starting amount of exposure (left bars; fig. 6). The removal of wilderness
and roadless, where only nonmechanical treatments (e.g., fire) are allowed,
reduced treatable (i.e., undisturbed stands) exposure from 100 percent to
66 percent and 82 percent for west and east, respectively. Restricting fuel
Table 2—Total area within each land base and the number of buildings exposed by ignitions within each land base considering
progressive filters that exclude more area with each filter. Note that the smallest land base was used in the scenarios
presented in this report.
National Forest only All lands
Area Exposure Area Exposure
Region Progressive land base filter (million acres) (buildings/yr) (million acres) (buildings/yr)
West All stands 145.0 5,177 954.9 24,520
Undisturbed 131.0 4,359 921.8 22,530
Undisturbed + Manageable 64.6 2,879 792.1 20,054
Undisturbed + Manageable + Conifer stands 40.3 1,542 96.1 3,970
East All stands 26.2 211 967.4 18,136
Undisturbed 22.2 163 956.7 17,927
Undisturbed + Manageable 15.6 134 919.3 17,450
Undisturbed + Manageable + Forest stands 12.9 114 281.4 5,003
USDA Forest Service RMRS GTR-425. 2021. 12management to commercial conifer (west) or forested (east) stands reduced
treatable exposure an additional 31 percent and 12 percent, leaving 35
percent and 70 percent of the estimated total for treatment in the west and
east, respectively (fig. 6). The rationale for these specific filters is discussed
below, and scenarios that assume treatments in some of these areas are part of
ongoing work (see Discussion section).
Stands within projects were prioritized based on building exposure from
fires that originated in that stand and added to each solution based on
the total amount of exposure treated. ForSys ranks project areas for each
scenario and reports building exposure treated. We assumed that treatments
will be implemented using the mix of treatment types historically used on
each national forest according to FACTS. We did not estimate reduction in
exposure, only exposure treated. Stands were treated until 80 percent of the
building exposure was treated within each planning area. This particular
scenario was simulated and included into the registry to illustrate its use to
examine future potential scenarios relative to planned activities and past
wildfire impacts. We envision a system where a linked scenario planning
model can be used to load scenarios into the registry by agency planners and
stakeholders.
Community Exposure Profiles
Our previous work focused on estimating exposure at the scale of
individual communities (Ager et al. 2019a; Ager et al. 2019c). To build a
comprehensive portal for understanding wildfire exposure, we included those
community results in the registry. In this way we provide for the assessment
of both the larger landscape source of risk and the target (community). As
part of this we included the worst five fire events in the FSim library in terms
of exposure to each community. Major land ownership and fuel types are also
provided for the area within the community boundary. Locations of Firewise
communities (table 1) are also mapped.
Geospatial Registry After organizing the above data and creating a series of tabular reports for
each fireshed, we used an ArcGIS online dashboard to provide interactive
viewing (ESRI 2019). The dashboard was organized into five main screen
tabs that tied the map display and tabular reports to five key questions: (1)
How is exposure distributed among ownerships? (2) How much of this
landscape has been burned or treated in the recent past? (3) What are the
spatial patterns of exposure to developed areas including plausible extreme
fire events? (4) Where are future management efforts planned? (5) How are
communities exposed to extreme fire events? A range of other questions can
be addressed with these data, with the intent of the questions to create a flow
for a basic fireshed assessment. In addition, a Navigator tab directs users
to select the fireshed of interest, and an Overview tab (fig. 7) summarizes
information from all elements of the registry.
USDA Forest Service RMRS GTR-425. 2021. 13Figure 7—Screen display of the Fireshed Registry showing the overview page for the Sisters, Oregon fireshed. See table 1 for
information on data sources and vintages.
Identification of We used the registry to address prioritization of forest and fuel management
Priority Firesheds investment as part of multiple agency initiatives (table 3). We first filtered the
stands as described in the Prioritized Treatment Location section to remove
areas that are unlikely or infeasible to receive active forest management.1
Then we further filtered the stands to select only Forest Service stands. The
7,688 firesheds were then ranked using a scenario planning model (Ager et
al., in review) based on predicted building exposure from ignitions on Forest
Service lands within the fireshed. The top 10 firesheds for each region were
identified and loaded into the simplified companion “fireshed investment
portal” for use by the field units. This portal displayed estimated total
building exposure by landowner and building exposure from USFS-managed
stands. In addition, the planning areas (~10,000 hectares) within these
firesheds were also ranked by building exposure and included in the portal.
1
Initial scenario runs to identify the top 10 priority firesheds by region filtered stands
based on NLCD (USGS 2011) definitions of forested vs. nonforested rather than FVS
forest type as described in the Prioritized Treatment Location section.
USDA Forest Service RMRS GTR-425. 2021. 14Table 3—Application of the Fireshed Registry for prioritization to inform agency initiatives and reporting requests.
Application Description Citation
USDA Forest Service National Investment A multiyear, focused investment in large, USDA FS (2018)
Strategy for Reducing Fire Risk cross-boundary critical landscapes for fire
risk reduction.
Response to Executive Order 13855, Requires identification of DOI- and USDA Executive Order 13855 of Dec. 21,
“Promoting Active Management of FS-administered lands where there is 2018 (Federal Register 2018)
America’s Forests, Rangelands, and a high probability that wildfires would
Other Federal Lands to Improve threaten people, structures, or other high-
Conditions and Reduce Wildfire Risk” value assets.
FY2021 Hazardous Fuels Allocation The Forest Service anticipates allocating USDA FS (2018)
up to $1 million for priority projects
including risk-based hazardous fuels and
fire management.
Development of USDA FS Shared The USDA FS Shared Stewardship USDA FS (2018)
Stewardship Performance Metrics Performance Framework includes
identifying specific indicators related to
wildfire risk reduction in priority firesheds.
Prioritization of USDA Forest Service FY2021 project proposal evaluation USDA FS (2019)
and NRCS Joint Chiefs’ Restoration criteria include a wildfire risk reduction
Partnership Projects objective.
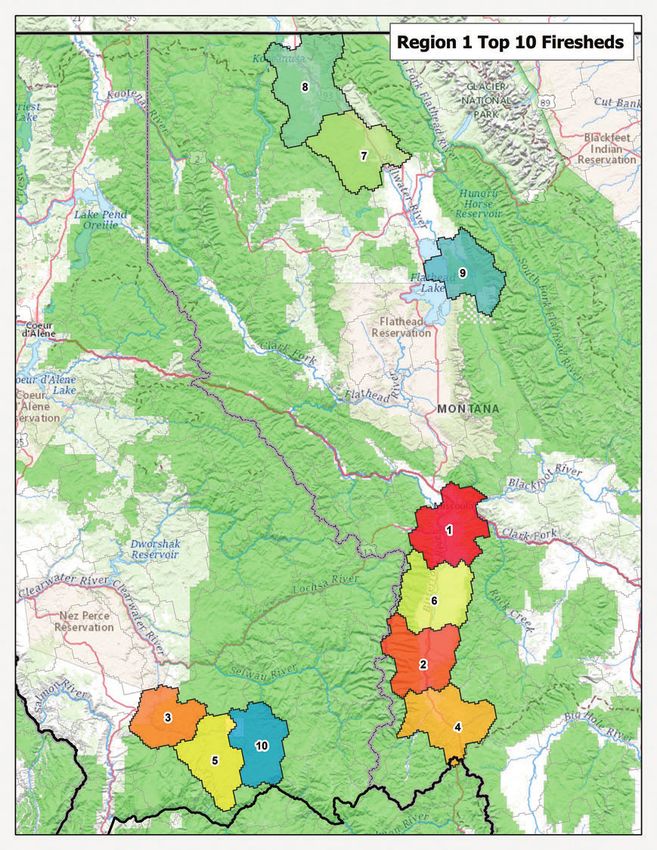
USDA Forest Service RMRS GTR-425. 2021. 15Application
Fiscal Year 2021 In 2020, the Forest Service initiated a multiyear national investment strategy
National Fuels to target fuel management funding to reduce risk to developed areas. The
Investment Strategy plan specifically earmarked about $5.1 million in hazardous fuels funding in
the initial allocation to two priority firesheds. The plan included a provision
that as additional funding became available during FY2021, additional
priority firesheds will be identified. For this initiative, the registry was
used to identify the top 10 firesheds in each Forest Service region that were
predicted to contribute to the highest level of building exposure originating
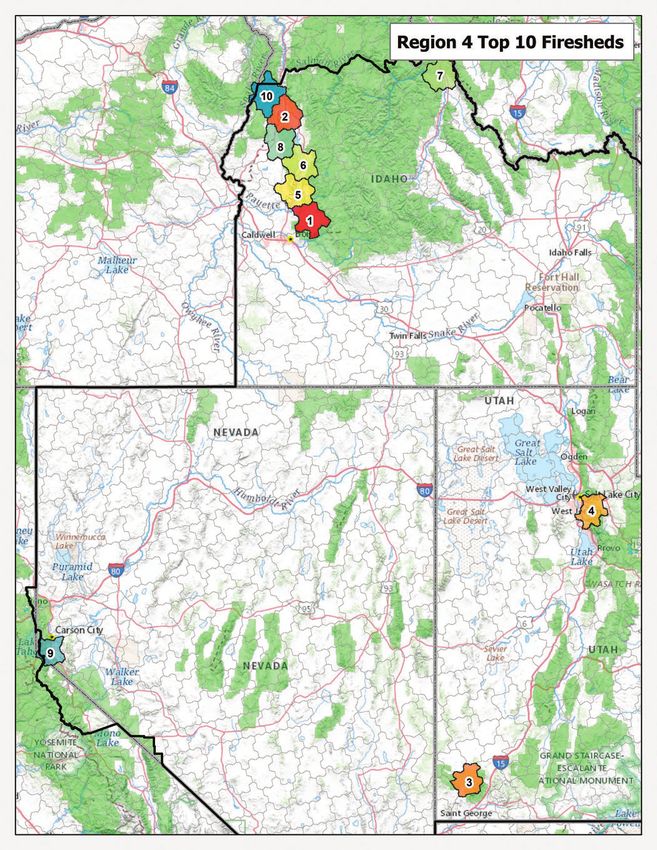
from lands available for active forest and fuels management (fig. 8). Ten
priority firesheds in each Forest Service Region accounted for between 3
percent and 53 percent of the total exposure within the western or eastern
United States (based on stands available for treatment). Spatial data including
priority fireshed boundaries, exposure estimates, and related information
Figure 8—Map of CONUS showing the top 10 firesheds in each Forest Service Region identified for a multiyear national
investment strategy to target fuel management funding to reduce risk to developed areas (table 2). Firesheds were identified
based on wildfires igniting on forested national forest land available for mechanical treatments (e.g., excludes wilderness) and
exposing buildings in adjacent communities. See Appendix B for higher resolution maps by region.
USDA Forest Service RMRS GTR-425. 2021. 16were loaded into the Fireshed Investment Portal (fig. 9) to provide regions
with a simplified online viewing system to review the results. The use of
both portals (Registry and Investment Portal) facilitated downscaling and
interpreting the prioritization results in terms of where and how much
treatment was recommended to the eight regions and 112 national forests.
Executive Order (EO) Data from the registry were used in response to the December 2018
Executive Order (EO) 13855, “Promoting Active Management of America’s
13855
Forests, Rangelands, and Other Federal Lands to Improve Conditions and
Reduce Wildfire Risk, Section 5 Wildfire Strategy” subsection. Subsection
5(b)(i) requires the USDA Forest Service and the Department of Interior
(DOI) to: “Identify DOI- and USDA FS-administered lands with the highest
probability of catastrophic wildfires, as well as areas on those lands where
there is a high probability that wildfires would threaten people, structures, or
other high-value assets, in order to direct and prioritize actions to meet land
management goals and to protect communities” (Federal Register 2018).
Data in the registry on fire transmission to buildings originating on national
forests and DOI lands were summarized into five levels of exposure and used
to generate a series of map products that were included in the response to the
EO. The results of this assessment predicted 8,475 buildings are potentially
exposed annually by ignitions on DOI and Forest Service administered
lands. The highest 40 percent of building exposure originated from simulated
wildfires ignited on a mere 1 percent of Forest Service and DOI administered
lands (2,853,455 acres). The latter land base accounted for 3,389 buildings
Figure 9—Forest Service Fireshed Investment Portal ArcGIS Online dashboard for viewing priority firesheds based on Forest
Service forested stands available for mechanical treatment and not recently disturbed by wildfire or mechanical treatments.
USDA Forest Service RMRS GTR-425. 2021. 17exposed per year (table 2). High exposure areas were distributed across the
United States with concentrations in southern California, central Arizona, and
Washington (fig. 10). Scattered locations of high exposure were predicted
throughout the West, as well as in western Virginia and Florida. Pockets of
moderate exposure were mostly concentrated in the 11 western U.S. States.
The lowest 15 percent of total exposure was predicted on 87 percent of the
land base (313,565,960 acres) and was classified into the very low and low
exposure categories (table 4). Within these categories an estimated 847
buildings are exposed per year.
Scenarios for As stated in the wildland fire section of the 2018 Omnibus bill, “despite more
Revision of the than $5,000,000,000 in investments in hazardous fuels mitigation since the
National Fire Plan development of the National Fire Plan following the 2000 fire season, the
[Forest Service] has not been able to keep pace with the challenges caused
by previous management decisions, a changing climate, ever-increasing
costs, and an expanding wildland urban interface, all of which exacerbate the
risk of catastrophic wildfire. The Committees direct the [Forest Service] to
work with the Office of Management and Budget and the Department of the
Interior, as well as other relevant agencies, to review and update the National
Fire Plan, as needed” (U.S. House of Representatives 2018 pages 1174–75).
Figure 10—Department of Interior and Forest Service administered lands where fires have the potential to ignite and spread to
communities and expose buildings by exposure class. See table 4 for details on each building exposure class. Map developed
from data in the registry in response to December 2018 Executive Order (EO) 13855.
USDA Forest Service RMRS GTR-425. 2021. 18Table 4—Total area by agency where wildfires potentially ignite, spread, and expose buildings; and total number of buildings
exposed.
Percentage (%) of agency area
Number of buildings exposed Total area where wildfires ignite that is mapped to spread fires
Agency by agency ignitions (per year) and expose buildings (acres)1 to buildings2
USFS 5,455 165,143,337 89
BLM 1,724 119,230,768 71
BIA 1,003 52,335,036 77
NPS 159 16,057,149 54
FWS 95 8,210,695 55
USBR 38 1,337,688 56
1
Total area for all Forest Service and DOI lands (CONUS) is 469,318,394 acres.
2
For example, 89 percent of all Forest Service lands have the potential for wildfires to ignite and spread to communities and expose buildings.
The Forest Service, in partnership with other agencies, recently initiated a
revision to the 2000 Fire Plan, which included discussions on the feasibility
of substantially accelerating fuels treatment from the current levels and
potentially refocusing treatments to target wildfire transmission to developed
areas.
As part of this effort, we used spatial and other data in the registry to develop
a 10-year period of accelerated fuel management and investigated to what
extent a national investment in hazardous fuels treatments can address
community exposure from national forests given current management and
fire regimes. Details of the scenario modeling are reported elsewhere (Ager et
al., in review). We analyzed the scenario and its performance in terms of the
rate at which the areas of high fire transmission are treated, the space-time
scheduling dynamics among and within the 76 national forests in the western
U.S., and the potential for future wildfire to alter the prioritization schedule
during implementation (fig. 11). The plan treated 16.3 million acres in the
western United States in 3,475 projects reducing building exposure from
ignitions on national forest lands by 77 percent when considering exposure
on conifer stands available for mechanical treatments. Building exposure
treated relative to all national forest lands was 36 percent. We also examined
the overlap between predicted wildfire events and treatments over time. The
methods and results provide the agency with a strategic capacity to use both
the registry and scenario planning models (Ager et al., in review; Ager et al.
2019b) to conduct fuel management planning by leveraging new technology
and models to the problem of wildfire risk to developed areas.
USDA Forest Service RMRS GTR-425. 2021. 19Figure 11— Map of 10-year national forest treatment plan in the western United States with Fireshed Registry project areas
symbolized by treatment year with highest priority projects implemented in year 2. Year 1 is reserved for planning. Projects
were prioritized to treat 80 percent of the wildfire exposure originating in each planning area on national forest lands available
for mechanical treatments (e.g., excludes wilderness) and with conifer stands. Area treated is increased over the 10-year
period. Note that entire planning areas are symbolized and not just area treated. Figure modified from Ager et al. (in review).
Performance The Shared Stewardship initiative was established in FY2019 to forge a
Metrics for Shared network of cross-boundary collaborations between state and federal lands
Stewardship throughout the country (USDA FS 2018). The National Shared Stewardship
performance team was subsequently tasked with developing a framework for
performance evaluation for three specific elements of the Shared Stewardship
program: wildfire risk reduction, generation of co-benefits (e.g., water quality
improvement), and partnership capacity. The framework includes: (1) pilot
projects in multiple States that represent the goals in Shared Stewardship
memorandums of understanding (MOU), and (2) focused efforts to support
agency investment in priority firesheds. The process is making use of the
registry as an accounting framework for reporting wildfire risk reduction in
priority firesheds as mapped and attributed in the registry. Specific indicators
will be developed for FY2021 implementation to assess if and how our
investments are causing significant reduction in wildfire risk in identified
high-priority landscapes.
USDA Forest Service RMRS GTR-425. 2021. 20Although work is underway to develop specific performance metrics,
multiple metrics specific to landscape condition reported in the registry are
being considered in the Shared Stewardship Performance Framework. Some
metrics of potential use include:
(1) change in area of predicted high severity fire in the fireshed;
(2) change in predicted wildfire risk to high-value resources;
(3) change in predicted wildfire transmission to communities; and/or
(4) change in an index related to water, carbon, or other ecosystem
services.
Prioritization The USDA Forest Service and NRCS Joint Chiefs’ Restoration Partnership
projects are designed to improve the health and resiliency of forest and
of Restoration
rangeland ecosystems, while benefiting local communities. Projects leverage
Partnership Projects technical and financial resources between agencies and with Forest Service
partners to complete on-the-ground accomplishments across jurisdictional
boundaries. Successful projects utilize this program to focus investment by
both agencies within a 3-year-long period and to coordinate and accelerate
efforts within a shared landscape. The spatial and timing linkages of these
projects enable cumulative impacts to be more beneficial and efficient. For
FY2021, one of the criteria for project proposal evaluation, scoring, and
selection is that proposals that include a wildfire risk reduction objective
should describe the cross-boundary or community planning efforts used to
prioritize the work (e.g., fireshed analysis, risk assessments).
Proposals for funding in FY2021 were required to include, at minimum, a
combination of activities on private and public land. The Fireshed Registry
and fireshed boundaries were used in the development of proposals,
specifically to align state-level priority firesheds based on community
wildfire transmission from ignitions on Forest Service forested lands that are
available for mechanical treatments.
Evaluating Congress created the Collaborative Forest Landscape Restoration Program
(CFLRP) in 2009 to support large-scale forest restoration and benefit local
Collaborative Forest
communities through collaborative approaches. CFLRP has proven to be
Landscape Restoration an effective tool for improving forest conditions, growing rural economies,
Program Proposals and leveraging partner investments to improve the quality and scale of our
work. Congress reauthorized CFLRP in the 2018 Farm Bill, doubling the
authorized funding level to $80 million per year and creating the opportunity
for new CFLRP projects. The Farm Bill also provides an opportunity for
current CFLRP projects funded for 10 years to apply for an extension waiver
to complete implementation.
In FY2020, fireshed boundaries were integrated into the CFLRP mapping
portal, thus allowing national CFLRP staff to analyze how CFLRP
prospective projects aligned with priority firesheds identified in the Fireshed
Registry. The registry is being used by national CFLRP staff to help integrate
priorities established in the registry with future proposed CFLRP projects.
USDA Forest Service RMRS GTR-425. 2021. 21Additional Regions, Forests, and staff at the national level used the Fireshed Investment
Applications of the Portal and the registry in a number of prioritization discussions and decisions
Fireshed Registry for FY2021 (table 3). The portals were also used for the purpose of validation
with local priorities identified in regional assessments, and national priorities
identified in the modeled scenarios. Some of these were part of the annual
budget process and others were one-time special programs or requests
(table 3).
USDA Forest Service RMRS GTR-425. 2021. 22Discussion
The Fireshed Registry was created to advance spatial planning to manage
wildfire risk to communities from both national forests and other state,
federal, and private lands. The registry is a unique geospatial planning
framework that stiches together a time window of information—past, present,
and future scenarios—to describe risk trajectories on lands where destructive
wildfires are likely to originate. The geospatial dashboard coupled with
scenario planning models and investment portals creates a flexible system
where each component can stand on its own or be used as an interlinked
system to build and test management scenarios (fig. 12). The fireshed
delineation organized spatial variation in areas that contribute (i.e., via
wildfire spread) risk to communities into a hierarchical system of geographic
units, similar to the hydrologic unit classification (USGS and USDA-NRCS
2013). The registry weaves together many different spatial data to provide a
time portrait of land conditions, recent wildfire activity, simulated wildfires,
exposure to communities, and treatment scenarios derived from 5- to 10-year
action plans and the Scenario Investment Planning Platform.
While the registry was organized around fire risk to developed areas, the
framework does not preclude integrated assessment of other resource
management priorities such as protecting water, wildlife habitat, and
recreation opportunities. The all-lands geography of the Fireshed Registry
makes it a useful platform for planning cross-boundary, large-scale
restoration projects as part of Shared Stewardship and the Collaborative
Forest Restoration Program. In practice, coordinated cross-boundary efforts
will be required to significantly reduce wildfire transmission in many
planning areas. Cross-boundary forest and fuel management is facilitated
Figure 12—The Fireshed Registry (left) is a geospatial dashboard built to organize information about wildfire transmission to
communities and monitor progress towards risk reduction from management investments. Scenario planning models use data
from the registry to develop investment scenarios (middle), which are then loaded into a simple investment portal for viewing
and review by field units.
USDA Forest Service RMRS GTR-425. 2021. 23by newer agency initiatives that have created a cross-boundary authorizing
environment (USDA FS 2018). Heretofore, a national-scale system to
organize landscape fire risk to developed areas does not exist as it does
for other forest disturbance and ecological conditions (e.g., Land Type
Associations, Ecological Units, and the Terrestrial Condition Assessment,
or Hydrological Unit Codes and the Watershed Condition Framework)
(Cleland et al. 2017; Omernik and Griffith 2014; USDA FS 2011). Moreover,
the framework provides a foundation for communication and coordination
with external agencies and partners and for national-scale reporting and
monitoring of outcome-based performance measures related to community
risk.
Wildfire risk to developed areas has received substantial attention from the
research community. Researchers have developed various schemata to define
and map the WUI (Bento-Goncalves and Vieira 2020; Lampin-Maillet et al.
2010; Modugno et al. 2016; Radeloff et al. 2005) and assess fire hazard in
relation to biophysical factors and social vulnerability (Adams and Charnley
2018; Carroll and Paveglio 2016; Evers et al. 2019; Paveglio et al. 2015;
Wigtil et al. 2016). However, most existing WUI classification schemes rely
solely on in-situ factors such as structure location and surrounding vegetation
cover (but see Price and Bradstock 2013) for measuring wildfire risk (Bar
Massada et al. 2009; Bento-Goncalves and Vieira 2020; Chas-Amil et al.
2013; Lampin-Maillet et al. 2010). Prior efforts have focused on in-situ risk
with risk assessments, while we have focused on identifying the source of
risk. This approach allowed us to target the problem of prioritizing large
areas of wildlands that are the source of fire to developed areas, rather than
focusing on individual communities as has been the emphasis of many
existing programs (Scott et al. 2020).
We also transcended typical risk assessments by describing potential extreme
events in each fireshed, rather than average risk metrics. This is the first
use of extreme event scenarios in a fire risk application and overcomes the
limitations of contemporary risk maps (Dillon 2015; Scott et al. 2013) that
show pixel-scale average burn probabilities and exposure levels averaged
over thousands of fire seasons. The fireshed framework is more efficient for
land management agencies to organize variation in wildfire transmission
to communities. For instance, firesheds and project areas expose multiple
communities to wildfire (fig. 13).
One appealing feature of firesheds is they facilitate efficient investment in
hazardous fuels treatments. While the Forest Service has invested billions of
dollars in hazardous fuels reduction and other active management activities
for two decades, the cost of fire suppression continues to rise steeply
(U.S. House of Representatives 2018). Longer fire seasons and the rising
size and severity of wildfires, along with expanding risk to communities,
natural resources, and the safety of firefighters, are of concern to all land
management agencies. Since 2018, the agency has been especially focused
on leveraging partnerships and collective efforts to address these concerns
and manage Forest Service lands differently. Building on this Shared
USDA Forest Service RMRS GTR-425. 2021. 24You can also read