Developing a reproducible protocol for culturing functional confluent monolayers of differentiated equine oviduct epithelial cells
←
→
Page content transcription
If your browser does not render page correctly, please read the page content below
Biology of Reproduction, 2022, 106(4), 710–729
https://doi.org/10.1093/biolre/ioab243
Advance access publication date 28 December 2021
Research Article

Developing a reproducible protocol for culturing functional
confluent monolayers of differentiated equine oviduct
epithelial cells†
Bart Leemans1 ,2 , Elizabeth G. Bromfield3 ,4 , Tom A.E. Stout2 , Mabel Vos2 , Hanna Van Der Ham2 ,
Ramada Van Beek2 , Ann Van Soom1 , Bart M. Gadella1 ,3 ,5 ,* and Heiko Henning5

                                                                                                                                                                Downloaded from https://academic.oup.com/biolreprod/article/106/4/710/6485188 by guest on 24 June 2022
1 Department   of Reproduction, Obstetrics and Herd Health, Faculty of Veterinary Medicine, Ghent University, Ghent, Belgium
2 Department   of Clinical Sciences, Utrecht University, Utrecht, The Netherlands
3 Biomolecular Health Sciences, Utrecht University, Utrecht, The Netherlands
4 Priority Research Centre for Reproductive Science, Faculty of Science, University of Newcastle, Newcastle, Australia
5 Population Health Sciences, Faculty of Veterinary Medicine, Utrecht University, Utrecht, The Netherlands

*Correspondence: Yalelaan 7, 3584 CM Utrecht, The Netherlands. E-mail: b.m.gadella@uu.nl
† Grant Support: This study was supported by the Research Foundation – Flanders (FWO-Flanders; grant number 12I0517N) and EU COST Action 16119 CellFit.

Abstract
We describe the development of two methods for obtaining confluent monolayers of polarized, differentiated equine oviduct epithelial cells
(EOEC) in Transwell inserts and microfluidic chips. EOECs from the ampulla were isolated post-mortem and seeded either (1) directly onto
a microporous membrane as differentiated EOECs (direct seeding protocol) or (2) first cultured to a confluent de-differentiated monolayer in
conventional wells, then trypsinized and seeded onto a microporous membrane (re-differentiation protocol). Maintenance or induction of EOEC
differentiation in these systems was achieved by air–liquid interface introduction. Monolayers cultured via both protocols were characterized by
columnar, cytokeratin 19-positive EOECs in Transwell inserts. However, only the re-differentiation protocol could be transferred successfully to the
microfluidic chips. Integrity of the monolayers was confirmed by transepithelial resistance measurements, tracer flux, and the demonstration
of an intimate network of tight junctions. Using the direct protocol, 28% of EOECs showed secondary cilia at the apical surface in a diffuse
pattern. In contrast, re-differentiated polarized EOECs rarely showed secondary cilia in either culture system (>90% of the monolayers showed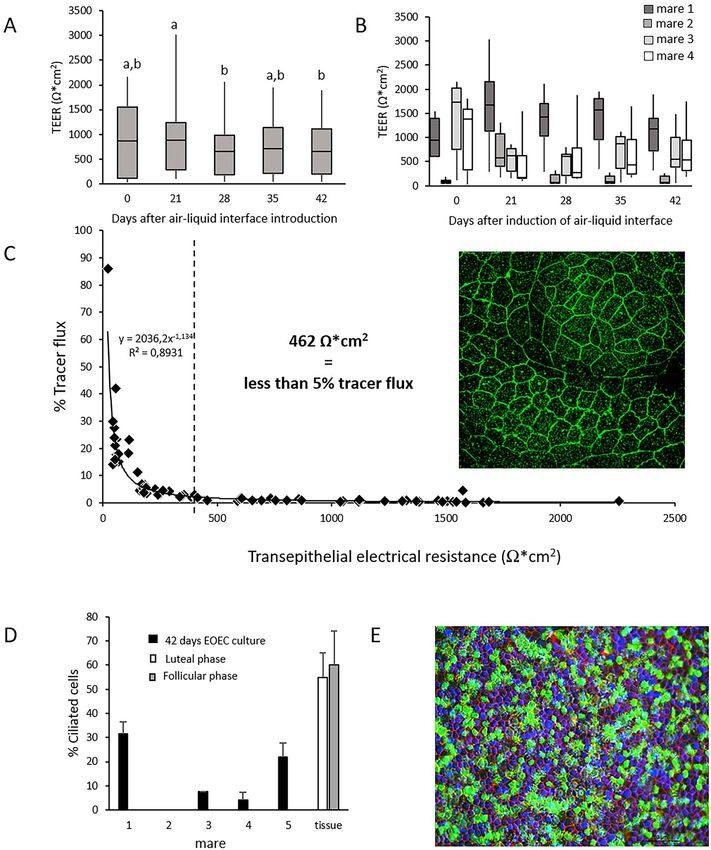
B. Leemans et al., 2022, Vol. 106, No. 4                                                                                       711

an epithelium with two major populations of highly polarized       Materials and methods
columnar cells, namely ciliated and secretory (non-ciliated)       Ethical Statement
cells [12]. The ciliated cells play a role in gamete transport     The study was approved by the Ethical Committees of
and sperm-binding and, in most species, predominate in the         the Faculty of Veterinary Medicine of Ghent University
isthmus [13, 14]. The secretory cells, that predominate in the     (EC2013/175 and EC2013/176) and experiments were carried
ampulla, produce oviductal fluid [15]. However, an inversed        out as approved by the Ethical Committee of the Faculty of
predominance of ciliated versus non-ciliated cells has been        Veterinary Medicine of Utrecht University.
reported in the respective oviductal segments of the horse
[16]. When spermatozoa arrive in the oviduct, they bind to
oviduct epithelial cells (OECs) in the isthmus, an interaction     Chemicals and reagents
that prolongs their lifespan. Sperm are stored in this “sperm      Alexa Fluor 488 conjugated goat-anti-mouse antibodies and
reservoir” until the time is right to detach and undergo capaci-   phalloidin-Alexa Fluor 568 were obtained from Invitrogen
tation (maturation) in preparation for fertilization [15]. Once    (Landsmeer, The Netherlands). Normal goat serum was pur-
released, the spermatozoa migrate to the ampulla and bind          chased from Genway (San Diego, USA). Vectashield was

                                                                                                                                      Downloaded from https://academic.oup.com/biolreprod/article/106/4/710/6485188 by guest on 24 June 2022
to the zona pellucida [7, 8]. However, the success of direct       obtained from Vector Laboratories (Peterborough, UK). Tri-
oviductal insemination via the infundibulum [10] suggests          ton X-100 and all other chemicals not otherwise specified
that the ampulla of the oviduct is able to support capacitation    were obtained from Sigma-Aldrich (Zwijndrecht, The Nether-
and fertilization in the horse.                                    lands).
   In vivo studies of the role of the equine oviduct in capac-
itation and fertilization are unrealistic because they would       Animals
require invasive surgery or laparoscopy to access the mare’s
                                                                   Oviducts were collected at a local slaughterhouse within
oviduct. To examine how the oviduct supports equine sperm
                                                                   30 min after the slaughter of healthy Warmblood mares aged
capacitation and fertilization it is, therefore, desirable to
                                                                   between 5 and 22 years, and without any visible reproductive
establish a representative in vitro oviduct model. Previous
                                                                   tract pathologies. Oviducts from mares with one or more large
studies have largely focused on non-polarized monolayers of
                                                                   follicles and no corpus luteum in the ovaries were considered
de-differentiated OECs [17, 18] and oviduct explant cultures
                                                                   to be from the follicular phase, whereas oviducts from mares
[19]. Unfortunately, neither of these systems was able to
                                                                   with a corpus luteum in combination with small or large
support equine IVF. Despite this shortcoming, an oviduct
                                                                   follicles on the ovaries were considered to be from the luteal
explant model did help to identify physiological conditions
                                                                   phase.
triggering three critical hallmarks of stallion sperm capaci-
tation, namely increased intracellular pH [20, 21], protein
tyrosine phosphorylation in the sperm tail [20, 21, 22], and       Harvesting EOECs
hyperactivated motility [22]. However, neither the acrosome        After collection, oviducts were transported within 2 h to the
reaction nor the fertilization could be induced using oviduct      laboratory, on ice, in cold Dulbecco Phosphate Buffered Saline
explants. In order to improve in vitro oviduct cell cultures       (PBS; 0.9 mM CaCl2 , 2.68 mM KCl, 1.47 mM KH2 PO4 ,
in terms of phenotype and functionality, we and others have        0.5 mM MgCl2 , 137 mM NaCl, 8.1 mM Na2 HPO4 ; pH:
recently developed more advanced cell culture models for           7.30, osmolality 300 ± 10 mOsmol/kg; Gibco BRL, Paisley,
OECs from the mouse, pig and cow [23, 24, 25]. A monolayer         UK) supplemented with 50 μg/mL gentamycin, 100 U/mL
of polarized, differentiated OECs was induced by the intro-        penicillin, and 100 μg/mL of streptomycin.
duction of an air–liquid interface [23]. Moreover, in vivo-like       Upon arrival at the lab, oviducts were dissected free of sur-
functionality of these monolayers could be stimulated by cycle     rounding tissue, straightened as much as possible, and washed
stage-specific concentrations of ovarian steroid hormones [26,     three times in cold calcium- and magnesium-free PBS (Gibco
27, 25].                                                           BRL, Paisley, UK) supplemented with 50 μg/mL gentamycin,
   In an attempt to develop an oviduct model to study equine       100 U/mL penicillin, and 100 μg/mL of streptomycin (antibi-
in vitro capacitation and fertilization, this study aimed to       otic supplemented calcium- and magnesium-free PBS). In the
establish an advanced in vivo-like equine OEC (EOEC)               first experiment, three different EOEC isolation techniques
monolayer using EOECs originating from the ampulla. We             were compared. To standardize the amount of tissue used for
further investigated whether the optimal starting material         cell isolation, each oviduct was first divided into ampullary
was (1) differentiated, polarized or (2) undifferentiated, non-    and isthmic segments of equal length (5 cm each). EOECs
polarized EOECs. We evaluated two different approaches to          were isolated by either (1) oviduct flushing, (2) mechanical
colonizing the porous membrane of hanging Transwell inserts,       isolation, or (3) enzymatic digestion. For oviduct flushing, the
and examined whether the EOEC monolayers established by            lumen of the oviduct segments was flushed three times into
the two approaches showed in vivo-like cell characteristics.       a small petri dish (3.5 cm diameter) using 400 μL antibi-
Cell morphology, cell polarization (cell height and primary        otic supplemented calcium- and magnesium-free PBS. Any
cilia), monolayer confluency, and the ratio of EOECs with          remaining fluid was then gently massaged out of the oviduct
secondary cilia to non-ciliated EOECs were used as criteria.       segments. An equal volume of HEPES buffered Medium 199
Next, the protocol best supporting rapid EOEC adhesion to          (Gibco BRL, Paisley, UK) containing 50 μg/mL gentamycin,
the microporous membrane, and confluent monolayer for-             100 units/mL penicillin, 100 μg/mL streptomycin, and 20%
mation after EOEC seeding, was transferred to a microfluidic       Fetal Bovine Serum (FBS; South American origin, S1141,
chip. Finally, the functionality of the re-differentiated EOEC     Greiner Bio-one, Alphen aan den Rijn, The Netherlands)
monolayers was assessed by evaluating the effect of cycle          (antibiotic supplemented M199 + 20% FBS) was added to
stage-specific hormones on nuclear progesterone receptor           the cell suspension. After flushing, the segments were used
expression and the capacity for binding stallion spermatozoa.      for mechanical isolation of cells. For mechanical isolation,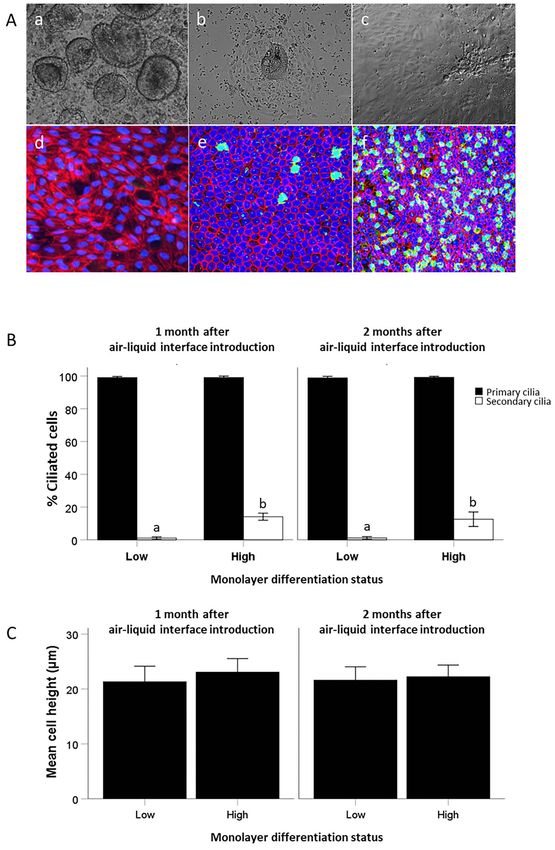
712                                                                 Polarized equine oviduct epithelial model, 2022, Vol. 106, No. 4

ampullary segments were opened longitudinally inside a ster-       culture medium). During these 24 h, the EOECs arranged
ile flow cabinet, and the mucosa was scraped using the             themselves into floating vesicles with outward facing, actively
blunt side of a sterile scalpel blade. The blade was rinsed        beating cilia, whereas contaminating (mesodermal) fibroblast
in antibiotic supplemented M199 + 20% FBS. By contrast,            cells attached to the surface of the polystyrene 6-well plates.
cells were massaged out of isthmus segments by squeezing the       The oviduct epithelial vesicles were subsequently collected,
segment tightly with a dissecting forceps that was advanced        centrifuged at 200 × g for 5 min at 25 ◦ C, resuspended in
from one end to the other. Droplets containing cells were          DMEM +10% FBS culture medium and pipetted up and
suspended in ∼2 mL antibiotic supplemented M199 + 20%              down several times to mechanically separate the cells. The
FBS. For enzymatic isolation, oviduct segments were first          culture medium was adapted from previous publications [17,
flushed three times with 400 μL antibiotic supplemented            28, 29].
calcium- and magnesium-free PBS. Next, the segment was                Next, EOECs were seeded at a concentration of 0.5 × 10⁶
filled with 0.5% Trypsin/0.2% ethylene-diamine-tetra-acetic        EOECs per cm2 onto the microporous membrane of hang-
acid (EDTA; w:v) in PBS and sealed with clamps at each             ing Transwell inserts (CLS3413, polycarbonate membrane,
end. The tissue pieces were then incubated for 30 min at           0.4 μm pore diameter, apical–basolateral compartment vol-

                                                                                                                                       Downloaded from https://academic.oup.com/biolreprod/article/106/4/710/6485188 by guest on 24 June 2022
37 ◦ C in antibiotic supplemented calcium- and magnesium-          ume: 200–800 μL; Costar, Corning, USA) or into microflu-
free PBS. After incubation, cells were expelled by massaging       idic “chips” (10 001 556, polycarbonate membrane, 0.4 μm
the oviduct segments with tightly closed dissecting forceps.       pore diameter, apical–basolateral compartment volume: 75–
Drops containing cells were collected in antibiotic supple-        110 μL; microfluidic ChipShop GmbH, Jena, Germany). Two
mented M199 + 20% FBS. The recovered cells were collected          different approaches to establishing a confluent monolayer
separately for each animal in centrifugation tubes. The tubes      of polarized, differentiated EOECs were compared. (1) A
were centrifuged (5 min, 300 × g) at room temperature and          direct seeding protocol (Figure 1A) in which oviduct epithelial
the supernatant was discarded. The pellet from each tube           vesicles were directly seeded onto the porous membrane of
was suspended in 1 mL M199 supplemented with 10 ng/mL              the hanging Transwell inserts (0.2 x 10⁶ EOECs per insert).
epidermal growth factor, 5 μg/mL insulin, 5 μg/mL apo-             Four days after seeding, EOECs were attached to the mem-
transferrin, 50 μg/mL gentamycin, 100 U/mL of penicillin,          brane and had formed a confluent monolayer of differentiated
and 100 μg/mL of streptomycin, 1 μg/mL amphotericin B,             and non-differentiated, i.e., freshly divided, EOECs. At this
and 10% FBS (M199 + 10% FBS culture medium). After                 point, an air–liquid interface was introduced, by removing
thorough mixing by pipetting, an aliquot from the cell suspen-     the medium in the apical compartment, in order to maintain
sion was removed to assess cell concentration and viability.       the differentiated status of plated, non-divided EOECs and
Cell concentration was determined using a hemocytometer            support differentiation of proliferating EOECs. (2) A re-
chamber. For viability assessment, the cell suspension was         differentiation protocol (Figure 1B) in which de-differentiated
incubated with trypan blue solution (0.4% in 0.85% saline;         EOECs were used to establish a monolayer in hanging Tran-
Gibco BRL, Paisley, UK) at a ratio of 1:1 (v:v) for 4 min at       swell inserts or on the membrane of microfluidic chips. In
room temperature. At least 100 cells from the isthmus and          this re-differentiation protocol, the oviduct epithelial vesicles
200 cells from the ampulla preparations were assessed. Cells       were first incubated in DMEM + 10% FBS culture medium
stained blue were considered to be dead, whereas white to          for 10 days to allow attachment of the EOECs to the bottom
gray cells were considered alive. For all following experiments,   of a 6-well plate and the formation of de-differentiated EOEC
EOECs were isolated by scraping the ampullary oviductal            monolayers. After 10 days, the de-differentiated EOEC mono-
mucosa.                                                            layers were detached using 0.25% Trypsin/0.1% EDTA (w:v)
                                                                   in PBS. After a 10–15 min incubation at 38 ◦ C in an incubator
Short-term culture of EOECs                                        with a rocking platform, trypsin activity was blocked by
EOECs recovered from ampullary segments were cultured              adding antibiotic supplemented M199 + 20% FBS medium;
on 12 mm round glass coverslips (Menzel Glaeser, Braun-            the detached EOECs were then washed by centrifugation-
schweig, Germany) in 24 well plates at 37 ◦ C in a humidified      resuspension in this medium (200 × g, 5 min). The de-
atmosphere of 5% CO2 -in-air. The M199 + 10% FBS culture           differentiated EOECs were then seeded onto hanging Tran-
medium was renewed twice a week. After 10 days, EOECs              swell inserts or microfluidic chips in DMEM + 10% FBS
were fixed in 1% paraformaldehyde for 10 min at room               culture medium at a concentration of 0.5 × 10⁶ EOECs per
temperature. Fixed cells were stored in PBS at 4◦ C until          cm2 . Each insert or chip was seeded with EOECs from a single
further processing.                                                mare. The volume of culture medium in the Transwells was
                                                                   800 μL in the basal section and 200 μL in the apical part.
Long-term EOEC culture                                             Culture medium in the basal compartment of the microfluidic
For these experiments, EOECs were harvested by scraping the        chips was refreshed twice during the first 2 days. In both
mucosa of oviduct ampullae. The recovered cell suspension          systems, an air–liquid interface was introduced 3 days (chip)
was then diluted in antibiotic-supplemented M199 + 20%             or 4 days (insert) after seeding, by removing the culture
FBS. Cells were washed twice by centrifugation at 200 × g          medium from the apical compartment. This was done to
for 5 min at 25 ◦ C in the latter medium. The cells were           stimulate re-differentiation of the confluent monolayers of
then cultured for 24 h in 6-well plates (Greiner Bio-one,          EOECs. Any culture medium leaking from the basal to the
Alphen aan den Rijn, The Netherlands) in DMEM/Ham’s F12            apical compartment was removed daily until full membrane
medium (DMEM/F-12 Glutamax I; Gibco BRL, Paisley, UK)              confluency was achieved (∼5–7 days after air–liquid inter-
supplemented with 10% (v/v) FBS, 50 μg/mL gentamycin,              face introduction, Figure 1B). All cell culture systems were
100 U/mL penicillin, 100 μg/mL streptomycin, 10 ng/mL              incubated in a humidified atmosphere of 5% CO2 -in-air at
epidermal growth factor, 5 μg/mL insulin, 5 μg/mL apo-             38 ◦ C for up to 60 days after introduction of the air–liquid
transferrin, and 1 μg/mL amphotericin B (DMEM +10% FBS             interface. The culture medium in the basal compartment of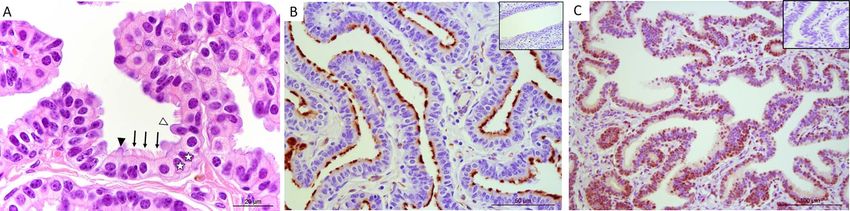
B. Leemans et al., 2022, Vol. 106, No. 4                                                                                       713

the Transwell insert system was completely refreshed twice a       exposed EOEC monolayers (see below) were stained, after
week. In contrast, dynamic medium refreshment of the basal         fixation and paraffin-embedding, for nuclear progesterone
compartment of the microfluidic chips was started 3 days after     receptor expression using a similar protocol.
cell seeding using a Programmable Aladdin Syringe Pump                Brightfield images were taken using an Olympus BX60
(World Precision Instruments GmbH, Friedberg, Germany)             microscope at magnifications of 200x, 400x, and 1000x. At
and a constant microfluidic perfusion rate of 5 μL/h.              three different locations on secondary folds of the reference
                                                                   tissue, 100 cells were assessed for the presence of secondary
Immunohistochemistry of reference tissue and                       cilia and nuclear progesterone receptors. The average value
EOEC monolayer sections for cell height, ciliation                 of these three locations was considered representative for
and progesterone receptor expression                               an individual mare. For EOEC monolayers, 100 EOECs per
Reference tissues for assessing the percentage of ciliated and     monolayer were assessed and the percentage of positive cells
nuclear progesterone receptor positive EOECs; and cell height      was determined. Cell height was assessed using Fiji software
were obtained from three mares in each of the follicular and       [30]. Twenty cells from the HE-stained samples that were fully
luteal phases. The ampulla of the oviducts was dissected from      visible from base to the apex were measured. The secondary

                                                                                                                                      Downloaded from https://academic.oup.com/biolreprod/article/106/4/710/6485188 by guest on 24 June 2022
the remaining tissue and fixed in 4% formaldehyde for 1–           cilia were not included in the cell height.
3 days. The fixed ampulla was then embedded in paraffin
and 3 μm sections were subsequently cut and mounted on
Superfrost plus glass slides. Samples were either stained with     Epithelial characterization of EOECs after culture
hematoxylin–eosin (HE), probed without antigen retrieval for       A marker for cells of epithelial origin (Anti-Cytokeratin 19
the presence of cilia or probed after antigen retrieval for        antibody, clone b170; ab49384, Abcam, Cambridge, UK)
nuclear progesterone receptor expression.                          was validated using reference tissue from mares in either the
   The paraffin-embedded oviduct sections were prepared for        follicular or the luteal phase.
HE staining by heating in an oven at 60 ◦ C for 15 min. The          Cryosections of isthmus and ampulla from three different
sections were then stained with Pas Hematoxylin for 4 min          mares (n = 3) were cut on a cryostat with a fixed blade (Model
and rinsed with water for 5 min. Next, the sections were           CM 3050S, Leica, Eindhoven, The Netherlands) at −20 ◦ C.
incubated successively for 1 min in 70% and 96% ethanol.           Fourteen μm thick sections were mounted on Superfrost plus
The sections were then stained with eosin Y for 1 min before       glass slides (VWR, Amsterdam, The Netherlands) and stored
dehydration by immersion in 100% ethanol (twice for 1 min)         at +4 ◦ C until staining. Sections were fixed with acetone
and xylene (twice for 1 min). Slides were sealed with water        for 10 min. After rinsing in PBS with 0.2% (v:v) Tween 20
soluble glue and a coverslip prior to microscopic evaluation       (PBST), samples were permeabilized and nonspecific binding
of cell height.                                                    of the secondary antibody was blocked using 5% normal
   Oviduct sections for cilia and nuclear progesterone receptor    goat serum (GenWay Biotech, San Diego, CA, USA) in PBST
staining were subsequently deparaffinized using xylene and         for 30 min. After two washing steps with PBST, the sections
decreasing ethanol concentrations (first 100%, then 50%).          were incubated with the primary antibody in PBST (1:50 anti-
A final wash step was performed using PBS. Next, antigen           cytokeratin 19) overnight at 4 ◦ C. Next, the slides were rinsed
retrieval was performed for the oviduct sections to be pro-        three times for 5 min with PBST before incubation with the
cessed for nuclear progesterone receptor staining only. Briefly,   secondary antibody (1:100 in PBST; Goat anti-Mouse IgG
antigen retrieval was performed by heating in a citrate buffer     (H + L)) conjugated to Alexa Fluor 488, A11029; life tech-
(pH 6). The slides were submerged in the buffer, heated to 97      nologies) for 1.5 h at room temperature. After another two
◦ C and incubated for 20 min. After cooling down to 75 ◦ C,        washes in PBST, sections were stained with Hoechst 33342
the slides were rinsed thoroughly in PBST for 5 min.               (5 μg/mL) and phalloidin conjugated to Alexa Fluor 568
   Regardless of whether antigen retrieval was performed,          (both at 1:100 dilution (v:v) in PBST). After 1 h incubation
oviduct sections were treated for 5 min with endogenous            at room temperature, sections were rinsed three-times with
peroxidase activity blocking solution (S2023; Dako, Hev-           PBST and covered with a 1:1 mixture of Vectashield (Vector
erlee, Belgium). Slides were then washed with PBST and             Laboratories, Burlingame, CA, USA) and PBS. A cover slip was
blocked with normal goat serum for 15 min. Next, the anti-         applied and sealed with nail polish. The slides were stored in
acetylated alpha tubulin antibody (sc-23,950, Santa Cruz           the dark at 4 ◦ C until imaging. During each staining session,
Biotechnology; 1:200 in normal antibody diluent (33 593;           one sample was incubated with PBST instead of the primary
Immunologic, Duiven, The Netherlands)) or the anti-nuclear         antibody, and served as negative control.
progesterone receptor antibody (MA5–14505, Thermo Fisher             Glass cover slips with cultured EOECs, and EOEC mono-
Scientific; 1:200 in normal antibody diluent) was added for        layers cultured by the direct seeding and de-differentiation/re-
1 h at room temperature. After three washing steps, the horse      differentiation protocols were processed as described for tis-
radish peroxidase-conjugated secondary antibody (concentra-        sue sections. The only difference was that cultured EOECs
tion indicated by the manufacturer; VWRKDPVO110HRP;                were fixed in 1% paraformaldehyde for 10 min at room
Brightvision, Almere, NL) was added to the slides and incu-        temperature.
bated for 30–60 min at room temperature. The slides were             Sections were imaged using a fluorescence microscope
washed again in PBST before 2 drops of the chromogen               (BX60, Olympus, Zoeterwoude, The Netherlands) equipped
AEC (K3464; Dako, Heverlee, Belgium) were added. After             with a CCD camera (Leica DFC425C) connected to LAS-
a 20-min incubation, the slides were rinsed with demineral-        AF software (Leica Microsystems GmbH, Wetzlar, Germany)
ized water and counterstained with PAS-Hematoxylin (3870,          at 100–400x magnification. The light source was an UV
Baker, Landsmeer, The Netherlands). The slides were then           lamp (EL-6000, Leica) and filters for blue fluorescence
rinsed with tap water for 5 min and sealed under a cover           (wavelengths for filters were for excitation: 340–380/20 nm,
slip with water soluble glue (Aquatex; Merck, Amsterdam,           dichroic mirror: 400 nm, emission: >425 nm), green fluo-
The Netherlands). Estrous cycle stage-mimicking hormone            rescence (excitation: 445–535 nm, dichroic mirror: 510 nm,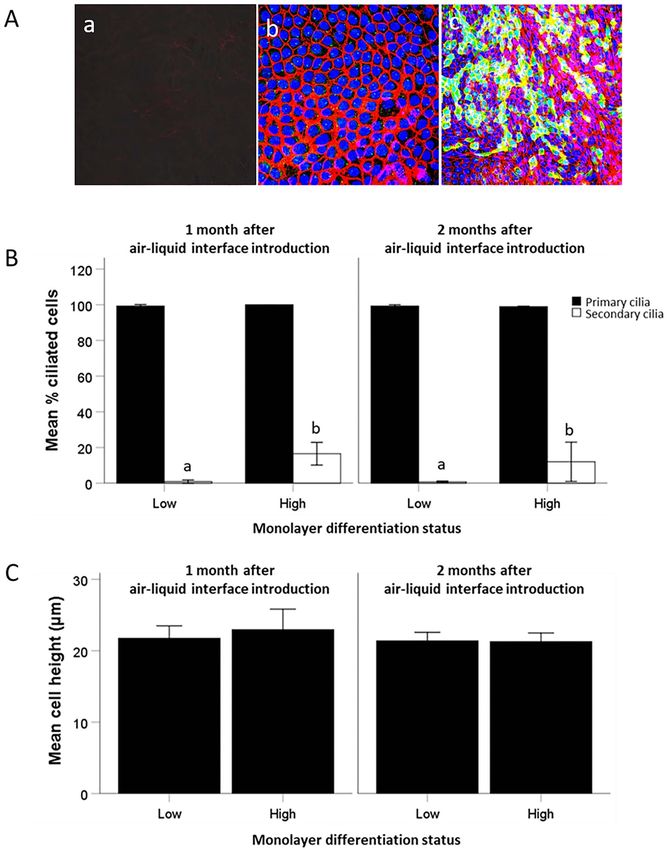
714                                                                 Polarized equine oviduct epithelial model, 2022, Vol. 106, No. 4

emission: >515 nm), and red fluorescence (excitation: 515–         5 min. Subsequently, the EOECs were permeabilized and
560 nm, dichroic mirror: 580 nm, emission: >590 nm)                non-specific binding was blocked using PBS containing 0.5%
were used. During imaging of samples, exposure time, gain,         Triton X-100 and 5% normal goat serum for 30 min at
and gamma values for the green fluorescence (cytokeratin           room temperature. The membranes were washed twice in PBS
labeling) were kept constant between stained samples and the       containing 0.5% Triton X-100 for 5 min. The membranes
corresponding negative controls, while settings for imaging        were then incubated overnight at 4 ◦ C with either a mouse
blue and red fluorescence were adjusted to optimize balance        anti-acetylated α-tubulin primary antibody (1:100 dilution,
of the color in the overlay images.                                sc-23950; Santa Cruz Biotechnology, Santa Cruz, CA, USA)
                                                                   to stain cilia, a mouse anti-occludin primary antibody (1:100
Detection methods for confluency in the EOEC                        dilution, ab168957; Abcam, Cambridge, UK) to stain tight
monolayer                                                          junctions, or a mouse anti-cytokeratin 19 antibody (1:50,
Trans-epithelial electrical resistance                             clone b170; ab49384; Abcam, Cambridge, UK) to verify
Trans-epithelial electrical resistance (TEER) measurements         the epithelial nature of the cultured cells. The next morn-
                                                                   ing the EOECs were washed three times in PBS containing

                                                                                                                                       Downloaded from https://academic.oup.com/biolreprod/article/106/4/710/6485188 by guest on 24 June 2022
were performed as described by Chen et al. [31]. Electrodes
(World Precision Instruments GmbH, Friedberg, Germany)             0.5% Triton X-100 (5 min per wash) and incubated with
were sterilized for 10 min in 70% ethanol connected to a           an Alexa Fluor 488 conjugated goat anti-mouse antibody
digital Volt-Ohm meter (Millipore, Billerica, USA), and equi-      (1:100 dilution; Invitrogen, Landsmeer, The Netherlands) at
librated according to the manufacturer’s recommendations.          room temperature for 2 h. The membranes were washed
For assessing the TEER, values in the microfluidic chips           a further three times with PBS containing 0.5% Triton X-
two Ag+ /AgCl wire electrodes (World Precision Instruments         100 for 5 min. Subsequently, cell nuclei and actin filaments
GmbH, Friedberg, Germany) were connected to the electrodes         were stained respectively using 5 μg/mL Hoechst 33342 and
using alligator clips. To eliminate the influence of temperature   phalloidin conjugated to Alexa Fluor 568 (1:100 dilution)
and atmospheric conditions, measurements were performed            in PBS containing 0.5% Triton X-100. After 1 h incubation,
immediately after replacing the DMEM + 10% FBS cul-                the membranes were washed twice with PBS for 5 min and
ture medium with antibiotic supplemented M199 + 20% FBS            excised from the hanging insert or chip chamber. Excised
medium on a heated plate at 38 ◦ C. Using this protocol,           membranes were mounted on glass slides (Marienfeld, Lauda-
no reading drift was apparent. Electrodes were inserted into       Königshofen, Germany) using Vectashield (Vector Labora-
both the apical and the basal compartment. After 1 min             tories, Burlingame, USA) as antifade, and sealed with nail
of stabilization, the electrical resistance was recorded. The      polish. Negative controls were prepared by omitting incuba-
electrical resistance of a blank insert / chip (without cells)     tion with the primary antibody. Imaging was performed by
was measured in parallel. To obtain the TEER (in Ω ∗ cm2 ),        laser scanning confocal microscopy using a TCS SPE-II system
the blank value was subtracted from the total resistance of        (Leica Microsystems GmbH, Wetzlar, Germany) attached to
the sample, and the final unit area resistance (Ω ∗ cm2 ) was      an inverted semi-automated DMI4000 microscope (Leica)
calculated by multiplying the sample resistance by the effective   with a 40x objective with a numerical aperture (NA) of
area of porous membrane onto which the EOECs were grown            1.25, 63x objective with NA 1.30 or 100x objective with
(insert: 0.33 cm2 ; microfluidic chip: 0.36 cm2 ).                 NA 1.40. Z-stacks with 0.21 μm step size and 1.5x digital
                                                                   zoom were obtained. The 3D constructs of the monolayer cells
                                                                   were assembled using ImageJ software (National Institutes of
Paracellular tracer flux assay
                                                                   Health, Bethesda, MD, USA) or Leica LAS AF lite software to
In addition to TEER measurements, the confluency of the            assess cell morphology and measure cell height. In the direct
cultured EOEC monolayers was tested using a paracellular           seeding protocol and in the proof-of-principle experiment for
tracer flux assay. For permeability measurements, 200 μL of        spontaneous re-differentiation of pre-cultured EOECs, two
a 12 μg/mL fluorescein disodium salt (0.4 kDa) solution in         image stacks per timepoint and mare were obtained using the
M199 medium was added to the apical compartment of the             63 x lens to quantify the percentage of ciliated EOECs. A
hanging Transwell inserts or gently pipetted into the apical       mean of 106 EOECs (min: 61, max: 166) per stack were eval-
channel of the microfluidic chip, and pure M199 medium             uated. In the systematic screening experiment, imaging was
(without fluorescein) was added or pipetted into the basal         performed using the epifluorescence microscope described
compartment. Two hours later, the fluorescence intensity was       previously, to assess the percentage of ciliated EOECs. The
measured in the medium recovered from the basal compart-           magnification objective was 40x NA 0.75. Five randomly
ment of individual inserts or microfluidic chips. Empty devices    selected fields of view in the center of the membrane were
(no EOECs) served as a control for maximum tracer flux,            imaged for each monolayer and, at least, 750 EOECs per
i.e., 100%. The fluorescence intensity was measured using          membrane were classified. The images were imported into
a BMG Clariostar fluorimeter (Ortenberg, Germany). The             Imaris 8.2 software (Bitplane AG, Zurich, Switzerland) to
permeability values for each monolayer were expressed as           determine the percentage of ciliated EOECs on each mem-
relative flux by comparison to the maximum tracer flux in          brane. The ratio of nuclei without overlaying cilia to the total
empty devices.                                                     number of counted nuclei was assessed.

EOECs morphology and ciliation                                     Effect of cycle stage-mimicking hormone exposure
At designated times after introduction of the air–liquid inter-    on EOEC monolayers
face, EOEC monolayers cultured in Transwell inserts and            Evaluation of the presence of nuclear progesterone receptors
microfluidic chips were assessed for cilia formation, presence     in EOECs was performed using EOEC monolayers exposed
of tight junctions and cytokeratin expression. The monolay-        to estrous cycle stage-mimicking hormones. Hormone con-
ers were fixed in 4% paraformaldehyde in PBS for 15 min            centrations resembled concentrations found in oviduct tissue
at room temperature and then rinsed twice with PBS for             and blood at the respective cycle stage [11, 32, 33]. At the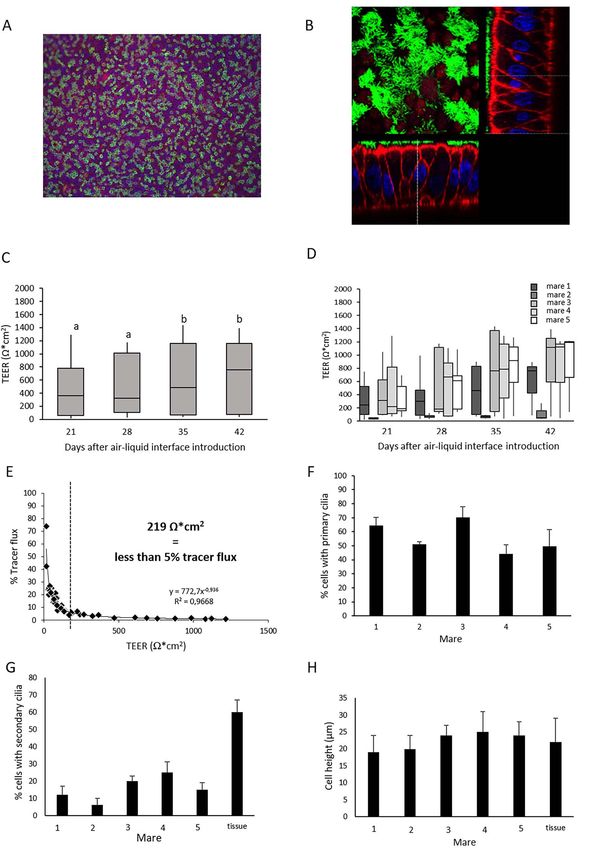
B. Leemans et al., 2022, Vol. 106, No. 4                                                                                                                 715

                                                                                                                                                                 Downloaded from https://academic.oup.com/biolreprod/article/106/4/710/6485188 by guest on 24 June 2022

Figure 1. Experimental set-up to establish confluent monolayers of differentiated EOECs on a microporous membrane in Transwell inserts. The
re-differentiation of the cultured EOECs was stimulated by the introduction of an air–liquid interface at the apical surface of the monolayers. Two
protocols were developed: (A) a direct seeding and (B) a re-differentiation protocol. Re-differentiation experiments were divided in the manuscript into a
(a) proof-of-principle experiment and (b) systematic experiments for evaluation of critical factors (FBS: fetal bovine serum; TEER: transepithelial electrical
resistance; TF: tracer flux assay; IF: immunofluorescent staining).

time of air–liquid interface introduction EOEC monolayers                        for 16 days with 10 ng/mL E2 and 1000 ng/mL P4 (oviduct
were cultured in DMEM + 10% FBS culture medium                                   concentration) or 20 pg/mL E2 and 10 ng/mL P4 (blood
supplemented with E2 (E2; P8783-16, Sigma, Zwijndrecht,                          concentration) to mimic the luteal phase. In order to
The Netherlands) and progesterone (P4; E2758-16, Sigma,                          induce follicular phase conditions, hormone concentrations
Zwijndrecht, The Netherlands) to mimic sequentially the                          were changed to 80 ng/mL E2 and 40 ng/mL P4 (oviduct
luteal and follicular phases of the mare’s estrous cycle. To this                concentration); or 40 pg/mL E2 (blood concentration) for
end, the medium in the basal compartment was supplemented                        five consecutive days. For sperm-binding experiments, only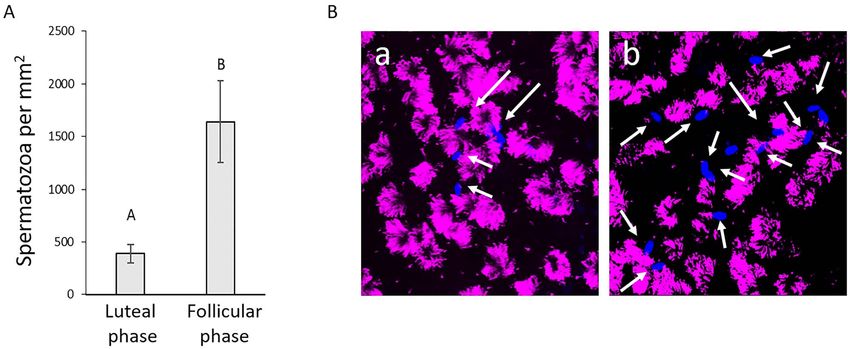
716                                                                Polarized equine oviduct epithelial model, 2022, Vol. 106, No. 4

oviduct concentrations were assessed. Ethanol served as              In a second experiment, three different EOEC collection
solvent for the hormone supplementation with a final ethanol      methods, i.e., conventional oviduct flushing, mechanical isola-
concentration of 1% (v:v). Culture medium was refreshed           tion, and trypsin digestion were compared for their efficiency
every other day.                                                  in retrieving a population of viable EOECs from the isthmus
                                                                  and ampulla. Cell number and viability of EOECs collected
Sperm preparation                                                 from the isthmus and ampulla were assessed by Trypan Blue
Semen from two fertile stallions was collected with the help of   staining using a hemocytometer chamber. All values refer
an artificial vagina (Hanover Model) and a dummy mare. Col-       to the results from a single 5 cm long oviduct segment. In
lected ejaculates were filtered through gauze and diluted with    short, both oviducts from five donors were assessed for the
INRA96 (IMV technologies, L’Aigle, France) to a concentra-        conventional flush technique (n = 10); subsequently one of the
tion of 30 x 106 spermatozoa / mL. Computer-assisted sperm        two oviduct sections was subjected to mechanical scraping
analysis (CASA) was carried out as previously described by        (n = 5) and the other to enzymatic digestion (n = 5).
Brogan et al. [34]. Only samples with at least 65% motile sper-      Next, the epithelial origin of harvested and cultured EOECs
matozoa were used for experiments. Next, spermatozoa were         recovered from ampullary segments was evaluated by cytok-

                                                                                                                                      Downloaded from https://academic.oup.com/biolreprod/article/106/4/710/6485188 by guest on 24 June 2022
labeled with Hoechst 33342 (final concentration: 5 μg/mL)         eratin 19 staining after 10-day culture on glass cover slips
during incubation for 15 min at 37 ◦ C. The spermatozoa were      (n = 5 mares; n = 10 samples). Likewise, three EOEC mono-
then layered on top of a discontinuous 35:70% Percoll-saline      layers obtained 21 days after air–liquid interface introduc-
gradient and centrifuged for 10 min at 300 × g followed           tion after direct seeding (n = 5 mares) or re-differentiation
by 10 min at 750 × g to remove extracellular Hoechst              of EOECs (n = 5 mares) were evaluated for cytokeratin 19
33342 dye. The supernatant and Percoll-saline was pipetted        expression.
off and the sperm pellet was resuspended in a bicarbonate-           Subsequently, differentiated EOEC monolayers were pro-
free variant of Tyrode’s medium (111 mM NaCl, 3.1 mM KCl,         duced in Transwell inserts. Using the direct seeding protocol,
0.4 mM MgSO4 , 5 mM Glucose, 0.3 mM KH2 PO4 , 20 mM               21 days after introduction of an air–liquid interface EOEC
HEPES, 21.7 mM Na-lactate, 1 mM Na-pyruvate, 100 μg/mL            morphology, cell height, and primary and secondary ciliation
gentamycin, 2 mM CaCl2 , and 1 mg/mL BSA). The final sperm        rates were assessed by combined Hoechst 33342, F-actin, and
concentration was adjusted to 10 × 106 spermatozoa / mL.          anti-acetylated α-tubulin antibody labeling. Moreover, the
                                                                  confluency of the EOEC monolayers was assessed by TEER
Sperm-binding assay                                               and tracer flux measurements 21, 28, 35, and 42 days after
Binding of spermatozoa to EOEC monolayers exposed to              air–liquid interface introduction. Timepoint 0 days was not
cycle stage-mimicking hormone concentrations was tested at        included since EOECs were still in the process of attachment
the end of the “luteal” and the end of the “follicular” phase.    and reaching confluency. All parameters were assessed on
At both timepoints, semen from both stallions was freshly         five EOEC monolayers per donor. In total, five donors were
collected and prepared for the experiments as described above.    assessed in this experiment (n = 25 inserts per experiment).
Hoechst-labeled spermatozoa from the two fertile stallions           Since initial adhesion of the EOECs to the microporous
were mixed equally to reduce any stallion bias on sperm-          membrane and formation of a confluent monolayer took
EOEC binding. Next, 100 μL mixed sperm suspension was             about 10 days, a de- and re-differentiation protocol, allowing
added to the apical compartment of the Transwell inserts (10      EOEC adhesion within 2 days, was established in Transwell
× 106 spermatozoa / mL). Coincubation was carried out for         inserts before transfer to microfluidic chips. In a proof-of-
1 h at 37 ◦ C in 5% CO2 -in-air. Subsequently, the apical com-    principle experiment, similar morphology parameters were
partment was gently rinsed with bicarbonate-free Tyrode’s         assessed 21 days after air–liquid interface introduction. EOEC
medium to remove non-bound spermatozoa. Samples were              monolayer confluency was assessed by TEER and tracer
fixed with 4% paraformaldehyde for 15 min at room temper-         flux measurements 0, 21, 28, 35, and 42 days after air–
ature and stained with acetylated α-tubulin (1:150; detected      liquid interface introduction. All parameters were assessed on
with 1:100 goat-anti-rabbit Alexa Fluor 647) and phalloidin-      eight EOEC monolayers per donor. In total five donors were
AlexaFlour 568, in analogy to the immunofluorescent staining      assessed in this experiment (n = 40 inserts). TEER and tracer
procedure described above. Samples were mounted on slides         flux data could only be collected for four donors at the time
with Vectashield, covered with a cover slip and sealed with       due to technical problems with the TEER electrodes. Next,
nail polish. Five randomly selected spots on each membrane        the effect of the cycle stage of cell donor and experiment
were imaged by fluorescence microscopy (Olympus BX 60,            on the secondary ciliation variability was assessed 1 and
20x magnification). The number of bound spermatozoa per           2 months after air–liquid interface introduction. Secondary
mm2 was quantified by the number of bound sperm heads,            ciliation rates were assessed for three inserts per donor. In
with the help of the counting tool in Adobe Photoshop (ver-       10 different experiments, a total of 30 different donors were
sion 2014, Adobe, CA, USA). Results from all five locations       evaluated including 17 mares in the follicular phase and 13
per membrane were averaged and considered as the sperm-           mares in the luteal phase (n = 90 inserts).
binding density for a given sample.                                  The functionality of EOEC monolayers cultured by the re-
                                                                  differentiation protocol in Transwell inserts and subsequently
Experimental design                                               exposed to cycle stage-mimicking hormones was evaluated as
In order to investigate EOEC characteristics in reference         follows. EOEC monolayers from four different mares were
tissue, paraffin-embedded sections of ampullary origin were       cultured for 16 days in luteal phase hormone conditions
initially made from three donors at the follicular and three      followed by 5 days in follicular phase hormone conditions.
donors at the luteal stage. EOEC morphology including cell        We examined whether mimicking both the luteal and follic-
shape and height, ciliated: non-ciliated EOEC ratio and sec-      ular phases of the cycle, and comparing oviduct and blood
ondary cilia distribution was evaluated.                          hormone concentrations, would have an effect on nuclear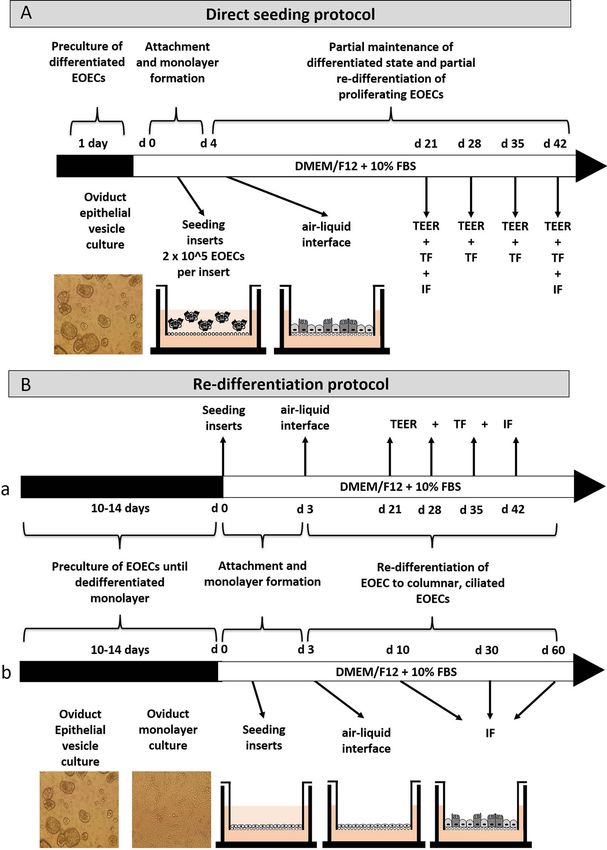
B. Leemans et al., 2022, Vol. 106, No. 4                                                                                        717

progesterone receptor expression. For each of the four donors,     in the luteal phase. Occasionally, cell bodies protruded beyond
one EOEC monolayer was assessed. For the sperm-binding             the epithelial lining. In most cases, these protrusions contained
assay, EOECs were collected from three different donors. Two       nuclear material (Figure 2A).
monolayers per donor and per simulated cycle stage were
assessed. In total, 12 inserts were assessed in this experiment.   Viable EOECs can be collected from the ampulla by
The number of bound spermatozoa was counted for five               mechanical scraping or trypsin digestion
randomly selected spots per Transwell insert.                      EOECs were collected from the ampulla and the isthmus
   Finally, the de- and re-differentiation protocol was trans-     by three different methods. Conventional oviduct flushing
ferred to microfluidic chips since EOEC adhesion allowed           resulted in extremely low EOEC yields from both the ampulla
early onset of microfluidic perfusion, within 2–3 days after       (5 ± 6 x 10³ total live cells) and the isthmus (5 ± 5 x 10³ total
seeding. The effect of EOEC donor cycle stage on the variabil-     live cells) (Table 1). The mechanical isolation and trypsin
ity of secondary ciliation was assessed 1 and 2 months after       digestion methods were equally successful for retrieving
air–liquid interface introduction. Secondary ciliation rates       EOECs from the ampulla (25.5 ± 22.0 x 10⁶ vs 31.7 ± 16.6
were assessed for two inserts per donor. Within five different     x 106 total live cells) (Table 1). By contrast, trypsin digestion

                                                                                                                                       Downloaded from https://academic.oup.com/biolreprod/article/106/4/710/6485188 by guest on 24 June 2022
experiments, a total of 10 different donors were evaluated,        was five times more effective than mechanical isolation for
including six mares that were in the follicular phase and four     collecting viable cells from the isthmus (4.15 ± 4.93 x 10⁶ vs
mares in the luteal phase (n = 20 inserts).                        0.86 ± 0.62 x 10⁶ total live cells; Table 1).

Statistical analysis                                               Harvested and cultured cells are of epithelial origin
All experiments were performed with EOECs from different           Monolayers obtained by 10-day culture on glass cover slips
Warmblood mares in duplicate or triplicate. Before analysis,       of EOECs recovered from ampullary segments (Figure 3A),
normality of distribution for the variables was checked using      and EOEC monolayers obtained 21 days after air–liquid
the Shapiro–Wilk and Kolmogorov–Smirnov tests (P < 0.05).          interface introduction after direct seeding (Figure 3B) or re-
Differences between isolation protocols in EOEC yield and          differentiation of EOECs (Figure 3C) all stained positive for
viability were evaluated with the Mann–Whitney U-test. The         cytokeratin 19, an epithelial cell marker (Figure 3). Oviduct
relationship between TEER and paracellular tracer flux was         cryosections taken at the level of the ampulla, and contain-
modeled by non-linear regression. Correlations between cell        ing EOECs on the luminal side, were used as a positive
density and the percentage of ciliated EOECs were calcu-           control and showed similar specific EOEC cytokeratin 19
lated using Spearman correlation coefficient. An effect of         staining (Figure 3D). Negative controls (secondary antibody
culture time on TEER was estimated using a one-way-ANOVA           only) showed no fluorescence (Figure 3A-D).
for repeated measures. Student t-test for paired observations
was used as a post-hoc test. The effect of both protocols          Establishment of differentiated EOEC monolayers
on membrane confluency parameters; presence of primary             in Transwells can be achieved by direct seeding or
and secondary cilia in EOECs cultured in the two different         by de- and re-differentiation
systems; expression of nuclear progesterone receptors and
                                                                   Using the direct seeding protocol, a confluent EOEC
sperm–binding density to EOEC monolayers exposed to cycle
                                                                   monolayer with ciliated and non-ciliated cells was obtained
stage-specific hormones were assessed by analysis of variance
                                                                   ∼21 days after air–liquid interface introduction (Figure 4A).
(ANOVA). Overall differences were identified using repeated
                                                                   All EOECs contained an intact round or oval-shaped nucleus
measures ANOVA with Greenhouse–Geisser and Bonferroni
                                                                   at the basal end of the cell (labeled with Hoechst 33342)
correction, as implemented in the general linear model. Scheffé
                                                                   and a dense cytoskeleton as observed using phalloidin (F-
post-hoc tests were performed for pairwise comparisons. Dif-
                                                                   actin) labeling (Figure 4A and B). An average cell height
ferences were considered significant if P < 0.05. All analyses
                                                                   of 13.2–18.5 μm (21 days; Figure 4H) and 19.6–30.2 μm
were performed using SPSS version 20 for Windows (SPSS
                                                                   (42 days) indicated their columnar shape. In addition,
Inc., Chicago, IL).
                                                                   between 44 and 70% and 5 and 22% of the EOECs in
                                                                   the monolayers displayed primary and secondary cilia on
                                                                   their apical surface at Day 21, respectively (Figure 4F and G).
Results                                                            During prolonged culture, the percentage of primary and
EOEC morphology in reference tissues                               secondary ciliated EOECs increased from 61 to 80% and
Paraffin-embedded oviduct sections of ampullary origin             31–46% in 3 out of 5 mares, respectively (42 days). The
demonstrated that the luminal lining is composed of                ciliated EOECs were distributed diffusely over the monolayer
columnar EOECs that are either non-ciliated or have a              (Figure 4A and B). However, the percentage of ciliated
bundle of secondary cilia on their apical side (Figure 2A).        EOECs correlated significantly with EOEC density on the
Immunohistochemistry using anti-acetylated alpha tubulin           microporous membrane (EOECs per mm2 ; r = 0.78, P < 0.05).
antibodies demonstrated the distribution of secondary cilia        In order to confirm monolayer confluency, TEER was assessed
at the level of the ampulla (Figure 2B). The percentage of         in EOEC monolayers 21, 28, 35, and 42 days after air–
secondary ciliated EOECs was 60 ± 14% in the follicular and        liquid interface introduction. In general, TEER increased
55 ± 10% in the luteal phase. Moreover, nuclear progesterone       slightly between Days 28 and 35 (Figure 4C). However,
receptors were present in ampullary EOECs (Figure 2C). In          TEER measurements showed a wide variation between
total, 60 ± 10% and 63 ± 14% of the EOECs from luteal              individual mares, and between different monolayers derived
and follicular phase oviducts, respectively, demonstrated          from individual animals (Figure 4D). Nevertheless, monolayer
progesterone receptor expression in their nucleus. Average cell    integrity or confluency was confirmed by low paracellular
height was 12.8 ± 1.5 μm in the follicular and 16.0 ± 4.7 μm       tracer flux (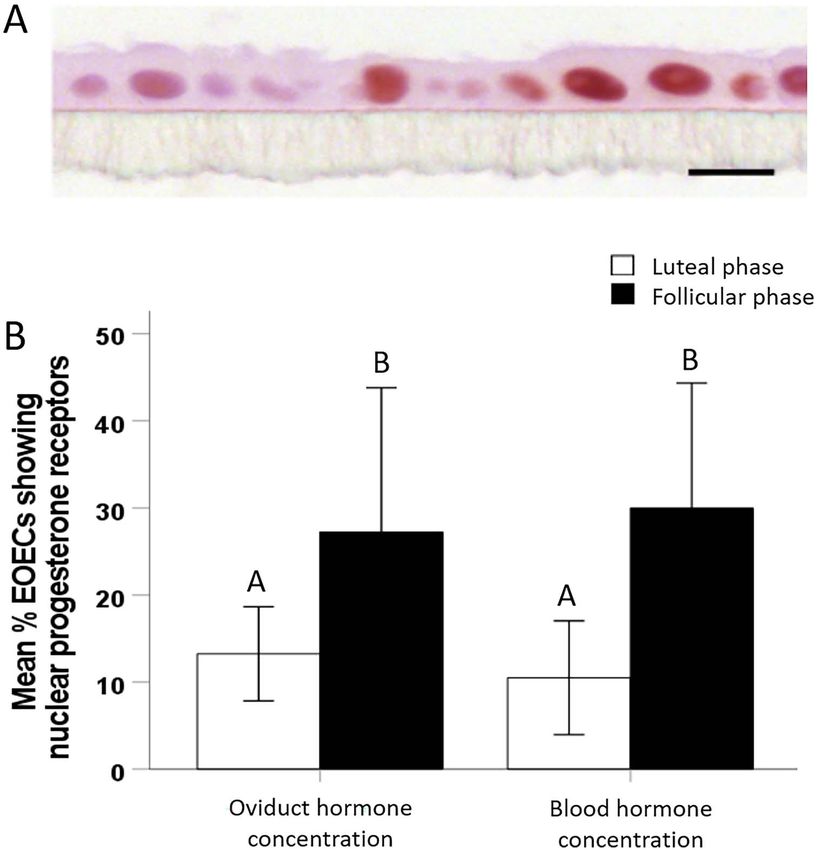
718                                                                             Polarized equine oviduct epithelial model, 2022, Vol. 106, No. 4

Figure 2. (A) Morphology of EOECs at the level of the ampulla, stained with HE (1000x). Black arrows indicate secondary ciliated EOECs and white stars
demonstrate non-ciliated EOECs. The black arrow head shows an apical protrusion, while the white arrow head shows an apical protrusion with a
nucleus. Sections of the equine oviduct ampulla after immunohistochemical staining for (B) acetylated alpha tubulin (400x) and (C) nuclear progesterone

                                                                                                                                                          Downloaded from https://academic.oup.com/biolreprod/article/106/4/710/6485188 by guest on 24 June 2022
receptors (200x). Secondary cilia and nuclei positively stained for progesterone receptors show a distinct brown staining pattern. Inlays are negative
control images.

Table 1. Comparison of methods for isolating OECs from equine oviducts OECs were harvested by (A) flushing the oviductal lumen with PBS (flush), (B)
scraping the mucosa of the longitudinally incised ampulla, or squeezing the isthmus with forceps (mechanical), or (C) by filling the lumen with
Trypsin/EDTA for 30 min at 38 ◦ C and subsequent mechanical isolation (Trypsin). Cell number and viability (mean ± s.d.) were assessed after Trypan
Blue staining using a hemocytometer chamber. Different small letters (a,b,c) per column indicate significant differences between isolation methods for
EOECs from either ampulla or isthmus (P < 0.05).

                          Isolation method                   Total cell number (x106 )          Live cells (%)             Total live cells (x106 )
Ampulla                   Flush                              0.09 ± 0.06a                       7.4 ± 11.9a                0.005 ± 0.006a
                          Mechanical                         43.1 ± 33.8b                       72.3 ± 30.9b               25.5 ± 22.0b
                          Trypsin                            43.0 ± 21.6b                       75.1 ± 14.6b               31.7 ± 16.6b
Isthmus                   Flush                              0.08 ± 0.04a                       5.3 ± 3.6a                 0.005 ± 0.005a
                          Mechanical                         1.10 ± 0.70b                       73.2 ± 26.3b               0.86 ± 0.62b
                          Trypsin                            7.58 ± 6.76c                       50.8 ± 33.6b               4.15 ± 4.93c

and 42 (n = 47 samples; 2–3 samples per mare) presented in                    30 mares were precultured (Figure 6Aa-c) and subsequently
Figure 4E, cultured EOEC monolayers were considered fully                     seeded onto inserts and cultured for up to 2 months after air–
intact and confluent when TEER values were >219 Ω ∗ cm2 .                     liquid interface introduction (Figure 6Ad-f). One month after
   In a proof-of-principle experiment, we demonstrated                        air–liquid interface introduction, re-differentiated EOECs
that spontaneous re-differentiation of pre-cultured de-                       had average heights of 18–25 μm and a columnar shape
differentiated EOEC monolayers was possible (Figure 5).                       (Figure 6C). The monolayers consisted of columnar/polarized
Samples from four mares were seeded in Transwell inserts                      EOECs expressing primary cilia (99.1 ± 0.7%; Figure 6Ae,
and monitored for up to 6 weeks (42 days) after air–liquid                    Af, and B); however, very few EOECs developed secondary
interface induction. Samples were regularly assessed for TEER                 cilia after introducing an air–liquid interface (0.9 ± 0.6%
which, in general, did not fluctuate markedly over time                       of the EOECs in a cultured monolayer; Figure 6Ae and B;
(Figure 5A). On the other hand, samples showed a wide                         Table 2). Very occasionally (5.6% of the cultured monolayers;
variation between individual mares, and differences in TEER                   Table 2), monolayers of re-differentiated columnar/polarized
were also observed between samples from individual animals                    EOECs exhibited significantly higher incidences of secondary
(Figure 5B). Based on the assumption that a paracellular tracer               ciliation (14.1 ± 4.1%; Figure 6Af and B; Table 2). Even
flux lower than 5% confirms an intact/confluent monolayer,                    then, EOECs with secondary cilia were distributed diffusely
TEER values of more than 462 Ω ∗ cm2 were concluded to be                     (Figure 6Af) and correlated significantly with EOEC density
indicative of intact monolayers (Figure 5C). This assumption                  on the microporous membrane (EOECs per mm2 ; r = 0.80,
was strengthened by the presence of a dense occludin band,                    P < 0.05). Interestingly, there was no significant effect of
indicating the presence of tight junctions, towards the apical                experiment, cell donor (mare) or cycle stage on secondary
aspect of the cells (Figure 5C). The proportion of EOECs with                 ciliation rates (Table 2). Regardless of whether monolayers
secondary cilia after 42 days at an air-liquid interface varied               contained a low or high rate of EOECs with secondary cilia,
markedly between samples (0–32%; Figure 5D). An example                       all cells had a round to oval shaped nucleus and a dense
of a monolayer with successful spontaneous phenotypic re-                     cytoskeleton (Figure 6Ae and Af). Monolayer confluency
differentiation from de-differentiated EOECs to a columnar                    was confirmed by high TEER values (742 ± 125 Ω/cm2 )
ciliated EOECs is depicted in Figure 5E. As an example,                       and low tracer flux (
B. Leemans et al., 2022, Vol. 106, No. 4 719
Downloaded from https://academic.oup.com/biolreprod/article/106/4/710/6485188 by guest on 24 June 2022
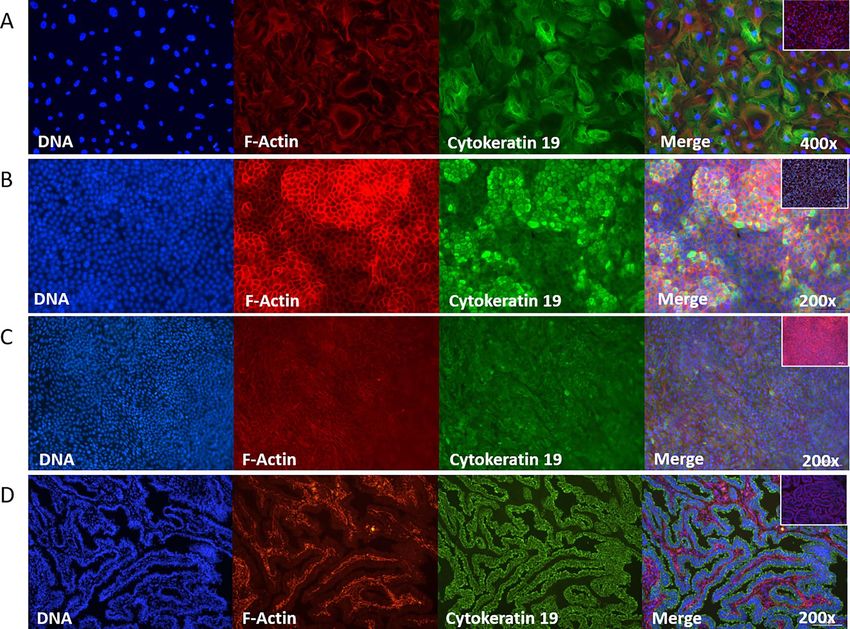
Figure 3. Confirmation that isolated and cultured EOECs of ampullary origin express epithelial cell markers. Indirect immunofluorescent staining for
cytokeratin 19 (1:50) was performed. Monolayers obtained after (A) 10 day culture in 6-well plates on glass cover slips, 21 days after air–liquid interface
introduction after seeding of (B) differentiated and (C) de-differentiated EOECs, all stained positive for cytokeratin 19 (green, original magnification:
200–400x). (D) As a positive control, histological sections of the oviductal lumen at the level of the ampulla demonstrated that it is lined with cytokeratin
19 positive EOECs. Inlay images (A-D) are negative control samples. EOECs were also stained for DNA (blue) and the cytoskeleton (red: F-actin).
Functionality of re-differentiated EOEC monolayers exposed for an additional 5 days to follicular phase condi-
cultured in Transwell inserts and exposed to cycle tions (1639 ± 389 sperm per mm2 ) (Figure 8A, Ba, and Bb,
stage-specific hormones P < 0.05). Interestingly, sperm–oviduct binding experiments
Re-differentiated EOEC monolayers cultured for 16 days also showed that spermatozoa bind to cilia located on the
under luteal hormone conditions showed a low percent- surface of the EOEC monolayers (Figure 8Ba and Bb).
age of EOECs expressing nuclear progesterone receptors
(oviduct concentration: 13.3 ± 5.4%; blood concentration:
10.5 ± 6.5%) (Figure 7B). By contrast, subsequent culture Establishing a monolayer of differentiated EOECs in
of EOEC monolayers for 5 days under follicular phase a microfluidic chip can only be achieved via
hormone conditions increased the percentage (P < 0.05) re-differentiation
of EOECs staining positively for nuclear progesterone Oviduct epithelial vesicles were not able to attach to the
receptors to ∼30% (oviduct concentration: 27.3 ± 16.5%; porous membrane of the chips and form a monolayer in less
blood concentration: 30.0 ± 14.3%) (Figure 7A and B). No than 10 days. This may be due to the small volume of medium
differences were observed in the percentage of nuclear in the basal compartment of the microfluidic chips, which had
progesterone receptor positive EOECs between monolayers to be refreshed at least twice per day. Moreover, to guarantee
cultured under oviduct versus blood hormone concentrations the supply of fresh culture medium it was important to initiate
in either follicular or luteal conditions (Figure 7B). Overall, microfluidic chip perfusion within 2–3 days after seeding.
these results suggest a significant functional downregulation This requirement for the early onset of microfluidic perfusion,
of nuclear progesterone receptors in EOECs under luteal i.e., before firm oviduct cell attachment to the membrane,
phase hormone conditions (i.e., high progesterone). presumably explains failure to allow establishment of a con-
EOECs were able to bind spermatozoa (Figure 8A). fluent monolayer, or even early cell attachment (Figure 9Aa).
Moreover, sperm-binding density was significantly lower Consequently, the direct seeding protocol was not applicable
for EOEC monolayers exposed for 16 days to luteal con- for establishing a differentiated EOEC monolayer culture in
ditions (388 ± 87 sperm per mm2 ) compared to monolayers microfluidic chips.720 Polarized equine oviduct epithelial model, 2022, Vol. 106, No. 4
Downloaded from https://academic.oup.com/biolreprod/article/106/4/710/6485188 by guest on 24 June 2022
Figure 4. Monolayers of EOECs 21 days after air–liquid interface introduction to cells seeded directly into Transwell inserts (direct seeding protocol). (A)
Representative overview image of a cultured monolayer of EOECs 21 days after air–liquid interface introduction (200x). EOECs were stained for markers
of cilia (green: acetylated alpha tubulin), DNA (blue) and the cytoskeleton (red: F-actin). (B) A z-projection of a typical monolayer demonstrated clear
presence of secondary cilia (green: acetylated α-tubulin) and a columnar epithelial cell phenotype (red: F-actin; blue: DNA; original magnification, 945x).
(C) TEER measurements (mean ± s.d.) were performed on monolayers of differentiated EOECs cultured in Transwell inserts 21, 28, 35, and 42 days after
air–liquid interface introduction (five mares: five inserts per mare). Small letters (a, b) indicate significant differences between days (P < 0.05; Student
t-test for paired samples). (D) The individual effect of these five different mares on TEER values was also verified. (E) The relationship between TEER
and flux of Na-fluorescein (0.4 kDa size) across the cultured monolayers was assessed (n = 47 assessments pooled from Days 21 to 42). Percentage
(mean ± s.d.) of EOECs with (F) primary and (G) secondary cilia in the monolayers. (H) The cell height (mean ± s.d.) of cultured EOECs from individual
mares. Reference values (tissue) for the percentage of ciliated EOECs and cell height in the ampulla segment were obtained from three mares (n = 3) in
each of the follicular and luteal phases. For a schematic overview of the experimental timeline, see Figure 1A.B. Leemans et al., 2022, Vol. 106, No. 4 721
Downloaded from https://academic.oup.com/biolreprod/article/106/4/710/6485188 by guest on 24 June 2022
Figure 5. Proof-of-principle experiment for spontaneous re-differentiation of EOECs and quality assessment of EOEC monolayers. Monolayer confluency
was assessed by TEER and paracellular tracer flux measurements. (A) TEER measurements (mean ± s.d.) of monolayers of re-differentiated EOECs
cultured in Transwell inserts were performed 0, 21, 28, 35, and 42 days after air–liquid interface introduction for four mares (eight inserts per mare).
Small letters (a, b) indicate significant differences between days (P < 0.05; Student t-test for paired samples). (B) The individual effect of these four
different mares on TEER values was also verified. (C) A clear relationship between the overall TEER and paracellular tracer flux results was evident.
TEER values of 462 Ω/cm2 corresponded with less than 5% tracer flux (n = 72 assessments pooled from Days 0 to 42). Presence of tight junction
complexes was demonstrated by a dense band of occludin (green, original magnification: 945x). (D) Expression of secondary cilia (mean ± s.d.) of
EOECs 6 weeks (42 days) after introduction of an air–liquid interface differed between samples. (E) Overview of a monolayer with 26% EOECs with
secondary cilia (green: cilia, red: F-actin, blue: DNA; original magnification: 200x). For a schematic of the experimental timeline, see Figure 1Ba.You can also read