Data analysis and research reveal the reasons why China still adheres to its "dynamic zero-COVID policy"
←
→
Page content transcription
If your browser does not render page correctly, please read the page content below
Data analysis and research reveal the reasons why China still adheres to its “dynamic zero-COVID policy” Yeyu Dai ( freddie999999@hotmail.com ) China Wireless-Valley (HK) Bingxi Dai ( bingxi.dai@outlook.com ) bingxi.dai@outlook.com Biological Sciences - Article Keywords: Omicron, BA.2, SARS-CoV-2, dynamic zero-COVID strategy, COVID, COVID-19, asymptomatic, dynamic zero-COVID policy Posted Date: May 31st, 2022 DOI: https://doi.org/10.21203/rs.3.rs-1532279/v3 License: This work is licensed under a Creative Commons Attribution 4.0 International License. Read Full License
Data analysis and research reveal the reasons why China still adheres
to its “dynamic zero-COVID policy”
Yeyu Dai, Bingxi Dai
Abstract
A complete and accurate statistical analysis of cases of contraction with SARS-CoV-2 are given
under the conditions of strict mandatory quarantine and isolation and of a high rate of full
vaccination1. SARS-CoV-2 is still new, and little is known about either its direction of variation or
its propagation laws. China has been attacked by its largest outbreaks of COVID-19 since March.
Pervasive arguments arose among people in China and around the world. Here we reveal the
essential reasons why China has been and will be adhering to its “dynamic zero-COVID policy”
which stands in contrast to a global trend towards easing restrictions and attempting to co-exist
with the circulating virus2, including the choice uniqueness, morbidity differences in different
cities, unpredictability, worries of sudden impact to medical system, successful reducing to zero
the number of each active chain of transmission and outstanding economy achievements, etc.
This study provides first-hand valuable information for further research on similar epidemics in
the future. It may bring new thoughts for correction of present epidemiological theory and
mathematical models, as well as new theoretical supports for the prevention policy making. It
may also give other countries time to be better prepared for the coming 6th wave driven by
Omicron BA.2.
Main
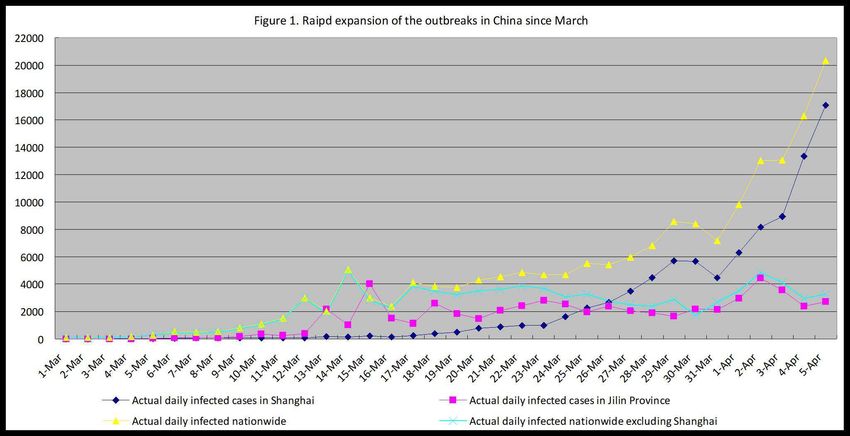
China had been attacked by its largest outbreaks of COVID-19 driven by The SARS-CoV-2 The
Omicron BA.2 subvariant3 since 21 March 2022, bringing over 180,000 infected people (by 4
April) in 30 provinces, including over 100 cities (hereafter also called the March outbreaks).
Among ten cities with over 900 confirmed cases, three of them were the most critical, including
Shanghai (which alone had 90,600 people to be infected), Changchun and Jilin (Fig. 1).
Changchun and Jilin are two major cities of Jilin province in Northeastern China.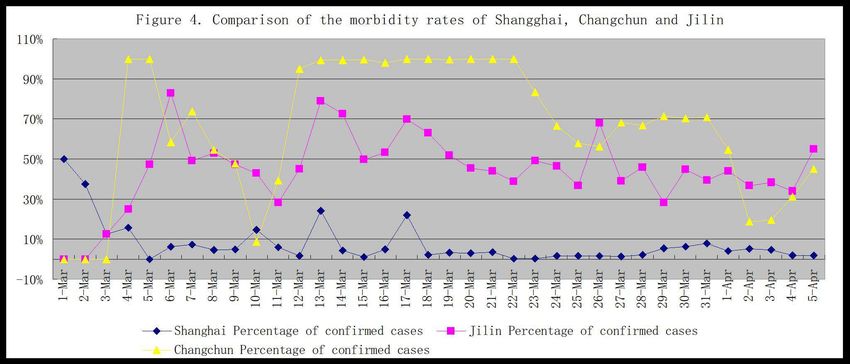
China’s “dynamic zero-COVID policy” had been working well and had successfully reached its goal
of reducing to zero the number of each active chain of transmission, even during the period of
the 5th wave driven by Omicron in the world4, until the March outbreaks. The outbreaks in
Shanghai were considered as a failure of “dynamic zero-COVID policy”. The rapid epidemic
expansion of the March outbreaks have plunged tens of millions of people into lockdown (Lewis,
2022) though all cities except Shenzhen did not implement the whole territory lockdown for one
week. President Xi Jinping announced on 19th March 2022 that China would stick to its “dynamic
zero-COVID policy”. This policy now stands in contrast to a global trend towards easing
restrictions and attempting to co-exist with the circulating virus (Lewis, 2022).

But pervasive doubts about the present policy arose reasonably across the world including
China’s own people. People were shocked by the fast climbing of the number of daily confirmed
new cases as well as the extremely high percentage of asymptomatic cases, meaning the huge
drop of the harmfulness of the virus in comparison with variants and subvariants before.
Nationwide daily percentage of mild cases and severe cases were not openly published except
Jilin Province. In Jilin, among all the confirmed cases, 99.56% were asymptomatic or mild, while
0.42% were moderate and 0.07% were severe or critical. The nationwide number of severe cases
remained in hospital were from 50 to 75 from 23th March to 5rd April 2022 indicating a very low
percentage of the severe cases too. The percentage of the remained severe cases in the
remained symptomatic cases was 0.31% on 5rd April. Fatality rate was extremely low and 2 deaths
were reported by Jilin on 18th March 2022, indicating case fatality rate of 0.0011%. The
above-mentioned data told why people began to doubt about the present policy.

Facing such a low severity rate or fatality rate, why China still adheres to its “dynamic
zero-COVID policy”? Although vaccines could not protect people from contracting the
SARS-CoV-2 virus, but scientists said that full vaccination could protect against severe disease and
death, with higher effectiveness among adults ≥60 years5. There were sayings of low rates of full
vaccination of elderly people in China, but that was not true. As press conferences of the
Department of State reported, over 87% of the population was fully vaccinated by mid-February
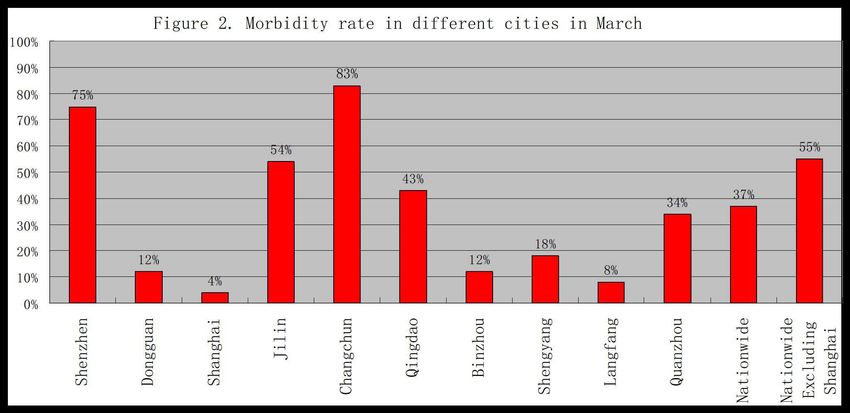
2022. The full vaccination rate is 87.45% overall by 05 February and 87.77% by 14 March 2022.
This rate of full vaccination is 88.01% in the overall population by 24 March 2022, with 84.36% or
222.72 million of those aged 60 and above. A total of 138.24 million (or 52.36% of) people over
60 years old received boost shots. China’s 7th census published its population as 1.412 billion,
among them 264 million or 18.70% aged 60 or above2.

Our recent studies disclosed the essential reasons why China has been and will be adhering to its
“dynamic zero-COVID policy”, including the choice uniqueness, morbidity differences in different
cities, unpredictability, worries of sudden impact to medical system, successful zero clearing in
some of the main cities and outstanding economy growth, etc.

Uniqueness of having a choice

Before March, Hong Kong had just recorded the most critical epidemics of in February with close
to 900 cases of COVID-19 per 100,000 residents in Hong Kong, the highest level recorded
anywhere in the world during the pandemic2. When its medical system was lashed breakdown by
the epidemics, Hong Kong was unable to admit all COVID-19 patients who needed hospitalization.
According to the press conference of HK SAR government, Hong Kong finally gave up mandatory
PCR testing on 21st March 2022. It had no choice other than joining the global trend towards
easing restrictions and attempting to co-exist with the circulating virus, at least in long period of
time in the future.

But China still has a Choice other than joining the global trend. Basically, it is a common sense for
people to make their best choice when they have some different choices. So does a country.
China is the only large economy who had controlled all transmissions of the SARS-CoV-2 virus
before 21 February 2022. 155,729, the number of people of infection from 1st March to 3rd April
2022, is a tiny portion of the population, specifically as 1/9,000, indicating that the past month is
still a very early stage of the March outbreaks.

Morbidity differences and unpredictability

There existed cities twenty-fold differences in morbidity rates during the March outbreaks.
Omicron BA.2 subvariant is unpredictable of neither its transmission nor its morbidity rate and its
virulence6. There had been obvious differences in morbidity rates between the ten cities since
the start of the March outbreaks. Their morbidity rates varied from 4% to 83%, with the lowest in
Shanghai and the highest in Changchun, and 55% for the nationwide average except Shanghai, as
shown in the follow figure. Additionally, the nationwide average rate was 37% (Fig. 2).
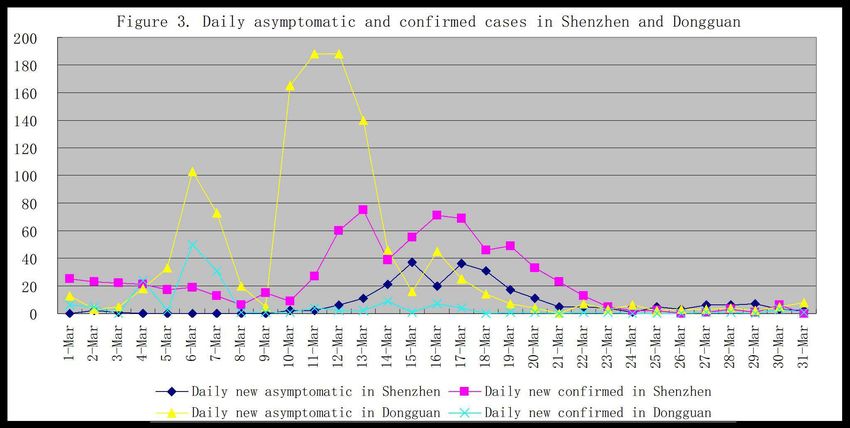
These obvious differences of morbidity rates indicate a difficulty in predicting the outcome of
new outbreaks. And Morbidity rate in a city did not fluctuate much during most of the outbreak
days. Take Shanghai as an example, rapid expansion of numbers of daily reported new confirmed
cases rise sharply appeared, and the number reached over 20,000 per day within a period of 23
days, with a total actual number of 90,352 people to be infected by 31 March 2022. The
morbidity rates of daily new cases in Shanghai ranges from 8% to 0% over 29 days of the whole
month (36 days). The morbidity rate of total confirmed cases is 4% by 4 April 2022.

The reason why there are such differences is unknown. They are not related to any of the
influence factors known today. There are two pairs of cities that can be compared since two cities
of each pair are very close to each other, and both have the same climate, population density
and characteristics, diet and living habits, religious background, education background and
medical resources. Shenzhen and Dongguan, both adjacent to Hong Kong, are also adjacent. Both
are located on the eastern bank of the Zhujiang Delta, which has a very high population density
of 11 to 18 million people on approximately 960-770 square miles of land each (7,8,9). Both being
immigration cities (portion of domestic immigrants being 50% and above in the population), the
average ages of their population are relatively young, Shenzhen at 32.5 years and Dongguan at 34
years on 1st November 2020 (8,9).

Outbreaks started from the end of February in both Shenzhen and Dongguan and resulted in 994
confirmed cases in Shenzhen and 1,314 confirmed cases in Dongguan in one month.
Contradictory figures of the morbidity rate of the two cities appeared from the very beginning,
starting from 100% to 92% in Shenzhen and 68% to 0% in Dongguan (Fig. 3). Each of these two
outbreaks developed simultaneously on its own path of morbidity rate, and their rates seemed
unlikely to change much until they were close to being controlled by stronger anti-epidemic
measures. The difference in their final rates, which was 75% in Shenzhen and 12% in Dongguan
by 4 April, was still enormous. Their final morbidity rates were close to their initial rates, although
daily rates showed strong fluctuation due to fewer daily new cases. One essential event was a
whole-area lockdown in Shenzhen, including 11 districts, for one week starting from 14 March
2022, which was announced in the evening of 13 March 2022. On 18 March 2022, the Shenzhen
authority canceled the lockdown of 5 districts with “zero active COVID-19 cases”. The final
termination of the lockdown started at 00:00 on 21 March 2022.

Dongguan’s outbreaks do not follow the expansion pattern of its neighbor Shenzhen, as shown
the figures above. A similar pairs of cities are Changchun and Jilin, which are the first two large
cities in Jilin Province in northeastern China and are approximately 111 kilometers apart, with a
much larger scale of outbreaks, reaching a total number of cases of infection as 34,395 in
Changchun and 27,878 in Jilin. The outbreaks started in Jilin on 03 March 2022 and Changchun’s
outbreaks followed one day after Jilin. Their morbidity rates also differed from the beginning, and
their levels seemed steady, with Changchun’s approximately 85% and Jilin’s approximately 50%.
Jilin’s number of daily new cases is declining steadily from its peak on 26 March 2022 while
Changchun is on its platform. The average morbidity rates are 83% in Changchun and 54% in Jilin
by 4 April 2022 (Fig. 4).

Shanghai’s outbreak had a very slow start. But from 13 March on, the numbers of daily reported
new confirmed cases rose sharply and reached 17,057, whereas a total of 90,000 people were
infected, by 4th April 2022. The morbidity rates of daily new cases in Shanghai ranged from 8% to
0% over 28 days in the whole period of 35 days (Fig. 4). The morbidity rate of total symptomatic
cases was 4% (blue line, by 31st March as well as by 4th April). As a city with the most critical
number of confirmed cases among the three (the other two are Chungchun and Jilin), Shanghai’s
morbidity rate was the steadiest among the ten cities.

Omicron BA.2 transmission unpredictable

The transmission of Omicron BA.2 is unpredictable, nor is its morbidity rate. Chinese cities are
more like isolated islands than those of other countries because of strict prevention measures.
This Omicron BA.2 subvariant seems to have developed a different pattern of virulence and
transmission in these isolated cities of China. Among the ten cities with outbreaks in March, half
had a very low morbidity rate, including Shanghai (4%), Langfang (8%), Binzhou (10%), Dongguan
(12%) and Shengyang (18%). On the other hand, these five cities have a very high percentage of
asymptomatic cases of infection, including Shanghai (96%), Langfang (92%), Binzhou (90%),
Dongguan (88%) and Shengyang (82%). Two cities had high morbidity rates: Shenzhen (75%) and
Changchun (83%). All data were updated to 31 March 2022.

The severity rate and fatality rate are low. Nationwide data of China showed a percentage of
0.10% for the ratio of the severe cases to the symptomatic cases in March. Jilin Province recorded
0.13% of the severs cases in the symptomatic cases in the period off 1st March to 4 April. The
fatality rate is less than 1/80,000, as 2 deaths were reported by Jilin on 18 March 2022.

Fewer cases needed hospitalization. Only Jilin Province published the data of the classifications of
diagnosed COVID-19 patients daily. Jilin’s data showed that 99.14% of the confirmed cases were
diagnosed as mild and 0.42% of the confirmed cases were diagnosed as moderate, and 0.07%
were diagnosed as severe in Jilin Province. 0.49% of the total confirmed cases needed
hospitalization according to the latest version the national Diagnosis and Treatment Protocol for
COVID-19 Patients. Recovered cases returning to positive were not reported but were estimated
to be approximately 1%, close to the figure announced by Shenzhen 3rd People’s Hospital on a
news release in March 2022.

The ratios (possibilities) of the asymptomatic cases converting to the symptomatic cases were 4%,
1.6%, 0.3% and 4.12%, respectively, in Jilin Province, nationwide excluding Shanghai, Shanghai
and nationwide including Shanghai, from 1st March to 4 April.

Worries of sudden impact to medical system

The data in Jilin Province showed 0.49% of the confirmed cases needed hospitalization (following
guidance of the national Diagnosis and Treatment Protocol for COVID-19 Patients)10, including
0.07% of severe or critical cases. The Chinese version of the national Diagnosis and Treatment
Protocol for COVID-19 Patients (Tentative 9th Edition) was published on 19th March 2022. Its
English version has not been published yet. There is obvious difference in “Chapter XI Treatment”
between the 9th edition and the 8th11. The symptomatic and mild cases will not be treated in
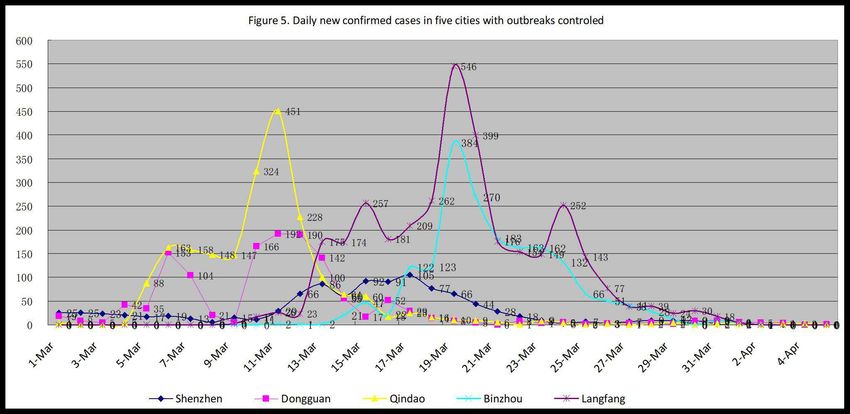
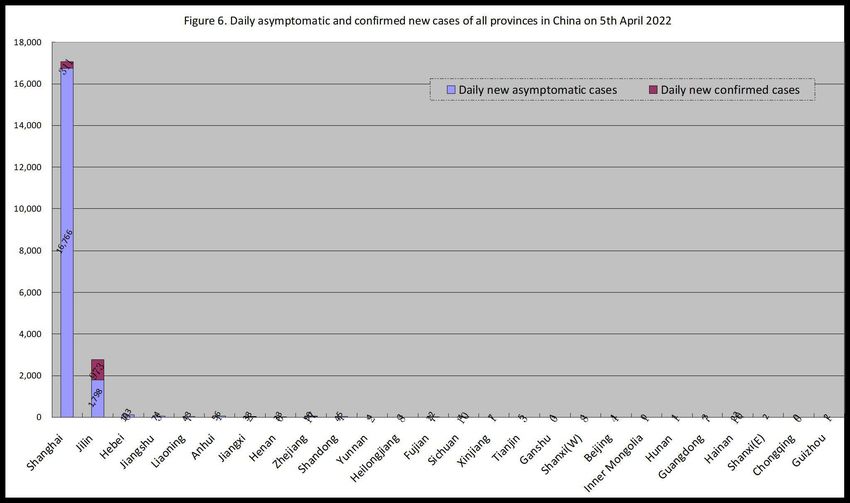
designated hospitals according to the 9th edition.

According to the data published by press conferences of the government of China and Hong
Kong Administrative Region, there were 6.4 hospital beds per 1,000 persons in China and 5.5 in
Hong Kong. The medical system of Hong Kong was lashed breakdown by the outbreak of
Omicron BA.2 in February. There would be no reason to be believed that China can avoid the
breakdown of its medical system.

Scientists say the ratio of the critical patients in total number of the severe patients is as high as
35 to 50 in Jilin Province. Since there are only estimated basic reproduction number (R0) of
Omicron BA.2 ( which might be up to 10 as some scientists indicted), the estimation of the
need of hospital beds relies on the support of the sample survey in HK which indicated a
minimum of 60% of the population to be infected in 50 days. According to such data and the data
in this article, the number of hospital beds China might need is 4,150,000 in 50 days of easing
restrictions, under the circumstances that the Omicron BA.2 keeps steady in morbidity rate with
the present trend, which is denied by the present data. And if nationwide outbreaks follow the
trend in Jilin Province in the future, a total number of 620,800 patients might be severe or up,
including 434,600 of critical patients in 50 days. It will definitely thump the medical system into
breakdown.

Successful zero clearing in some of the main cities

Among the ten cities of rapid expansion during the March outbreaks, five of them have reduced
to zero the number of their daily confirmed new case by 4 April 2022, as shown in Figure 5,
including Shenzhen, Dongguan and Qindao, Binzhou, Langfang. Their successful experiences give
a full confidence to the nation as well as the cities with the most critical situation, such as
Shanghai, Changchun and Jilin.

The following figure shows all the provinces (a total of 26) that had daily new cases on 4 April
2022. We can see clearly Shanghai and Jilin Province are the only two provinces that have been
mostly stressed in their battle with the outbreaks. On the day, Shanghai reported 16,766
asymptomatic cases and 311 symptomatic cases, whereas Jilin Province reported 1,798 and 973
accordingly. No other provinces reported daily cases more than 109.

Outstanding economy growth

It’s easy for people to get a conclusion that China’s “dynamic zero-COVID policy” is tremendously
costly. Such conclusion locks support of data. Data shows that the better a country minimized its
COVID-19 epidemics, the better economy growth they could achieve. The GDP growth rate of
USA was -3.5% in 2020 (5.7% in 2021) while that of China was 2.3% (7.9% in 2021)12. USA’s CPI
rose 4.8% in 2020 (7% in 2021) while China’s CPI rose 2.5% in 2020 (0.9% in 2021), meaning a
much higher inflation in USA.

In much the Bureau of Statistics of China announced that China’s economy recovered better than
expectation in the first two months of 202213. I do not see the reason why China should give up
its “dynamic zero-COVID policy”.

Calculation of economy lost

There could not be many people who did not agree on that all provinces can control their
outbreaks except Shanghai and Jilin, since no province other than Shanghai and Jilin reported
more than 109 confirmed cases on 4 April 2022, a figure which could be considered to be easy to
control the outbreaks.

A presumed calculation based on the worst scenario of full lockdown in Shanghai, Changchun and
Jilin for 20 days. The national portion of economy of Shanghai, Changchun and Jilin are 3.78%,
0.62% and 0.14%, calculated with the data published by the press conference of the National
Bureau of China. Suppose that they production are zero, which is impossible, during the
lockdown, the daily economy loss of Shanghai, Changchun and Jilin will be 1.8 billion, o.3 billion
and 0.066 billion US dollars (at an exchange rate of 1 dollar to 6.4 RMB), and the three cities will
loss 43.32 billion dollars during twenty days, which is a portion of 0.02425% of China’s GDP in
2021.

Conclusion

The SARS-CoV-2 Omicron BA.2 subvariant can transmit rapidly even under the conditions of very
strict mandatory measures. Its transmission and morbidity rate in a specific area is unpredictable.
Enormous differences in morbidity rates may appear in different areas and may not be related to
any of the influencing factors known. Fifty-one percent of the confirmed cases were
asymptomatic in China during the March outbreaks (bias free of Shanghai) in 2022, and the
percentage of mild cases in symptomatic cases has been remaining higher than 99.30%. China
still has the choice better than the choice of co-existing with the SARS-CoV-2. The worries of the
breakdown of the medical system, the successful zero clearings in a half of the ten main cities
and the outstanding economy achievements in during the period of the Pandemic are also
essential reasons why China has been and will be adhering to its “dynamic zero-COVID policy”.
Although all know China will ease its prevention restrictions finally, it will adhere to its “dynamic
zero-COVID policy” for a long time before ending it. And it seems ready to achieve more.

Methods

We analyzed daily domestic cases (cases of infection between domestic travelers, as called
indigenous cases in China) of SARS-CoV-2 in mainland China from 21 February 2022 to 4 April
2022 (hereafter also called the March outbreaks) from publicly released data provided by the
National Health Commission of the People’s Republic of China (NHC). This was accessible through
the website of the National Health Commission News Daily Briefing (Http://en.nhc.gov.cn). The
National Health Commission releases daily updates on the number of confirmed (here meaning
symptomatic) and asymptomatic new cases, with a breakdown by province and cities, and severe
cases, deaths and recoveries nationwide. Sources of more information about this analysis are
COVID-19 epidemiological reports published daily by Provincial/Territorial branches of NHC and
press conferences held by Provincial/Territorial governments. CDC is a department of NHC in
China and the same is for its Provincial/Territorial branches. All data were updated to 4 April
2022.

Due to deficiency of COVID-19 testing or medical workers in some jurisdictions in some days,
there were sudden surges of cases in some days during the March outbreaks. A sudden surge of
cases might indicate a belated report but did not indicate a skew or underestimation of the total
number of COVID-19 in the population because all related cases were reported late when testing
and medical workers were sufficient. There may be some normalization of data or curves
according to need of appearance of figures or charts, but the original numbers of cases will be
stated in the supplementary files.
The same Criteria14 have been followed all over China for all COVID-19 related work including
testing, diagnosing, and classification of cases of infection. This analysis uses the word
“symptomatic” instead of the word “confirmed” (as NHC called), so as the word” confirmed”
instead of the word “infected”, as shown in the following related definitions and explanations:
   1. Confirmed cases are laboratory confirmed (SARS-CoV-2 PCR-positive) cases of infection by
   double samplings (nasal and pharyngeal swab specimens) and tests. Confirmed cases are
   composed of asymptomatic cases, symptomatic cases, and deaths.
   2. Asymptomatic cases are cases of infection without symptom or symptoms. Symptomatic
   cases are cases with symptom or symptoms, and are composed of mild cases, moderate cases,
   and severe cases (including critical cases).
   3. Morbidity rate is the ratio of symptomatic cases in confirmed cases in percentage.
   4. Case fatality rate is the ratio of deaths in confirmed cases, unless specifically stated.
   5. Severity rate is the ratio of severe cases, either in symptomatic cases or in confirmed cases
   in percentage. It is usually stated specifically as in symptomatic or in confirmed cases.

The converting of asymptomatic cases to symptomatic cases may happen at any time. The daily
numbers of such conversion are reported in some jurisdictions, specifically in Shanghai,
Changchun, Jilin and nationwide as a whole, but are not reported in others. Because of a
repeated report of daily converting cases (symptomatic cases converted from asymptomatic
cases days before are reported again in daily report as new asymptomatic cases once they are
diagnosed with symptom or symptoms), the numbers and ratios of the asymptomatic cases and
the confirmed cases should be deducted by daily numbers or ratios of conversion relatively so as
to get the actual numbers and ratios in the jurisdictions with daily conversion reported.
Percentages of conversion are shown in the section “Asymptomatic cases conversion” of this
study for estimation of impact to the related actual numbers and ratios in the jurisdictions with
conversion not reported

References

1
   Xinhua News Agency. (2021). China's population aging deepens with 18.7% aged 60 or above.
China's population aging deepens with 18.7% aged 60 or above- China.org.cn
2
  Lewis, D. (2022). Will Omicron finally overpower China’s COVID defences?. Nature, 604(7904),
17-18. doi: 10.1038/d41586-022-00884-z
3
   ai, Y. (2022). Rapid epidemic expansion of the SARS-CoV-2 Omicron BA.2 subvariant during
China’s largest outbreaks. https://doi.org/10.21203/rs.3.rs-1516063/v6
4
  Worldometers. (2022). Covid-19 Coronavirus Pandemic updates. COVID Live - Coronavirus
Statistics - Worldometer (worldometers.info)
5
   McMenain, E. et al. (2022). Preprint at medRix. https://doi.org/10.1101/2022.03.22.22272769
6
   Dai, Y. (2022). Rapid epidemic expansion of the SARS-CoV-2 Omicron BA.2 subvariant during
China’s largest outbreaks. https://doi.org/10.21203/rs.3.rs-1516063/v4
7
   Xiao, M, et. al. (2010). Acta Geographica Sinica 2010, Vol. 65, Issue (4): 443-453.
doi: 10.11821/xb201004006
8
   Statistics Bureau of Shenzhen Municipality. (2021).
http://tjj.sz.gov.cn/ztzl/zt/szsdqcqgrkpc/szrp/content/post_9138049.html
9
   Statistics Bureau of Dongguan. (2021).
http://tjj.dg.gov.cn/pczl/rkpc7/content/post_3524625.html
10
    National Health Commission of the People’s Republic of China. (2022). Full text: Diagnosis and
Treatment Protocol for COVID-19 Patients (Tentative 9th Edition). (ef09aa4070244620b010951b088b8a27.pdf 11 National Health Commission of the People’s Republic of China. (2021).Full text of DiagnosisandTreatmentProtocolforCOVID-19Patients(Tentative8thEdition).pdf (chinadaily.com.cn) 12 World Bank. (2021). Data Catalog. GDP ranking | Data Catalog (worldbank.org) 13 National Bureau of Statistics of China. (2022). Organization Chart. National Bureau of Statistics of China (stats.gov.cn) 14 National Health Commission of the People’s Republic of China. (2021).Full text of DiagnosisandTreatmentProtocolforCOVID-19Patients(Tentative8thEdition).pdf (chinadaily.com.cn)
Supplementary Files
This is a list of supplementary les associated with this preprint. Click to download.

    Cov22Apr05RSv2.xls
You can also read