Current State of Broadband Usage of Rural Communities in New Zealand
←
→
Page content transcription
If your browser does not render page correctly, please read the page content below
Current State of Broadband Usage of Rural
          Communities in New Zealand

                       Final Report

                           By

   Rural Broadband Usage Survey (RBUS) Project Team

School of Engineering, Computer and Mathematical Sciences
            Auckland University of Technology
                 Auckland, New Zealand

                       August 2018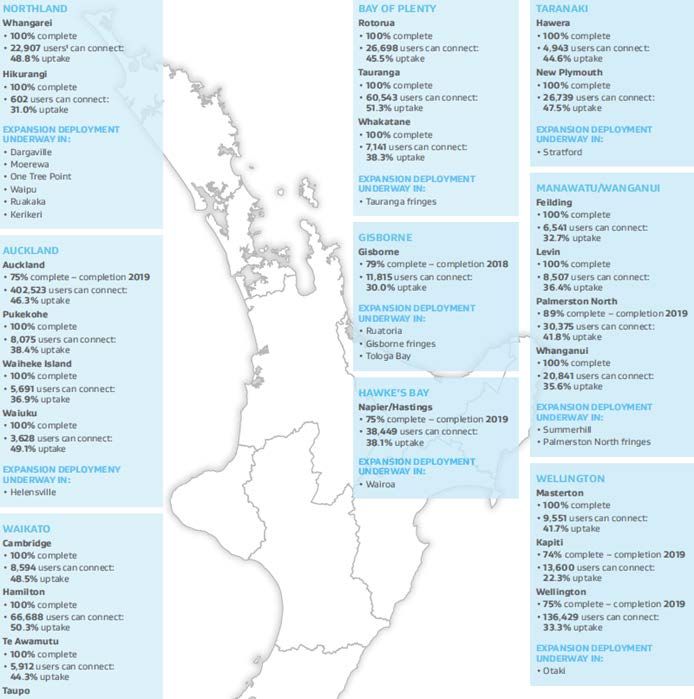
RBUS Project Team

Academic Staff Members:
   -   Dr William Liu
   -   Professor Edmund M-K Lai
   -   Associate Professor Jairo A. Gutierrez
   -   Dr Simon Xiang

Student Members:
   -   Rory Knight
   -   Louie Faundo
   -   Chung But
   -   Keli Liu
   -   Khodesh Temita
EXECUTIVE SUMMARY
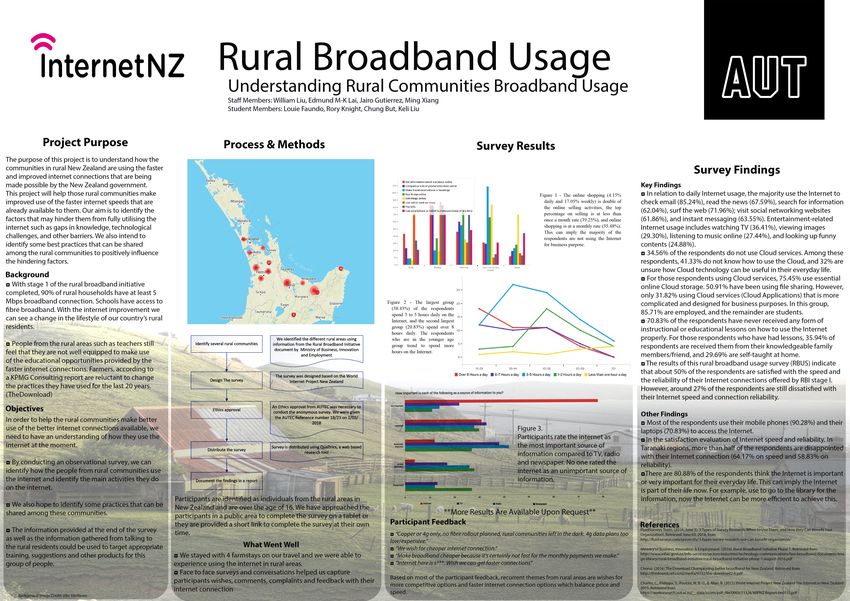
A statistical survey of rural residents in New Zealand’s North Island in relation to their current level of
broadband access and use was conducted. The goal of this survey is to understand how rural residents
and their communities are making use of the improved Internet connections through the Government’s
Rural Broadband Initiative (RBI). In addition, the drivers of Internet use that characterizes the importance
of the Internet to rural residents are explored. The survey data collection was conducted between
February and July 2018, and it had been undertaken from a down-to-earth, grassroots perspective with
face-to-face meetings with people living in rural areas. A total of 226 respondents had participated in this
survey.
The results of this rural broadband usage survey (RBUS) indicate that about 50% of the respondents are
satisfied with the speed and the reliability of their Internet connections offered by RBI stage I. However,
around 28% of the respondents are still dissatisfied with the Internet speed and connection reliability.
The majority of the Internet usage involves searching for basic information and news, online
entertainment and banking. There is still a high proportion of respondents who are unsure how else the
Internet can help them in their day-to-day activities, e.g., using cloud technology capabilities and online
marketing. A summary of the survey results is as follows.
• Most of the respondents use their mobile phones (90.28%) and their laptops (70.83%) to access
the Internet.
• Portable devices are most commonly used by those accessing the Internet at home. The top 3
devices are a mobile phone (93.06%), laptop (75.00%), and tablet (49.07%). For those accessing
the Internet at locations other than their homes, about 22.22% of the respondents use a desktop.
• The largest group (38.43%) of the respondents spend 3 to 5 hours daily on the Internet, and the
second largest group (20.83%) spend over 8 hours daily. The respondents who are a younger tend
to spend more hours on the Internet. The group spending over 8 hours daily can be broken down
by age into 16-29 (39.13%), 30-44 (20.37%), 45-59 (16.92%), and 60-69 (11.11%), with none 70
or above. This trend is similar for the 6-7 hour range. In the 3-5 hour range, 30-44 and 45-59 age
groups are the main contributors (61.45%) while for the 1-2 hour range, 45-59 and 60-69
constitute the biggest groups (71.79%). Finally, the 70+ age group is the main contributor to the
less than 1-hour range (36.36%).
• The online shopping (4.15% daily and 17.05% weekly) is double of the online selling activities,
the top percentage on selling is at less than once a month rate (39.25%), and online shopping is
at a monthly rate (35.48%). This can imply the majority of the respondents are not using the
Internet for business purpose.
• 70.83% of the respondents have never received any form of instructional or educational lessons
on how to use the Internet properly. For those respondents who have had lessons, 35.94% of
respondents are received them from their knowledgeable family members/friend, and 29.69% are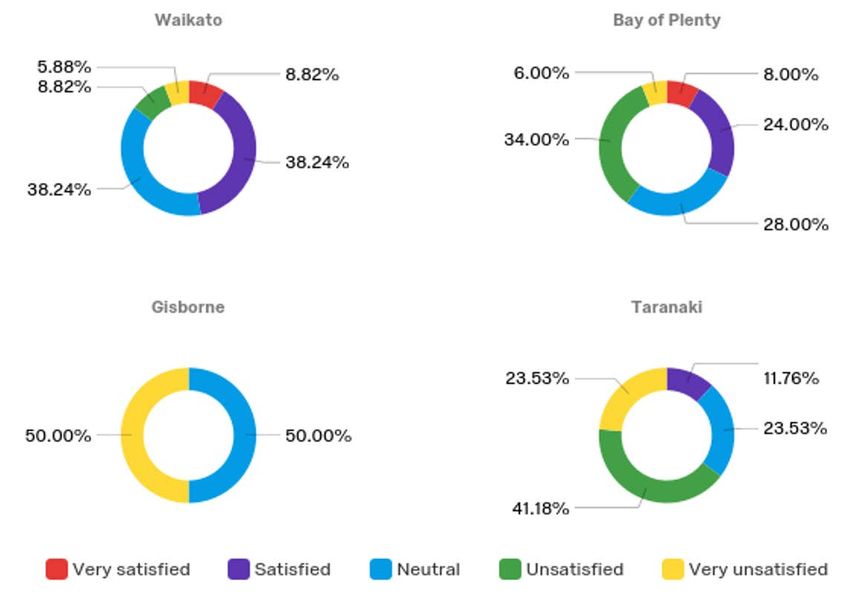
self-taught at home. Moreover, when asking these respondents if they are interested in learning
       more ways to make better use of the Internet, the majority answers are neutral (40.63%), which
       implies that they are not sure what additional benefits they can get from having these instructions.
   •   In relation to daily Internet usage, the majority use the Internet to check email (85.24%), read the
       news (67.59%), search for information (62.04%), surf the web (71.96%); visit social networking
       websites (61.86%), and instant messaging (63.55%). Entertainment-related Internet usage
       includes watching TV (36.41%), viewing images (29.30%), listening to music online (27.44%),
       and looking up funny contents (24.88%). However, very few use the Internet for business and
       other work-related matters such as selling online - only 2.8% daily and 8.88% weekly. Travel
       booking is about 4.17% daily, and comparing the prices of products or services online is about
       10.08%.
   •   34.56% of the respondents do not use Cloud services. Among these respondents, 41.33% do not
       know how to use the Cloud, and 32% are unsure how Cloud technology can be useful in their
       everyday life.
   •   For those respondents using Cloud services, 75.45% use essential online Cloud storage. 50.91%
       have been using file sharing. However, only 31.82% using Cloud services (Cloud Applications)
       that is more complicated and designed for business purposes. In this group, 85.71% are employed,
       and the remainder is students.

These findings could serve as a reference to inform those who wish to create, invest and take actions to
speed the economic and social growth of rural communities in New Zealand through Internet
connectivity, moving from volume to a more value-added rural economy.
ACKNOWLEDGMENTS

This research is the result of a New Zealand team effort, starting from a seed planted by an InternetNZ’s
research grant, with the nourishing and watering through meeting the various and diverse rural
communities, and finally, the fruits i.e., the final report (the key findings) harvested by the Rural
Broadband Usage Survey (RBUS) team, at the School of Engineering, Computer and Mathematical
Sciences in AUT.

We thank all the survey participants who have contributed to the valuable contents of this report. We
would like to thank Gertrud Kikajon from InternetNZ for her coordination and instant support for this
research project. We would like to thank our University Research Office’s Julia McPhee who helped us
coordinating with InternetNZ. We would also like to thanks our school managers Terry Brydon and Saide
Lo who always supported us on the financial management and administration of this grant. Moreover,
the community we met at InternetNZ’s NetHui 2017 has been a marvelous fountain source of
knowledge and experience on the rural subject, is supporting and inspiring us to move the project
forward. On the other hand, internationally, we would like to thank Dr. Arjuna Sathiaseelan, the previous
Founding Chair of IRTF Global Access to the Internet for All (GAIA) research group and the Director
of Networking for Development (N4D Lab) at the Computer Laboratory, University of Cambridge.
Currently, he is the CEO of the Ammbr Research Labs (part of the AmmbrTech group). Dr Sathiaseelan
had much input in the very early stage of discussions and preparations of the project proposal.

Last but the most important, we would like to acknowledge our sincere thanks to InternetNZ – without
this seeding grant, we will not have the chance to outreach out to our rural communities and understand
their needs in Internet communication.
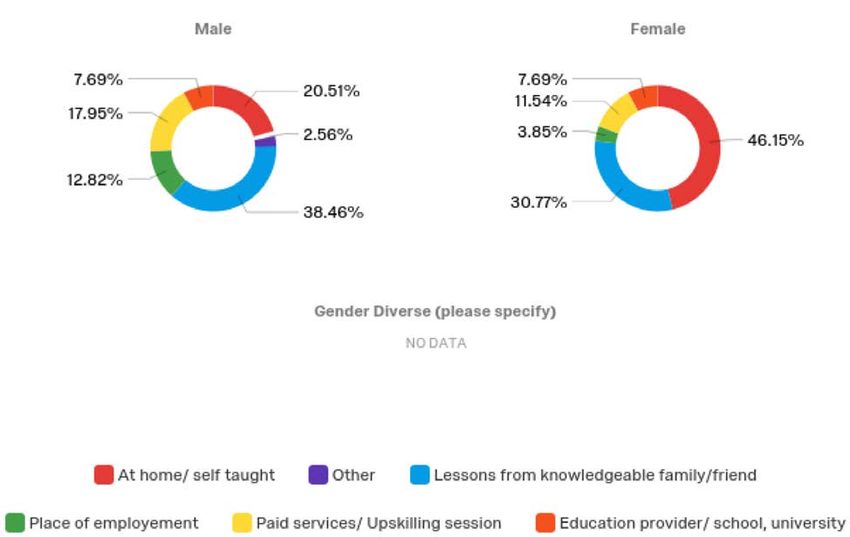
Table of Contents
   EXECUTIVE SUMMARY .............................................................................................................................. 4
   ACKNOWLEDGMENTS................................................................................................................................ 6
   CHAPTER I: INTRODUCTION................................................................................................................ 12
      Research Project Overview .................................................................................................................................... 12
      Research Objectives.................................................................................................................................................. 12
      Research Outcomes .................................................................................................................................................. 13
      Potential Benefits ...................................................................................................................................................... 13

   CHAPTER II: BACKGROUND .................................................................................................................. 14
      Related Studies .......................................................................................................................................................... 14
          World Internet Project New Zealand .................................................................................................................................. 14
          Auckland Rural Broadband Survey 2016 .......................................................................................................................... 15
          NetHui 2017................................................................................................................................................................................... 15

   CHAPTER III: METHODOLOGY ............................................................................................................ 16
      RBUS Design and Operation Planning ................................................................................................................ 16
          Research Question ...................................................................................................................................................................... 16
          Preliminary Operational Plan.................................................................................................................................................. 17
          Preliminary Timeline Plan ....................................................................................................................................................... 17
          Preliminary Sampling Plan ...................................................................................................................................................... 17
          Budget Plan .................................................................................................................................................................................... 18
          Ethics Approval Preparation................................................................................................................................................... 19
          Preliminary Analysis and Reporting Plan ......................................................................................................................... 19
      RBUS Questionnaire and Pretesting .................................................................................................................... 19
          Designing Questions ................................................................................................................................................................... 19
          Pretesting ........................................................................................................................................................................................ 22
      RBUS Final Survey Design and Planning ............................................................................................................ 22
          Details of Survey Questions ..................................................................................................................................................... 22
      RBUS Data Collection................................................................................................................................................ 22
      Analysis and Report.................................................................................................................................................. 22

   CHAPTER IV: SURVEY FINDINGS ......................................................................................................... 23
      Respondents’ Basic Information .......................................................................................................................... 23
          Age Groups ..................................................................................................................................................................................... 23
          Gender .............................................................................................................................................................................................. 24
          Regions ............................................................................................................................................................................................. 24
          Ethnicity .......................................................................................................................................................................................... 25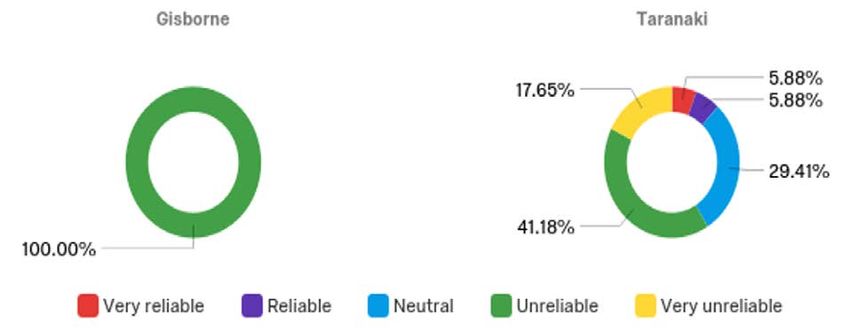
Employment Status..................................................................................................................................................................... 26
   Connection information .......................................................................................................................................... 29
       Devices used to connect to the Internet ............................................................................................................................ 29
       The devices respondents have in the household ........................................................................................................... 30
       Internet Connection Types ...................................................................................................................................................... 31
       Internet Services Providers..................................................................................................................................................... 32
       Time spent on the Internet ...................................................................................................................................................... 33
       Age group vs. Daily Internet time ......................................................................................................................................... 33
   Internet usage ............................................................................................................................................................ 34
       Information search ..................................................................................................................................................................... 34
       Entertainment ............................................................................................................................................................................... 35
       Social Networking ....................................................................................................................................................................... 37
       Business activities ....................................................................................................................................................................... 38
       Desired activities on the Internet ......................................................................................................................................... 41
       Cloud ................................................................................................................................................................................................. 42
       Cloud usage .................................................................................................................................................................................... 42
       Cloud usage vs. Gender ............................................................................................................................................................. 43
       Cloud usage vs. Employment Status .................................................................................................................................... 44
       Reasons for not using cloud services .................................................................................................................................. 45
       Reasons for not using the Cloud vs. Gender ..................................................................................................................... 46
   Knowledge and Skill on Internet.......................................................................................................................... 47
       Self-evaluation on the ability to the use of the Internet.............................................................................................. 47
       Education on Internet ................................................................................................................................................................ 48
       Lessons Evaluation ..................................................................................................................................................................... 49
       Further interests in learning .................................................................................................................................................. 50
       Source of Internet education .................................................................................................................................................. 51
       Source of lesson vs. Gender ..................................................................................................................................................... 52
   Internet Usage Experiences ................................................................................................................................... 52
       Importance of Internet for everyday life ........................................................................................................................... 52
       Importance of Information sources ..................................................................................................................................... 53
       Information credibility .............................................................................................................................................................. 54
       Internet speed ............................................................................................................................................................................... 55
       Internet Reliability ...................................................................................................................................................................... 57
       Opinions on Rural Broadband Usage .................................................................................................................................. 59

CHAPTER V: CONCLUSION .................................................................................................................... 61
   Survey Findings ......................................................................................................................................................... 61
       Key findings ................................................................................................................................................................................... 61
       Findings on Devices .................................................................................................................................................................... 62

                                                                                                8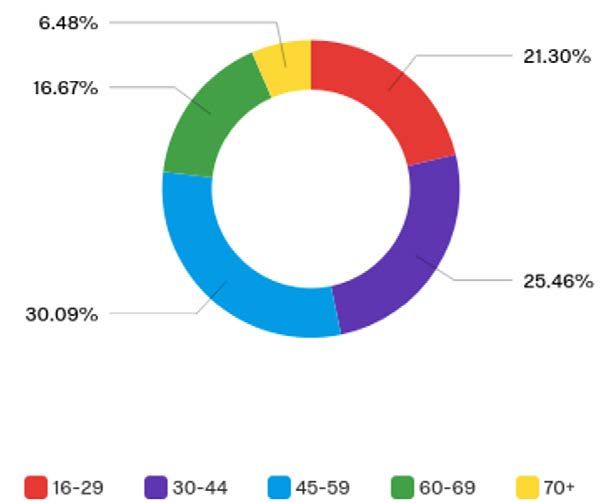
Findings on Internet usage ...................................................................................................................................................... 62
       Findings on Skill and Knowledge on Internet ................................................................................................................. 63
       Findings on Internet connection user experiences....................................................................................................... 63

REFERENCES .............................................................................................................................................. 64
Appendix A – Ethics Approval ............................................................................................................. 65
Appendix B - Presentation of Online Survey ................................................................................. 65
Appendix C - Information Sheet ......................................................................................................... 65
Appendix D–Poster ................................................................................................................................ 65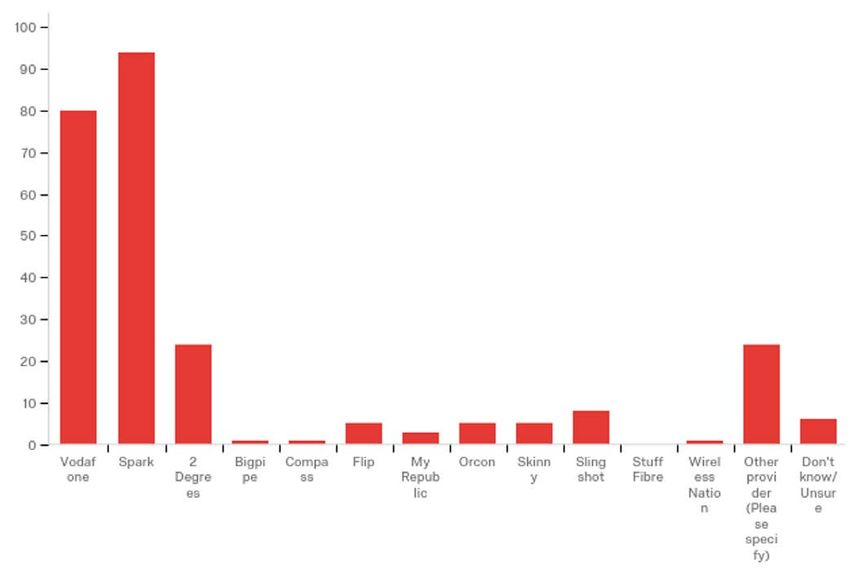
Figures
Figure 1 - Rural broadband usage survey (RBUS) process and timeline ................................................. 16
Figure 2 – RBUS region selection in North Island ................................................................................... 18
Figure 3 - The respondents' age groups .................................................................................................... 23
Figure 4 - The respondents' gender ........................................................................................................... 24
Figure 5 - The respondents' region ........................................................................................................... 25
Figure 6 – The respondents' ethnicity ....................................................................................................... 26
Figure 7 - The respondents' employment status........................................................................................ 27
Figure 8 – The categories approximate the industries the respondents are employed.............................. 28
Figure 9 The devices used to connect to the Internet in the past .............................................................. 29
Figure 10 - The devices that the respondents have in their houses ........................................................... 30
Figure 11 – The respondents' Internet connection type ............................................................................ 31
Figure 12 – The Internet services providers the respondents are currently using .................................... 32
Figure 13 - Internet time spending in hours .............................................................................................. 33
Figure 14 - Line chart showing the Internet hours’ trend vs. age ............................................................. 34
Figure 15 - Information search frequency ................................................................................................ 35
Figure 16 - The frequency of Entertainment activities on the Internet ..................................................... 36
Figure 17 - The frequency of social networking activities on the Internet ............................................... 37
Figure 18 - The frequency of business activities on the Internet .............................................................. 38
Figure 19 - The activities respondents like to do more of online ............................................................. 41
Figure 20 – Cloud usage ........................................................................................................................... 42
Figure 21 - Cloud usage chart ................................................................................................................... 43
Figure 22 - Cloud usage vs. Gender group ............................................................................................... 44
Figure 23 - Cloud usage vs. Employment status....................................................................................... 45
Figure 24 - The reasons for not using the Cloud ...................................................................................... 46
Figure 25 - Reasons for not using Cloud vs. Gender ................................................................................ 47
Figure 26 - Self-evaluation on the ability to use the Internet ................................................................... 48
Figure 27 – Received Instructional/educational lessons on how to use the Internet ................................ 49
Figure 28 - Lesson evaluation ................................................................................................................... 49
Figure 29 - Further interests in learning ................................................................................................... 50
Figure 30 - Source of Internet education .................................................................................................. 51
Figure 31 - Source of lesson vs. Gender ................................................................................................... 52
Figure 32 - Donut chart showing the critical level of the Internet to the respondents' everyday life ....... 53
Figure 33 - Importance of the information sources to respondents .......................................................... 54
Figure 34 - Information credibility ........................................................................................................... 55
Figure 35 - Internet speed satisfaction ...................................................................................................... 56
Figure 36 - Internet speed satisfaction level vs. region ............................................................................ 57
Figure 37 - Internet connection reliability ................................................................................................ 58
Figure 38 - Internet reliability vs. Region................................................................................................. 59

                                                                         10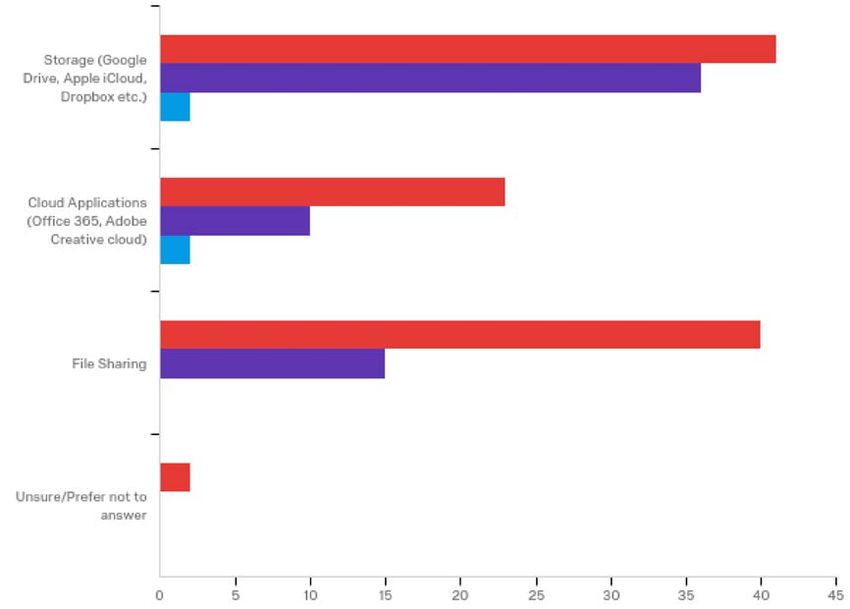
Tables
Table 1 - The respondents' age groups...................................................................................................... 23
Table 2 - The respondents' gender ............................................................................................................ 24
Table 3 - The respondents' regions ........................................................................................................... 25
Table 4 - The respondents' ethnicity ......................................................................................................... 26
Table 5 – The respondents' employment status ........................................................................................ 27
Table 6 – The categories approximate the industries the respondents primarily are employed ............... 28
Table 7 - Devices used for the Internet in the past ................................................................................... 30
Table 8 - The devices that the respondents have in their houses .............................................................. 31
Table 9 - Internet connection used by respondents ................................................................................... 31
Table 10 - Internet services providers currently the respondents are using .............................................. 32
Table 11 - Internet time spending daily .................................................................................................... 33
Table 12 - Age groups VS. Daily Internet time ........................................................................................ 34
Table 13 - Information Search frequency ................................................................................................. 35
Table 14 – The frequency of Entertainment activities on the Internet ..................................................... 36
Table 15 - The frequency of social networking activities on the Internet ................................................ 37
Table 16 - The frequency of business activities on the Internet ............................................................... 38
Table 17 - Agriculture/Farming vs. Internet usage ................................................................................... 39
Table 18 - Hospitality & Tourism vs. Internet usage................................................................................ 39
Table 19 - Retail vs. Internet usage .......................................................................................................... 40
Table 20 - Healthcare vs. Internet usage ................................................................................................... 40
Table 21 - The activities respondents like to do more of online ............................................................... 41
Table 22 - Cloud usage ............................................................................................................................. 42
Table 23 - Cloud usage table .................................................................................................................... 43
Table 24 - Cloud usage vs. Gender group................................................................................................. 44
Table 25 - Cloud usage vs. Employment status ........................................................................................ 45
Table 26 - The reasons for not using the Cloud ........................................................................................ 46
Table 27 - Reasons for not using Cloud vs. Gender ................................................................................. 47
Table 28 - Ability for using the Internet ................................................................................................... 48
Table 29 - Lesson evaluation .................................................................................................................... 50
Table 30 - Further interests in learning ..................................................................................................... 50
Table 31 - Source of Internet education .................................................................................................... 51
Table 32 - Importance of Internet to respondents' everyday life .............................................................. 53
Table 33 - Importance of the information sources to respondents............................................................ 54
Table 34 - Information credibility............................................................................................................. 55
Table 35 - Internet speed satisfaction ....................................................................................................... 56
Table 36 - Internet speed satisfaction level vs. region .............................................................................. 57
Table 37 – Internet connection reliability ................................................................................................. 58
Table 38 - Internet reliability vs. Region .................................................................................................. 59
CHAPTER I: INTRODUCTION

Research Project Overview
This research aims to gain a greater insight into how rural residents and their communities in New Zealand
are utilizing the improved Internet’s connection speeds provided through the Rural Broadband Initiative
(RBI). The key objectives are to capture how the rural residents of New Zealand use the Internet and to
identify the factors that may hinder them from fully utilizing the improved Internet connections provided
by the RBI.

Stage I of New Zealand Government’s Rural Broadband Initiative has been completed. This means that
90% of rural households having a decent 5Mbps broadband connection and schools have access to fiber
broadband. The RBI could make a significant change in lifestyle and wellbeing of the rural residents. This
research project attempts to reveal how rural residents and their communities are making use of these
improved Internet connections in their day-to-day activities.

Research Objectives
The major objectives of this research are:
   • To understand the current status of how rural New Zealander’s use their internet
   • To find out what our rural residents want to improve with the current Internet connection that
     they have
   • To provide the ways on how to use the Internet better and/or best practices so that our rural
     residents can maximize the use of the Internet to betterment their daily lives
   • To disseminate the findings to appropriate stakeholders that may help improve the technology or
     the way rural residents use the internet

Using the survey, we have captured the following:
   • How often the Internet is actively used by the survey participants
   • The devices that are used as well as the devices owned by the survey participants
   • The Internet service provider and the Internet connection that survey participants have
   • How important the participants find the Internet as well as how they rate themselves on their
     ability to use the Internet.
   • Activities and how frequent they do the activities using the Internet
   • The satisfaction and the reliability of the Internet connectivity perceived by the participants

                                                    12
We also want to conduct an analysis depending on the diversity of the Internet users, therefore the
following information is also captured:
• Gender: Male, female or gender diverse
• Ethnicity: the major ethnicities in New Zealand according to the NZ Census are Maori, Pacific
people, Asian, European, Middle Eastern, Latin American, African and other ethnicities.
• Region: the regions in the North Island that are covered by RBI Stage I – Northland, Auckland,
Waikato, Bay of Plenty, Gisborne, Taranaki, Manawatu-Wanganui, Hawkes Bay and Wellington
• Employment Status: Employed, unemployed, student, retired, home-maker or unable to work
• The industry that the participants work in.
Research Outcomes
Our goal is to gain a greater insight into how rural residents and their communities in New Zealand are
utilizing the improved Internet connection speeds. The opportunities provided by this insight will be the
identification of barriers such as knowledge gaps from which best rural usage practices can be
recommended. The practices and information provided by our project could be used by education and
business services to target appropriate training and other products for particular rural groups or
organizations.
The survey findings are provided in Chapter IV in the form of graphs. The results can help Internet NZ
and the rural communities have a greater understanding of their current connectivity as well as being
aware of the potential benefits of the faster Internet connections and better infrastructures.
Potential Benefits
Internet NZ, the New Zealand Government, and other potential stakeholders can use the findings from
this research to create, invest and take actions to speed the economic and social growth of rural
communities through Internet connectivity, moving from volume to a more value-added rural economy
The findings from this research can be used by the rural residents as a point of reference on how they are
using the Internet and learn how they can use the Internet better to improve their way of living.
The remaining parts of this report are organized as follows. Chapter II briefs the background and
motivations of this rural broadband usage survey project. The research methodology has been discussed
in Chapter III. Chapter IV presents the survey results and the statistical analysis. The key survey findings
are concluded in Chapter V.CHAPTER II: BACKGROUND
New Zealand’s landscape is changing. Rural areas are now being provided with access to faster broadband
connections, putting them on par with urban areas and allowing increased productivity due to maximizing
usage and understanding. With the Stage I of New Zealand Government’s Rural Broadband Initiative
(RBI) now completed, 90% of rural households have at least 5Mbps broadband connection (MBIE, 2016).
At the same time, a very high percentage of rural schools have access to fiber broadband. This
development can significantly change the lifestyle of these communities and enable them to attract 50,000
more young people into the primary sector over the next 10 years, which is the government’s target.
Furthermore, productivity gains in the primary sector and business development could be realized through
better use of technology of which Internet connections are vital.
The problem in fulfilling the potential gains through RBI seems to be the effective use of broadband.
According to Network for Learning, New Zealand schools’ managed network provider, most teachers still
feel that they are not equipped to maximize the education opportunities provided through fast broadband
(The Download, 2016, p.13). Farm enterprise specialists in KPMG Consulting report that most farmers
are reluctant to change practices they have used for the last 20 years (The Download, 2016, p.14) There
are loads champing at the bit to get Internet speeds that will allow them to innovate while their counterparts
in Europe are already using smart, online tools for everything from managing their accounts and budgets
to measuring the yields of their herds (The Download, 2016, p.13).
Current research is required to determine the level of usage, proficiency, and productivity achieved now
that stage 1 of RBI has been implemented. With the promises of stages 2 and 3, further research will be
able to assess these levels to a greater degree and provide more insight into broadband usage in rural areas
of New Zealand.
This survey was mainly focused on usage behaviour among rural residents and their communities. The
main intent is to determine who accessed the Internet, via what medium, and if they felt it helped or
hindered their lives as a whole. It did not concentrate on what particular items they were accessing, as
each respondent is individual, and this varies over time in any case. While these activities related questions
were included in the survey, they were broad in context and appear only to determine the general type of
Internet usage.
The level of usage based on accessibility was the main reason for the study. There is no point in having
the best broadband available if the people do not/will not use it. The utilization of the Internet in this sense
is discussed in this study.
Related Studies
World Internet Project New Zealand
Previous indicators of satisfaction levels among rural broadband users were measured in the 2015 World
Internet Project New Zealand survey. These results found that rural users on average are less satisfied with
both the reliability and speed of their service (Crothers et al., 2016).
14Later studies broadened the survey material to include questions relating to the credibility of information online, reflecting the attitudes of global affairs in regards to the ‘Fake News’ phenomena. The 2017 World Internet Project New Zealand, published in 2018 addressed similar topics as this survey such as reliability on the Internet. “80 percent of participants felt that at least half of the information they found on the internet was reliable appears extremely high” (Díaz Andrade, A. 2018). Our study showed that only 52.14% trusted online contents. That indicates a level of distrust in the online community. This indicates changing views over time. Respondents do not appear to trust the information as they initially did. This is likely a reflection of the recent politicization of ‘Fake News’ and decreased trust of online sources. Auckland Rural Broadband Survey 2016 The Auckland Rural Broadband Survey (ARBS) 2016 was another study which examined the usage and views of rural Internet users, although the sampled area was geographically restricted to just the fringes of the Auckland region. Findings of this survey, which received 991 responses, noted that the main Internet activities in rural Auckland were news and information, followed by work (87% and 80% of respondents respectively). Most participants (81%) also reported they felt their Internet connections were inadequate, with “almost half of the respondents experiencing a very slow Internet connection and frequent dropouts when connected” (Rohani et al. 2016). The ARBS was an influence on the current study, as their observations were instrumental in the research this project desired to see. Therefore, we expanded the study on a larger scale with a scope greater than just the Auckland region. This study attempts to encompass the North Island of New Zealand; areas such as Northland, Auckland, Waikato, Bay of Plenty, Gisborne, Taranaki, Manawatu-Wanganui, Hawkes Bay and Wellington. NetHui 2017 NetHui is an annual community event supported by InternetNZ which began in 2011. It hosts a variety of informative events, talks, labs and sessions centered around New Zealand’s Internet. Each year pertains to a certain theme for discussion, with 2017 being ‘Trust and Freedom’. Centred under this was a multitude of discussions related to rural Internet usage such as Maori Digital Futures, Identifying and Bridging Digital Divides, Digital Inclusion & Literacy as well as Rural Connectivity (NetHui, 2017). Moreover, the considerations and discussions of topics such as identifying and bridging digital divides, digital inclusion (Elkhatib, 2015) and rural connectivity (Villapol et al. 2017) were instrumental in inspiring this research in regard to rural Internet users. Recurrent points of discussion such as the ‘digital divides’ that are present in different regional and socio-economic groups of the population became apparent when discussing Internet technology access and utilization. Information from the NetHui was valuable in deciding areas to include in our survey. All areas deserve equal access regardless of their socio-economic status.
CHAPTER III: METHODOLOGY

We conducted this rural broadband usage survey (RBUS) research project based on the 5 stages of a
survey (Blair, 2013) including (1) RBUS design and operation planning, (2) RBUS pilot testing, (3)
RBUS final survey design and planning, (4) RBUS data collection, and (5) RBUS Data Analysis and
Final Report stage as shown in Figure 1 below.

                       Figure 1 - Rural broadband usage survey (RBUS) process and timeline

RBUS Design and Operation Planning
This first stage is to define a research question/problem and preliminary plans.

Research Question
As stated in the first chapter, this survey objective is to understand the current level of Internet access
and usage by the rural residents. Therefore the main research question is:
 “What is the current stage of rural residents making use of improved Internet connections through RBI
?”

One of the potential solutions to answer the above question is to develop a tool (which can be either
hardware or software) to monitor the Internet daily usage of rural residents, based on the assumption
that the tool can accurately provide an observation report gathered from most of t h e Internet usage by
the rural residents. However, this solution is expensive and also requires a great amount of time for

                                                       16
development, deployment, and assessment. Moreover, potential participants may not accept it because
there are information security and privacy concerns to be addressed. With limited time and budget, we
aimed at understanding rural residents’ Internet broadband use. Hence, we considered a statistical survey
as a research tool that could address the research question as well.
Preliminary Operational Plan
In the first stage, we listed major tasks to be conducted from the beginning to the end of the project as
follows:
1. Rural broadband usage review
• To review possible rural broadband usage from the literature
• To scope the rural broadband usage that is to be studied in the survey
• To develop and submit an ethics application to the Auckland University of Technology
Ethics Committee (AUTEC)
2. Preparation of survey questions
• To design and refine survey questions
• Cross-checking the survey questions
• To get feedback from this survey via some participants met in InternetNZ’s NetHui (between
9th – 10th September 2017)
3. Sample selection
• To determine survey participants/sample
4. Survey data collection
• To collect data via a face-to-face survey service (once ethics approval has been received),
for ensuring the participant is a rural resident
5. Survey data analysis
• To analyse the collected survey data
6. Reporting the survey findings
• To report the survey findings in the form of a report
• To analyze and identify the knowledge gaps
Preliminary Timeline Plan
The project was initially planned to conduct between 1 of July 2017 and 1 of July 2018.
Preliminary Sampling Plan
Originally, when this research was first proposed to InternetNZ, the rural area coverage of this survey
was crossing whole New Zealand. Later, after consulting with InternetNZ and also considering the
limited budget and time, we adjusted the scope of area coverage to North Island only. In conclusion, a
respondent who is eligible for this survey must meet the characteristic of being a resident living in thefollowing rural areas identified by the RBI Phase I report (MBIE, 2016).
Figure 2 – RBUS region selection in North Island
● Northland - Whangarei
● Auckland - Auckland, Pukekohe, Waiheke Island and Waiuku
● Waikato - Cambridge, Hamilton, Taupo, Te Awamutu and Tokoroa
● Bay of Plenty - Rotorua, Tauranga, and Whakatane
● Gisborne - Gisborne city
● Hawke’s Bay - Napier and Hastings
● Taranaki - Hawera and New Plymouth
● Manawatu/ Wanganui - Feilding, Levin, Palmerston North and Whanganui
● Wellington - Wellington, Kapiti, and Masterton
Budget Plan
The total amount of funding proposed is $15,000 for research assistants, survey design, conduction and
results in analysis and travel subsistence costs. The funds ($15,000) from InternetNZ had been planned
and spent on the core research activities as follows:
18• Research assistants ($ 6500)
o NetHui conference and Qualtrics survey tool up-skills training
o AUT Polo shirts and survey promotion materials
o Data analysis and final report written-up
• Survey costs ($ 8500)
o Design and pilot-testing
o Transportation, accommodations and a daily allowance for data collection in fields
o Car rental and petrol consumption
o Incentives (drinks, gift cards) to boom the face-to-face survey response rate
Ethics Approval Preparation
An ethics approval was planned to be developed and submitted to t h e Auckland University of
Technology Ethics Committee (AUTEC) in the format required by the Auckland University of
Technology.
The AUTEC require the researchers to provide the following items:
1. Application for Ethics Approval (EA1 form)
2. Participant information sheet to be declared to the survey respondents
3. Questionnaire planned to be used in this research
The ethics approval result is presented in Appendix A – Ethics Approval.
Preliminary Analysis and Reporting Plan
In the first stage, we planned to use Qualtrics (licensed to AUT) to create an online questionnaire
to the respondents which they can fill through the iPads carried by the data collectors. Qualtrics provides
analysis functions such as graph/chart generation, survey results search and filtering, and reporting
functions. We planned to report findings from analyzing the survey results and details of this
research project in a form of document (i.e. this final report).
RBUS Questionnaire and Pretesting
Designing Questions
Since the major objective of this survey is to capture the broadband usage of the rural residents in
their daily life, we designed a questionnaire to uncover their daily usage. To successfully engage
participants in this survey as many as possible, we tried to avoid using many questions or choices and
the questions are mainly classified into 5 groups (G1 – G5) as follows:Figure 3 Questionnaire structure and sensitive factors
1. Questions about respondents’ basic information (shortly called G1)
o To record the residents’ basic information (e.g. age group, geographical areas where
they are residing, gender etc.) which could be used for statistical inference
o To reveal possible patterned activities and usage types that the residents usually use the
Internet for
2. Questions about Internet connection information (G2)
o To check the Internet connectivity related information such as Internet provider, the
devices used to access the Internet
3. Questions about the Internet usages (G3)
o To understand w h a t t h e y use the Internet for and the type of contents accessed
4. Questions about the user’s knowledge and skills (G4)
o To check if the respondents have the proper knowledge and skills to use the Internet or
not, do they have a need for the further training
5. Questions about user experience (G5)
o To check if the respondents are satisfied with the improved broadband services by the
government initiatives i.e., RBI
The total number of questions used in this survey is 30. A letter Q following a unique number
abbreviates each question. For example, Q1 is the first question. The respondents were not expected to
answer all the 30 questions. This survey provides an adaptive questionnaire. That is, an answer chosen
by a respondent determines the next question. Hence, respondents may not see the same questions when
participating in the survey. The 30 questions can be classified into question groups (G1-G5) as follows:
20Note that the details of all the questions and their available choices are attached in Appendix B
• G1 – Questions about respondents’ basic information
o Q19: What is your age group?
o Q20: What is your gender?
o Q21: What is your ethnicity?
o Q22: Which region do you live?
o Q23: What is your current employment status?
o Q24: Which of the following categories best describes the industry you primarily work
in?
• G2 – Questions about Internet connection information
o Q1: How often do you actively use the Internet?
o Q2: Which devices have you used in the past from any location to connect to the
Internet? (Please select all that applies)?
o Q3: Which of the following devices do you have in your household? (Please select all
that applies)
o Q4: What Internet service provider are you currently with?
o Q5: What Internet connection is your household using?
• G3 – Questions about the Internet usages
o Q11: How often do you use the Internet for the following purpose?
o Q12: How often do you use the Internet for the following purpose?
o Q13: Which, if any, would you like to do more of on the Internet?
o Q14: How often do you do the following?
o Q15: How frequently do you use the following?
o Q6: Do you use Cloud?
o Q6a: What do you use the Cloud for?
o Q6b: What is your reason for not using the Cloud
• G4 – Questions about the user’s knowledge and skills
o Q8: How would you rate your ability to use the Internet?
o Q18: Have you ever received instructional or educational lessons on how to use the
Internet?
o Q18a: If yes, did you find the lessons useful?
o Q18b: How interested are you in learning more ways to make better use of the Internet?
o Q18c: Where/how did you get lessons on how to use the Internet?
• G5 – 5. Questions about user experience
o Q7: How important is the Internet in your everyday life?
o Q9: How important is each of the following as a source of information to you?o Q10: In your own opinion, how reliable is the information on the Internet?
o Q16: How satisfied are you with the speed of the Internet at your home?
o Q17: How reliable is the Internet at your home?
o Q25: Any wishes, comments, complains or feedback regarding your Internet? (This is an
open-ended question)
Pretesting
During designing the questionnaire, we pretested our questionnaire via two phases as follows:
1. Early Pretesting Phase – The objective in this phase is to quickly get feedback on a small set
of questions from a small group of samples
2. Pilot Survey Phase – The objective in this phase is to test the questionnaire using a small
group of pretesting samples.
RBUS Final Survey Design and Planning
Details of Survey Questions
As described above, the questionnaire had been improved several times during the pretesting phases.
Finally, there are 30 questions in total. The survey respondents did not need to answer all the 30
questions. The next question will be adaptively chosen for a respondent based on the respondent’s
choice/choices given to the current question he/she is taking. The maximum number of questions to
be answered by a respondent is 30, while the minimum number of questions to be answered by a
respondent is 27.
The presentation of all the web pages is depicted in Appendix B - Presentation of Online Survey.
RBUS Data Collection
We conducted data collection mainly by visiting those identified rural areas to reach rural residents in the designated
communities. We had invited the residents whenever we met them and ask help on filling the survey through the
three iPads we carried. Some survey flyers were distributed containing the online survey link (URL) for respondents
who wished to participate at a later stage. The survey data was monitored by using Qualtrics and data stored at
Qualtrics database.
Analysis and Report
In the final stage, we worked on the survey data analysis, created the report showing survey findings,
and wrote the final report. For the data analysis, we utilized the analysis functions available in Qualtrics
to produce statistical information and visualized diagrams. The details of t h e survey findings are
presented in Chapter IV: Survey Findings.
22CHAPTER IV: SURVEY FINDINGS
This chapter presents the findings of an analysis conducted on the survey data recorded by Qualtrics. In
this survey, the term of NZ rural Internet users is applied in reference to the qualified respondents. In
addition, the terms of NZ rural Internet users and respondents are used interchangeably in this report. The
findings are discussed in different sections as follows:
1. Respondents’ Basic Information
2. Connection Information
3. Internet Usage
4. Internet User Experiences
5. Internet Knowledge and Skill
Respondents’ Basic Information
There were 217 records in the survey. Moreover, not every respondent has completed all the survey
questions. Therefore, the total count for survey questions will be varied.
Age Groups
The age groups can be classified as 16-29, 30-44, 45-59, 60-69, and 70+ year-old groups. Table 1 and
Figure 3 present how the NZ Internet users are classified according to their ages. Most of the respondents’
age is from the 45-59, 30-44, and 16-29 age groups, which are 30.09%, 5.46%, and 21.30% accordingly.
Figure 3 - The respondents' age groups
Table 1 - The respondents' age groups
Age group Percentage Count
16-29 21.30% 46
30-44 25.46% 55
45-59 30.09% 65You can also read