Covid-19 healthcare facilities: accessibility contrasts in a Brazilian metropolitan city
←
→
Page content transcription
If your browser does not render page correctly, please read the page content below
Research, Society and Development, v. 11, n. 4, e8811426981, 2022
             (CC BY 4.0) | ISSN 2525-3409 | DOI: http://dx.doi.org/10.33448/rsd-v11i4.26981

Covid-19 healthcare facilities: accessibility contrasts in a Brazilian metropolitan city
Unidades de saúde para Covid-19: contrastes de acessibilidade em uma cidade metropolitana
brasileira
Instalaciones de salud para Covid-19: contrastes de accesibilidad en una ciudad metropolitana
brasileña

                                                    Received: 02/14/2022 | Reviewed: 02/21/2022 | Accept: 03/05/2022 | Published: 03/11/2022

                                                                                                   Luciano Heitor Gallegos Marin
                                                                                             ORCID: https://orcid.org/0000-0002-4331-6588
                                                                                                       Federal University of Paraná, Brazil
                                                                                                          E-mail: luciano.gallegos@ufpr.br
                                                                                                                 Bruno de Silva Sales
                                                                                             ORCID: https://orcid.org/0000-0003-1430-864X
                                                                                                 Aeronautics Institute of Technology, Brazil
                                                                                                    E-mail: bruno.silva0374@hotmail.com
                                                                                                     Jorge Luiz Bezerra de Araújo
                                                                                             ORCID: https://orcid.org/0000-0001-5101-6246
                                                                                                              University of Fortaleza, Brazil
                                                                                                              E-mail: jorgearaujo@unifor.br
                                                                                                           Regina Paiva Melo Marin
                                                                                             ORCID: https://orcid.org/0000-0002-4331-6588
                                                                                                            Goiano Federal Institute, Brazil
                                                                                                             E-mail: rpmmarin@gmail.com

       Abstract
       The Covid-19 outbreak changed the dynamic in cities around the world. To avoid the collapse in the healthcare system,
       several cities restricted or forbid people’s mobility to diminish the Covid-19 contagion. Meanwhile, a number of
       researchers developed online initiatives such as websites, apps and chatbots, to inform and guide people about the
       Covid-19 and its effects. In this paper, we combine data gathered from a dialogue chatbot that indicates healthcare
       facilities to individuals, with Covid-19 daily reports on new cases and mortality and demographic and socioeconomic
       factors to carry out analysis on geography and Covid-19 healthcare facilities in a major metropolitan city in Brazil.
       Results show that less wealthier areas are more populous, report high Covid-19 contagion level and request healthcare
       facilities locations more often. These findings shed light on Covid-19 healthcare facilities mobility patterns, which is
       influenced by area features and can be used to design and plan more equitable and accessible cities.
       Keywords: Covid-19; Healthcare facilities; Inequality; Data science.

       Resumo
       O surto de Covid-19 mudou a dinâmica nas cidades ao redor do mundo. Para evitar o colapso do sistema de saúde,
       muitas cidades restringiram ou proibiram a mobilidade das pessoas para diminuir o contágio da Covid-19. Enquanto
       isso, vários pesquisadores desenvolveram iniciativas online, como sites, aplicativos e chatbots, para informar e orientar
       as pessoas sobre o Covid-19 e seus efeitos. Neste artigo, combinamos dados coletados de um chatbot que possui a
       capacidade de indicar unidades de atendimento de saúde para indivíduos, com relatórios diários de Covid-19 sobre
       novos casos e mortalidade e fatores demográficos e socioeconômicos para realizar análises geográficas e unidades de
       saúde de Covid-19 em uma grande metrópole do Brasil. Os resultados mostram que as áreas menos abastadas são mais
       populosas, relatam alto nível de contágio de Covid-19 e solicitam com mais frequência indicações de unidades de saúde.
       Essas descobertas lançam luz sobre os padrões de mobilidade das unidades de saúde da Covid-19, que são influenciados
       pelas características da área e podem ser usados para projetar e planejar cidades mais equitativas e acessíveis.
       Palavras-chave: Covid-19; Unidades de saúde; Desigualdade; Data science.

       Resumen
       El brote de Covid-19 ha cambiado la dinámica en las ciudades de todo el mundo. Para evitar el colapso del sistema de
       salud, muchas ciudades han restringido o prohibido la movilidad de las personas para reducir el contagio de Covid-19.
       Mientras tanto, varios investigadores han desarrollado iniciativas en línea como sitios web, aplicaciones y chatbots para
       informar y educar a las personas sobre el Covid-19 y sus efectos. En este artículo, combinamos datos recopilados de un
       chatbot que tiene la capacidad de referir centros de atención médica a individuos, con informes diarios de Covid-19
       sobre nuevos casos y mortalidad, y factores demográficos y socioeconómicos para realizar análisis geográficos y de
       centros de atención médica de Covid-19 en una gran metrópoli de Brasil. Los resultados muestran que las zonas menos
                                                              1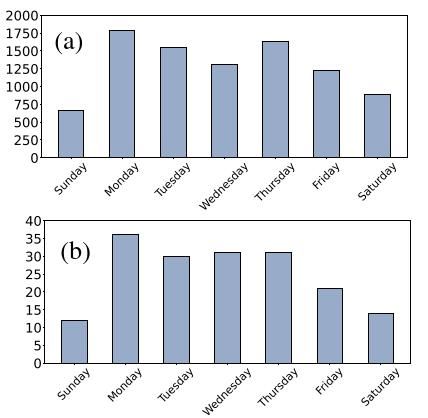
Research, Society and Development, v. 11, n. 4, e8811426981, 2022
                 (CC BY 4.0) | ISSN 2525-3409 | DOI: http://dx.doi.org/10.33448/rsd-v11i4.26981

         acomodadas están más pobladas, reportan un alto nivel de contagio de Covid-19 y solicitan indicaciones más frecuentes
         a las unidades de salud. Estos hallazgos arrojan luz sobre los patrones de movilidad de los establecimientos de salud de
         Covid-19, que están influenciados por las características del área y pueden utilizarse para diseñar y planificar ciudades
         más equitativas y accesibles.
         Palabras clave: Covid-19; Establecimientos de salud; Desigualdad; Ciencia de datos.

1. Introduction
         Fortaleza is the 5th largest capital in Brazil comprising 2.6 million inhabitants distributed in 121 neighborhoods
according to the 2010’s Brazilian census1. The city’s economy is organized into three main segments: industry, agriculture and
services, which represent 72% of its Gross Domestic Product – GDP. Fortaleza is quite dynamic and attracts tourists worldwide,
but the situation has changed since the Covid-19 outbreak.
         The Covid-19 is a disease caused by a new coronavirus variant, which was first observed in the city of Wuhan, China,
in December 2019. Symptoms generally include fever, dry cough, loss of taste, shortness of breath and in severe cases (which
affects on average 5 % of those infected (Lauer et al., 2020)), can reach pneumonia and death. Due to its high contamination
degree (Chakraborty & Ghosh, 2020), cases of Covid-19 are observed in several countries (Boulos & Geraghty, 2020). To avoid
the collapse in the healthcare systems, cities worldwide restricted or forbid people’s mobility to diminish the Covid-19 contagion
(Lau et al., 2020). Meanwhile, a number of researchers developed online initiatives to inform and guide people about the Covid-
19 and its effects. As an example, in Fortaleza a group of researchers, professors and students created the Dr. Health dialogue
chatbot2 which helps people to check their health conditions and Covid-19 symptoms and, if demanded, the indication of the
nearest healthcare location through geolocation (Gallegos, 2021).
         In this paper, we combine data gathered from Dr. Health healthcare facilities indications, with Covid-19 daily reports
and demographic and socioeconomic factors from Fortaleza to carry out analysis on geography and Covid-19 healthcare
facilities. Specifically, we use the Open Street Map API3 attached to the Dr. Health dialogue chatbot dataset to study individual’s
position and the nearest Covid-19 healthcare place in Fortaleza. We link Dr. Health dataset containing individual’s mobility to
the Covid-19 daily reports to map chatbot requests and Covid-19 contagion relationship. Then, we analyze properties of 121
neighborhoods located in Fortaleza by looking at demographic and socioeconomic factors, and combine the outcomes with Dr.
Health and Covid-19 daily reports. This allows us to link the Covid-19 contagion and Dr. Health chatbot requests from
individuals by neighborhoods in Fortaleza, including demographic and socioeconomics features.
         Results show that less wealthier areas are more populous and report higher Covid-19 contagion levels, and healthcare
facilities indications are requested more often. In particular, in these areas individuals have more access and shorter travels
distances to Covid-19 healthcare facilities, but they spend more time to reach these places. These findings shed light on Covid-
19 healthcare facilities mobility patterns, which is influenced by the area features and can be used to design more equitable and
accessible cities.
         The paper is organized as follows: in Section 2 related works are listed and described. In Section 3 datasets, databases
and the methodology applied are described. Then, in Sections 4 the results are detailed and in Section5 the final considerations
are developed.

2. Literature Revision
         In the work of Jeon-Young et al. (2020), the authors measure the spatial accessibility of Covid-19 healthcare facilities

1 Brazilian Institute of Geography and Statistics (https://www.ibge.gov.br/)
2 https://digital.fortaleza.ce.gov.br/saude/chatbot-dr-saude
3
  Open Street Map API (https://www.openstreetmap.org)
                                                                      2
Research, Society and Development, v. 11, n. 4, e8811426981, 2022
(CC BY 4.0) | ISSN 2525-3409 | DOI: http://dx.doi.org/10.33448/rsd-v11i4.26981
with a particular focus on Illinois, USA. They apply the Enhanced Two-Step Floating Catchment Area (E2SFCA) method
through a parallel computing strategy based on Cyber Geographic Information Science and Systems (cyberGIS) to calculate a
bed-to-population ratio for each hospital location, and then sum up these ratios for residential locations where hospital locations
overlap. Even though this work focuses in just one state, authors compare the spatial accessibility measures for Covid-19 patients
to those of population at risk, and identifies which geographic areas need additional healthcare resources to improve access. They
delineate the areas that may face a Covid -19-induced shortage of healthcare resources and identify vulnerable population
residing in the areas with low spatial accessibility.
Poverty and inequality during the Covid-19 outbreak is studied in Patel et al. (2020). Authors point out that for people
of low socioeconomic status, a number of factors increase their exposure to Covid -19: (I) economically disadvantaged people
are more likely to live in overcrowded accommodation, (II) financially poorer people are often employed in occupations that do
not provide opportunities to work from home, and (III) those in low socioeconomic status groups are more likely to have unstable
work conditions and incomes, conditions exacerbated by the responses to Covid -19 and its aftermath. Besides authorities saying
that ”Covid-19 does not discriminate”, this paper suggests the opposite: less wealthier communities are more affected by the
Covid-19 pandemic.
A consistent work on chatbots design and application to fight against Covid-19 pandemic is depicted in Miner et al.
(2020). In this work, authors describe advantages and drawbacks on how chatbots have been used for health-related purposes,
from supporting clinicians with clinical interviews and diagnosis to aiding consumers in self-managing chronic conditions. For
instance, chatbots can help at diagnosing diseases but cannot substitute medical doctors for prescribing drugs.
Inspired by these related works but exploring further approaches, we propose to use demographic and socioeconomic
factors, combined with Covid-19 contagion and chatbots datasets within a metropolitan city, and link these data with geolocation.
Our goal is to characterize differences between Covid-19 healthcare facilities in areas within Fortaleza city, Brazil, with diverse
demographic and socioeconomic factors, which may be related to differences at reaching nearby Covid-19 healthcare facilities.
3. Materials and Methods
Socioeconomic and demographic data of Fortaleza are collected from the Brazilian Institute of Geography and Statistics
– IBGE website4 comprising variables such as population, area, housing, income, education and life expectation. Health facilities
data on places apt of caring Covid-19 individuals are obtained from the Fortaleza’s official website 5 and the city neighborhoods
boundaries data from the Fortaleza Open Data website6.
A partnership between laboratories, universities, and public health department developed the IntegraSUS website 7: an
online platform based on health monitoring and management systems, first released in 2019 for transparency in the public health
service. The IntegraSUS is connected to a GitHub repository 8 from where we collected Covid-19 data from individuals reported
as infected or dead in Fortaleza, which are daily updated and freely available.
The Covid-19 encouraged a number of initiatives worldwide to aid people at finding health facilities such as mobile
apps, websites and chatbots, the latter being “conversational agents that leverage machine learning and natural language
processing to understand intents in order to reply with appropriate answers” (Judson et al., 2020). In Fortaleza, a group of
researchers, professors and students developed the Dr. Health conversational chatbot 9, which is available since mid-April 2020
and help individuals to check their health conditions and symptoms and, if demanded, provide the nearest public health facility
4
https://www.ibge.gov.br/
5
https://www.ibge.gov.br/
6
Fortaleza Open Data (https://dados.fortaleza.ce.gov.br/catalogo/dataset/limite-bairros)
7
https://integrasus.saude.ce.gov.br/
8
https://github.com/EscolaDeSaudePublica/coronavirusAPI/issues/17
9
https://drsaude.fortaleza.ce.gov.br/
3Research, Society and Development, v. 11, n. 4, e8811426981, 2022
(CC BY 4.0) | ISSN 2525-3409 | DOI: http://dx.doi.org/10.33448/rsd-v11i4.26981
displayed in an online map based on the individual’s request and his current location (Gallegos, 2019). Over the period of 45
days, we collect almost 10k unique interactions between anonymous users and Dr. Health, where a fraction of it is related to
healthcare facilities indications containing timestamp, day, lat-long coordinates of each individual’s origin and the nearest
healthcare facility destination based on the Open Street Map API, and average elapsed time into four different categories: by car,
by bus, walking and by bike (bicycle).
The algorithms developed in this work for the analysis are based on the Python Programming language and are
implemented using the Google Collaboratory10 online cloud service that mimics desktop notebooks environments, does not
require any configuration and has GPU’s availability allowing deep learning and image processing tasks (Bisong, 2019). The
Collaboratory has embedded functions and modules that minimize the coding needs with over 137.000 libraries and 198.826
packages (Carneiro et al., 2018).
4. Results and Discussion
Fortaleza has 121 neighborhoods and the data collected from IBGE, IntegraSUS and the Dr. Health conversational
chatbot are organized by these 121 areas. Our goal focuses on verifying contamination levels, the related user's origin-destination
to healthcare facilities, as well as relevant demographic and socioeconomic correlations.
Dr. Health database registers timestamp containing time, year, month and day from each user interaction. Timestamps
are formatted using the Python datetime library, where numeric date is converted into days of a week. Similarly, to the days of
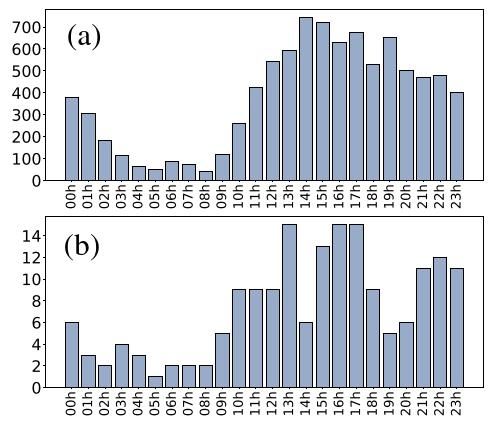
a week conversion, time is also manipulated to check when Dr. Health is mostly demanded per user and time. Considering the
45-period data collection, in Figure 1 we observe that (a) Dr. Health is mostly demanded in the afternoon until late night and (b)
from hour 10 and 24 for users that demanded healthcare indication.
10
https://research.google.com/colaboratory/
4Research, Society and Development, v. 11, n. 4, e8811426981, 2022
(CC BY 4.0) | ISSN 2525-3409 | DOI: http://dx.doi.org/10.33448/rsd-v11i4.26981
Figure 1: Dr. Health conversation per time. (a) Bar plot shows conversations of all users, while (b) bar plot represent the fraction
that demands the nearest healthcare indication.
Source: Authors.
We analyze the chatbot’s database to verify when it is mostly used: weekdays or weekends. The Figure 2 depicts picks
of use during weekdays rather than weekends, occurring in the set with healthcare indications (b) and the entire number of users
(a). From this result, one can speculate the reasons of this outcome which might happen due to different policy restrictions
(quarantines and lockdowns) or even to individual’s lifestyle during weekdays and weekends (Bwire, 2020; Gomes et al., 2020).
5Research, Society and Development, v. 11, n. 4, e8811426981, 2022
(CC BY 4.0) | ISSN 2525-3409 | DOI: http://dx.doi.org/10.33448/rsd-v11i4.26981
Figure 2: Dr. Health conversation per day. Users chat with the chatbot mostly during weekdays than weekends both on the set
of individuals who nearest healthcare indications (b) and the entire number of users (a).
Source: Authors.
A correlation analysis considering the 121 neighborhoods in Fortaleza between Dr. Health data, Covid-19
contamination, healthcare places, demographic and socioeconomic variables is also performed. We find a correlation of 0.59
(p≤0.05) between Covid-19 contamination and population, and 0.46 (p≤0.05) between population and Dr. Health healthcare
indications data per user, by neighborhood. We also find correlation between Covid-19 contamination and Dr. Health healthcare
indications data per user, by neighborhood, of 0.44 (p≤0.05). These results show that more populated neighborhoods are the
mostly contaminated, and coincidentally are the areas where individuals usually request the healthcare facilities indications from
the dialogue chatbot.
The Figure 3 shows Fortaleza and its neighborhoods, and a heat map layer grouping two variables: most affected areas
by Covid-19, and areas that individuals most use Dr. Health chatbot. Note that the more reddened is the areas, the greater the
ratio of individuals infected by Covid-19 and, consequently, the conversational chatbot is more demanded as well. This result
allows us to observe that areas most affected by the Covid-19 epidemic are basically the same areas that usually requests
information and healthcare facilities guidance from individuals. Note also that most Covid-19 affected areas are located at the
coastal zone (northwest region) and the west zone, which is similar as reported by the Fortaleza city hall 11. South and east zones
have sparse affected areas and thus the chatbot demand is lower.
11
https://g1.globo.com/ce/ceara/noticia/2020/07/31/meireles-aldeota-e-messejana-tem-maior-numero-de-casos-de-covid-19-em-fortaleza-veja-situacao-
nosbairros.ghtml
6Research, Society and Development, v. 11, n. 4, e8811426981, 2022
(CC BY 4.0) | ISSN 2525-3409 | DOI: http://dx.doi.org/10.33448/rsd-v11i4.26981
Figure 3: Fortaleza and its 121 neighborhood areas with a heat map layer grouping two variables: most affected by Covid-19,
and where individuals most use Dr. Health dialogue chatbot.
Source: Authors.
The Open Street Map API allow us to estimate travel time in minutes between the user location and the nearest
healthcare facility, by chatting with Dr. Health chatbot. The nearest path is calculated through streets and avenues as depicted in
Figure 4 into four categories: by car, by bus, walking and by bike. Fortaleza streets are narrow and usually have heavy traffic
jams between early morning and the evening, which reflects the median estimate travel time expended by cars (14 minutes),
buses (30 minutes), and bikes (18 minutes): for short travels and poor areas located at northwest, west and east, bikes are preferred
than buses; in richer areas located at the north and center, cars are preferred.
Figure 4: Estimate travel time in minutes between the user location and the nearest healthcare place into four categories: car,
bus, walking, and bike (bicycle).
Source: Authors.
The estimated travel distance of an individual and the nearest healthcare facility is shown in Figure 5(a) from Dr. Health
chatbot dataset, calculated using the Open Street Maps API. Results show that healthcare facilities with greater demand are
usually located in less wealthy and nearby individuals when compared to richer areas, a result the has no similarly in previous
works published about Brazil and worldwide (Pereira, 2021; Tanne, 2020; Kirby, 2008). Perhaps, this situation encouraged
individuals in poor areas to chat more frequently with Dr. Health, which demonstrates the increase use of chatbots in a variety
of situation (Adamopoulou & Moussiades, 2020; Dahiya, 2017).
7Research, Society and Development, v. 11, n. 4, e8811426981, 2022
(CC BY 4.0) | ISSN 2525-3409 | DOI: http://dx.doi.org/10.33448/rsd-v11i4.26981
Figure 5: (a) Estimated travel distance from an individual and the nearest healthcare facility. Demanded healthcare places are
usually located in less wealthier and closer from individuals (northwest, west and east sites), when compared to richer areas
(north and east sites). The (b) Radial distribution f(r) between the location of users and the nearest healthcare place shows that
healthcare places are the travel expended by users correspond to a small portion of the city’s average radius.
Source: Authors.
Finally, we analyzed the radial distances “R” between the most frequent users’ call points and their respective nearest
Covid-19 healthcare facilities indications. In Figure 5(b) a histogram of R of all requested travels is presented. On average R ≈
2.5km on travel distance travelled by users corresponding to a small portion of the city’s average commuting radius (Rcity ≈
10km) indicating that there are, in this sense, population areas grouped with healthcare facilities that can be characterized as
metapopulations sets (i.e., population in which individuals are spatially distributed in a habitat into two or more subpopulations)
(Arenas et al., 2020). In addition, the behavior of R works as a proxy for characterizing the visitor density profile around a region
and may, with appropriate approximations, be used as origin-destination relationships, which is fundamental to the diffusion
process for any disease among metapopulations. We believe that once Dr. Health dialogue chatbot becomes more popular, it
should be possible to use its dataset as a Covid-19 tracking tool among such metapopulations (Schlapfer, 2021).
Based on the above results on travel and time distances in this paper, one can speculate whether Covid-19 contamination
data depends on other demographic and socioeconomic independent factors. Outcomes highlight the following coefficients,
standard errors and p-values (** for P≤0.01, and *** for P≤0.001) for independent factors, respectively: Dr. Health interactions
6.5(2.1)***, life expectation 114.86(43.85)**, and income 282.60(66.61)***. About 84.56% of the variations with Covid-19
contamination as dependent variable is explained by changes in Dr. Health chatbot interactions, life expectation and income as
independent variables, by neighborhood. These results show that income and life expectation are related to Covid-19 contagion,
and the importance on the Dr. Health interactions data as an independent variable is explained by its relation with Covid-19
contagion data.
5. Final Considerations
In this paper, we combined data gathered from Dr. Health chatbot comprising healthcare facilities indications, Covid-
19 daily reports on new cases and mortality, and demographics and socioeconomic factors from a Brazilian metropolitan city
(Fortaleza, in Brazil) to carry out -analysis on geography and Covid-19 healthcare locations. The Open Street Map API attached
to the Dr. Health dialogue chatbot dataset allowed us to study individual’s position and their respective nearest Covid-19
healthcare place in Fortaleza, which was later related to Covid-19 daily reports to map chatbot requests and Covid-19 contagion
relationship. The features regarding the 121 neighborhoods located in Fortaleza were also analyzed by grouping demographic
and socioeconomic factors, and Dr. Health chatbot healthcare facilities indications to Covid-19 daily reports.
Results show that less wealthier areas report high Covid-19 contagion levels and request Dr. Health chatbot more often,
8Research, Society and Development, v. 11, n. 4, e8811426981, 2022
(CC BY 4.0) | ISSN 2525-3409 | DOI: http://dx.doi.org/10.33448/rsd-v11i4.26981
including cases where the nearest Covid-19 healthcare place is also demanded. Usually, areas where individuals are less wealthy
demand more time to commute to Covid-19 healthcare facilities due to the mobility options (bikes or buses), with greater
distances and more time spent. In contrast, although wealthier individuals are further away from Covid-19 healthcare facilities
in Fortaleza, they reach these places faster.
This paper has some limitations: Dr. Health dialogue chatbot dataset was limited to 45 days and the IntegraSUS data
from individuals reported as infected or dead may be outdated due to update delays. Also, our analysis is limited to the Fortaleza
city although it may reflect other tropical developing cities in countries worldwide. Even with these caveats, however the data
collections, analysis and findings shed light on Covid-19 healthcare facilities mobility.
Future works should consider to include people’s sociability within and between areas, commuting preferences, as well
as internet accessibility, for studying mobility patterns and best positioning healthcare facilities for Covid-19 in tropical cities.
Finally, for research purposes we suggest the application of the ideas described in this paper to other tropical cities worldwide.
We hope the findings described in this paper help researchers and policy makers in designing equitable and accessible cities.
Acknowledgments
Authors acknowledge the Fortaleza Municipal Health Department and the Fortaleza Foundation for Science,
Technology and Innovation for supporting this work with datasets and professional advices on public health care facilities and
Covid-19 attendance steps. Authors emphasizes that this work was developed voluntarily by its authors, without financial burden
to the Fortaleza city hall and its departments.
References
Adamopoulou, E. & Moussiades, L. (2020, June). An overview of chatbot technology. In IFIP International Conference on Artificial Intelligence Applications
and Innovations (pp. 373-383). Springer, Cham.
Arenas, A., Cota, W., Gómez-Gardeñes, J., Gómez, S., Granell, C., Matamalas, J. T., Soriano-Paños, D. & Steinegger, B. (2020). Modeling the spatiotemporal
epidemic spreading of COVID-19 and the impact of mobility and social distancing interventions. Physical Review X, 10(4), 041055.
Bisong, E. (2019). Building machine learning and deep learning models on Google cloud platform (pp. 59-64). Apress.
Boulos, M. N. K. & Geraghty, E. M. (2020). Geographical tracking and mapping of coronavirus disease COVID-19/severe acute respiratory syndrome
coronavirus 2 (SARS-CoV-2) epidemic and associated events around the world: how 21st century GIS technologies are supporting the global fight against
outbreaks and epidemics. International journal of health geographics, 19(1), 1-12.
Bwire, G. M. (2020). Coronavirus: why men are more vulnerable to Covid-19 than women? SN comprehensive clinical medicine, 2(7), 874-876.
Carneiro, T., Da Nóbrega, R. V. M., Nepomuceno, T., Bian, G. B., De Albuquerque, V. H. C. & Reboucas Filho, P. P. (2018). Performance analysis of google
colaboratory as a tool for accelerating deep learning applications. IEEE Access, 6, 61677-61685.
Chakraborty, T. & Ghosh, I. (2020). Real-time forecasts and risk assessment of novel coronavirus (COVID-19) cases: A data-driven analysis. Chaos, Solitons
& Fractals, 135, 109850.
Dahiya, M. (2017). A tool of conversation: Chatbot. International Journal of Computer Sciences and Engineering, 5(5), 158-161.
Gallegos, L. (2021, April). Using Collaborative Technologies for Chatbots’ Creation, Development and Delivery. In Anais Estendidos do XVII Simpósio
Brasileiro de Sistemas Colaborativos (pp. 141-142). SBC.
Gomes, C. M., Favorito, L. A., Henriques, J. V. T., Canalini, A. F., Anzolch, K. M., Fernandes, R. D. C., Bellucci, C. H. S., Silva, C. S., Wroclawski, M. L.,
Pompeo, A. C. L. & Bessa Jr, J. D. (2020). Impact of COVID-19 on clinical practice, income, health and lifestyle behavior of Brazilian urologists. International
braz j urol, 46, 1042-1071.
Jeon-Young, K., Michels, A., Lyu, F., Wang, S., Agbodo, N., Freeman, V. L. & Wang, S. (2020). Rapidly measuring spatial accessibility of COVID-19 healthcare
resources: a case study of Illinois, USA. International Journal of Health Geographics, 19, 1.
Judson, T. J., Odisho, A. Y., Young, J. J., Bigazzi, O., Steuer, D., Gonzales, R. & Neinstein, A. B. (2020). Implementation of a digital chatbot to screen health
system employees during the COVID-19 pandemic. Journal of the American Medical Informatics Association, 27(9), 1450-1455.
Kirby, J. B. (2008). Poor people, poor places and access to health care in the United States. Social Forces, 87(1), 325-355.
Lau, H., Khosrawipour, V., Kocbach, P., Mikolajczyk, A., Schubert, J., Bania, J. & Khosrawipour, T. (2020). The positive impact of lockdown in Wuhan on
containing the COVID-19 outbreak in China. Journal of travel medicine.
9Research, Society and Development, v. 11, n. 4, e8811426981, 2022
(CC BY 4.0) | ISSN 2525-3409 | DOI: http://dx.doi.org/10.33448/rsd-v11i4.26981
Lauer, S. A., Grantz, K. H., Bi, Q., Jones, F. K., Zheng, Q., Meredith, H. R., Azman, A. S., Reich, N. G. & Lessler, J. (2020). The incubation period of coronavirus
disease 2019 (COVID-19) from publicly reported confirmed cases: estimation and application. Annals of internal medicine, 172(9), 577-582.
Miner, A. S., Laranjo, L. & Kocaballi, A. B. (2020). Chatbots in the fight against the COVID-19 pandemic. NPJ digital medicine, 3(1), 1-4.
Patel, J. A., Nielsen, F. B. H., Badiani, A. A., Assi, S., Unadkat, V. A., Patel, B., Ravindrane, R. & Wardle, H. (2020). Poverty, inequality and COVID-19: the
forgotten vulnerable. Public health, 183, 110.
Pereira, R. H., Braga, C. K. V., Servo, L. M., Serra, B., Amaral, P., Gouveia, N. & Paez, A. (2021). Geographic access to COVID-19 healthcare in Brazil using
a balanced float catchment area approach. Social Science & Medicine, 273, 113773.
Schläpfer, M., Dong, L., O’Keeffe, K., Santi, P., Szell, M., Salat, H., Anklesaria, S., Vasifeh, M., Ratti, C. & West, G. B. (2021). The universal visitation law of
human mobility. Nature, 593(7860), 522-527.
Tanne, J. H., Hayasaki, E., Zastrow, M., Pulla, P., Smith, P. & Rada, A. G. (2020). Covid-19: how doctors and healthcare systems are tackling coronavirus
worldwide. Bmj, 368.
10You can also read


