Corporate Presentation - Consistently Delivering On Commitments July 2017 - Mining Data Online
←
→
Page content transcription
If your browser does not render page correctly, please read the page content below
Consistently
Delivering On
Commitments

   July 2017
                Corporate Presentation
Cautionary & Technical Statements
Cautionary Notes - Information Purposes Only
The information contained in this presentation is provided by OceanaGold Corporation (“OGC”) for informational purposes only and does not constitute an offer to issue or arrange to issue, or the solicitation of an offer to
issue, securities of OGC or other financial products. The information contained herein is not investment or financial product advice and has been prepared without taking into account the investment objectives, financial
situation or particular needs of any particular person. The views, opinions and advice provided in this presentation reflect those of the individual presenters only. No representation or warranty, express or implied, is made
as to the fairness, accuracy, completeness or correctness of the information, opinions and conclusion contained in this presentation. To the maximum extent permitted by law, none of OGC or any of its directors, officers,
employees or agents accepts any liability, including, without limitation, any liability arising out of fault or negligence, for any loss arising from the use of the information contained in this presentation. Furthermore, this
presentation does not constitute an offer of shares for sale in the United States or to any person that is, or is acting for the account or benefit of, any U.S. person (as defined in Regulation S under the United States
Securities Act of 1933, as amended (the "Securities Act")) ("U.S. Person"), or in any other jurisdiction in which such an offer would be illegal. OGC’s shares have not been and will not be registered under the Securities Act.

Cautionary Statement Concerning Forward Looking Information
Certain information contained in this presentation may be deemed “forward-looking” within the meaning of applicable securities laws. Forward-looking statements and information relate to future performance and reflect
OGC’s expectations regarding the generation of free cash flow, execution of business strategy, future growth, future production, estimated costs, results of operations, business prospects and opportunities of OGC and its
related subsidiaries. Any statements that express or involve discussions with respect to predictions, expectations, beliefs, plans, projections, objectives, assumptions or future events or performance (often, but not always,
using words or phrases such as “expects” or “does not expect”, “is expected”, “anticipates” or “does not anticipate”, “plans”, “estimates” or “intends”, or stating that certain actions, events or results “may”, “could”,
“would”, “might” or “will” be taken, occur or be achieved) are not statements of historical fact and may be forward-looking statements. Forward-looking statements are subject to a variety of risks and uncertainties which
could cause actual events or results to differ materially from those expressed in the forward-looking statements and information. They include, among others, the accuracy of mineral reserve and resource estimates and
related assumptions, inherent operating risks, and those risk factors identified in OGC’s most recent annual information forms prepared and filed with securities regulators which are available on SEDAR at www.sedar.com
under OGC’s name.

There are no assurances OGC can fulfil forward-looking statements and information. Such forward-looking statements and information are only predictions based on current information available to management of OGC as
of the date that such predictions are made; actual events or results may differ materially as a result of risks facing OGC, some of which are beyond OGC’s control. Although OGC believes that any forward-looking
statements and information contained in this presentation are based on reasonable assumptions, readers cannot be assured that actual outcomes or results will be consistent with such statements. Accordingly, readers
should not place undue reliance on forward-looking statements and information. OGC expressly disclaims any intention or obligation to update or revise any forward-looking statements and information, whether as a result
of new information, events or otherwise, except as required by applicable securities laws. The information contained in this release is not investment or financial product advice.

Technical Disclosure
The exploration results were prepared in accordance with the standards set out in the 2012 Edition of the ‘Australasian Code for Reporting of Exploration Results, Mineral Resources and Ore Reserves’ (“JORC Code”) and in
accordance with National Instrument 43-101 – Standards of Disclosure for Mineral Projects of the Canadian Securities Administrators (“NI 43-101”). The JORC Code is the accepted reporting standard for the Australian
Stock Exchange Limited (“ASX”) . For further scientific and technical information (including disclosure regarding mineral resources and mineral reserves) relating to the Haile Mine, the Macraes Mine and the Didipio Mine
please refer to the NI 43-101 compliant technical reports available at sedar.com under the Company’s name.

General Presentation Notes
▶ All AISC and cash costs are net of by-product credits unless otherwise stated
▶   All financials are denominated in US Dollars unless otherwise stated

         2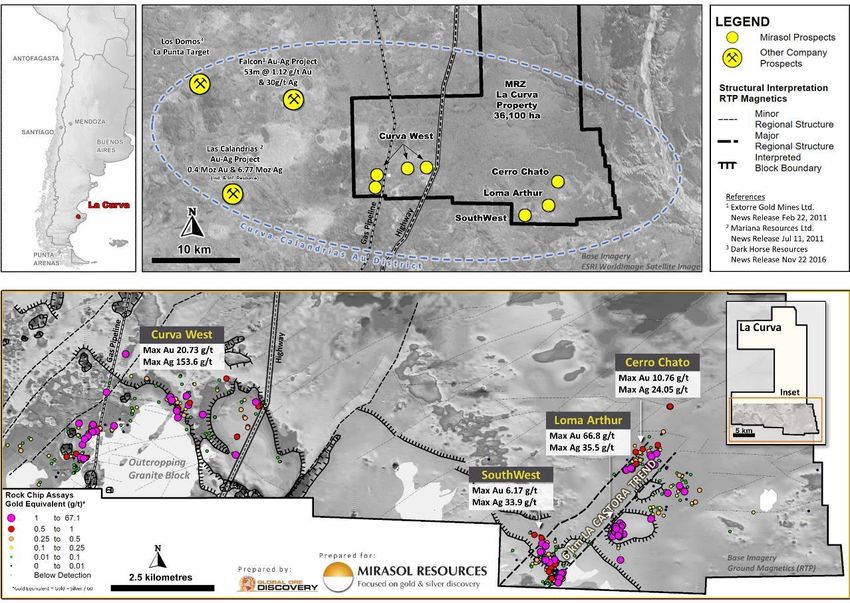
OceanaGold Overview
                           PORTFOLIO OF HIGH-QUALITY, GLOBALLY DIVERSE ASSETS

                                                            Revised 2017 Guidance
                       Gold                                          Copper                                            AISC
             550,000 – 600,000 ounces                         18,000 – 19,000 tonnes                         US$600 – US$650 per ounce
              (was 550,000 to 610,000 ounces)                     (was 15,000 to 17,000 tonnes)                              (unchanged)

             Corporate          Operation         Commissioning                                                    Market Metrics(1)
                                                                                                                   Market Capitalisation
                                                                                                                      C$2.6 billion

                                                                                                             Trading Liquidity (3-Mo Ave)
                                                                                                                 ~C$24 million / day
                                                Vancouver
                                                                                                  Shareholder Geographic Composition
                                                                                                                      Asia       Other
                                                                              Haile                                   3%
                                                                                LOM: 2034+                                        1%
                                                                                                             ANZ
                 Didipio                                                                                     9%
                    LOM: 2032+                                                                                                             United States
                                                                                                                                               44%

                                                                                                    Europe
                                                                                                     29%

                                     Waihi
                                        LOM: 2019+
       Melbourne
                                   Macraes                                                                   Canada
1.   As at 26 Jun 2017                 LOM: 2020+                                                             14%

         3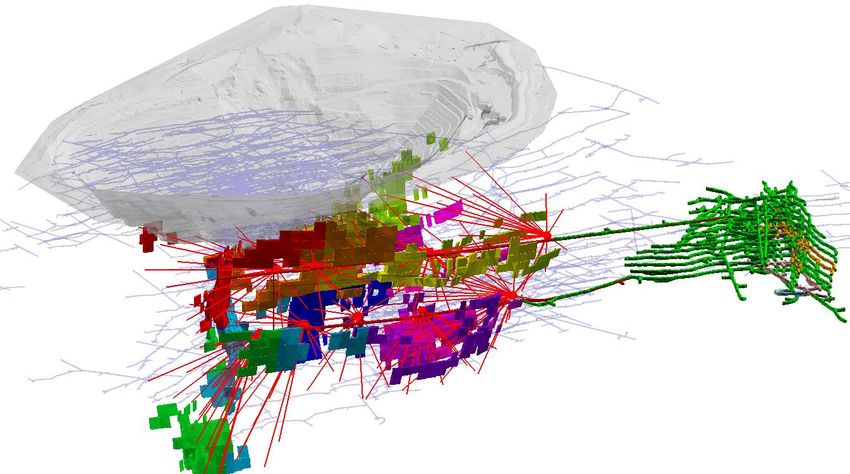
Financial Position (as at Mar 31, 2017)
     STRONG BALANCE SHEET & CASH FLOWS UNDERPINS SELF-FINANCING CAPABILITY

                                                                          NET DEBT / TOTAL ASSETS
                                  CASH
                                  $70.6 million                                    13%
                                  (does not include ~$90m in marketable
                Total Liquidity   securities)
                   $85.8m
                                  UNDRAWN FACILITY
                                  $15.2 million
                                                                                 NET DEBT

                                                                                  $262m
                                  EQUIPMENT LEASES
                                  $48.0 million
                    Total Debt
                     $332.8m      DRAWN FACILITY                            NET DEBT / EBITDA(1)
                                  $284.8 million
                                                                                     0.3
                                                                               (2017E Consensus)

1.   Source: Bloomberg

         4
Gold Mining Company of Choice
COMPELLING VALUE PROPOSITION FROM GROWING, HIGH-MARGIN GOLD PRODUCER

        Significant cash flow                                     Solid pipeline of organic    Delivering consistent
             generation                                            growth opportunities       positive results & value

                 AISC Margin(1)                                                               Return on Invested Capital(3)
                        (2017E)                                         Haile Expansion               (3-Year Average)

                 $575 / oz                                            Waihi Martha Project             13.3 %
         Free Cash Flow Yield(2)                                           Extensive global        EBITDA Margin(4)
                        (2017E)                                              exploration                 (Q1 2017)

                    10.6 %                                                                             62.8 %

Notes:
1. Based on the midpoint of Company’s 2017 Guidance at a gold price of $1,200/oz
2. CIBC Research (24 Apr 2017)
3. Bloomberg
4. Company results

         5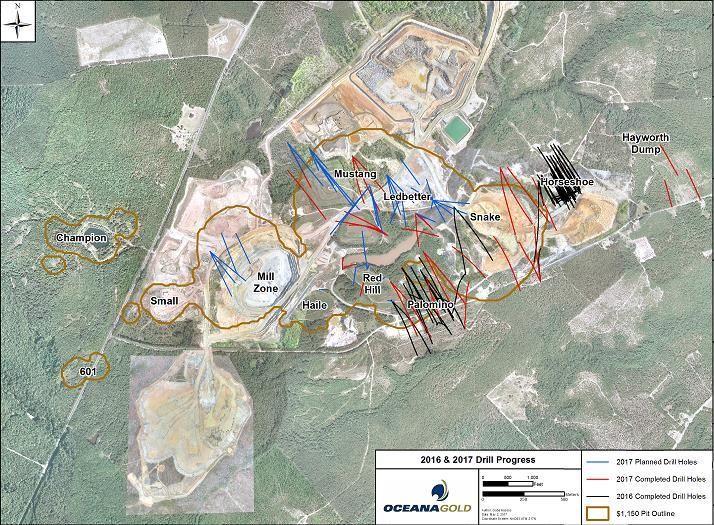
Consistent Positive Performance
                                                      CONTINUE DELIVERING ON OUR COMMITMENTS

                                                      5-Year Production and Cost Guidance Track Record
                                                                                         Number of Hits     Number of Misses
10

 8

 6

 4

 2

 0

-2

-4

-6
                                                                             DPM

                                                                                                BTO
     AEM

                                                 CG

                                                            NEM

                                                                                                                                                                                                         TMR
                                                                                                           EGO
                                                                                   KDX
                                                                                          PPP

                                                                                                                                  TGZ

                                                                                                                                                                                             DGC
                                                                       NGD

                                                                                                                 CDE

                                                                                                                                        TXG
           KGC

                                                                                                                                              ROXG
                                    SSRI

                                                                                                                                                                           AUY
                                                      THO

                                                                                                                       GUY

                                                                                                                                                                                                               ALO
                                                                  HL

                                                                                                                                                     AGI

                                                                                                                                                                AKG

                                                                                                                                                                                 ASR
                                                                                                                                                                                       IAG
                 OGC
                       PAAS
                              ABX

                                                                                                      KL

                                                                                                                                                           AR

                                                                                                                                                                      PG
                                           EDV

                                                                                                                             GG

                                                                                                                                                                                                   PVG
Source: RBC Capital Markets

           6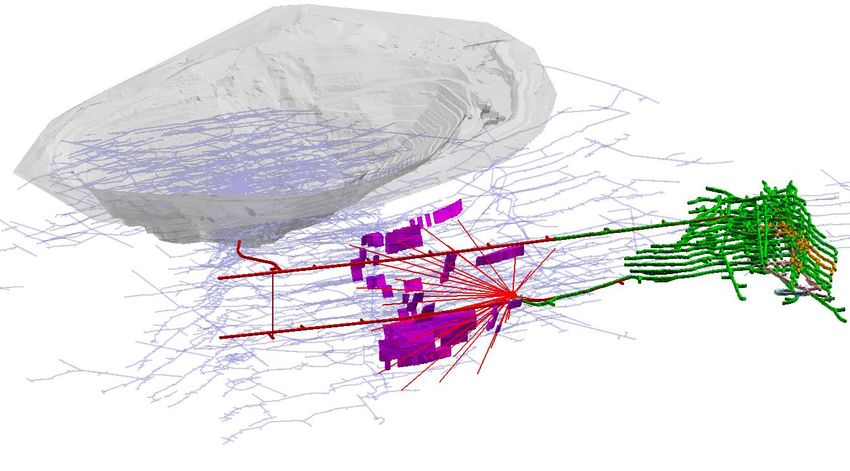
Compelling Returns & Margins
                            Strong Margins                                                                    Solid Returns
                               EBITDA Margin(1)                                                         Return on Invested Capital(1)
  60%
                               OceanaGold             Peer Average                        25%                 OceanaGold          Peer Average
  50%
                                                                                          20%
  40%
                                                                                          15%
  30%
                                                                                          10%
  20%

                                                                                          5%
  10%

   0%                                                                                     0%

 -10%                                                                               (2)   -5%                                                                     (3)
            2010     2011      2012     2013          2014    2015   2016   2017E               2010   2011   2012    2013        2014      2015   2016   2017E

                               EBITDA Margin(1)                                                        Return on Invested Capital(1)
                                OceanaGold       Peer Average                                                 OceanaGold     Peer Average
  50%                                                                                     10%

  40%                                                                                     8%

  30%                                                                                     6%

  20%                                                                                     4%

  10%                                                                                     2%

   0%                                                                                     0%
                                               2016                                                                        2016

(1) Bloomberg      (2) Capital IQ     (3) Barclays Research

        7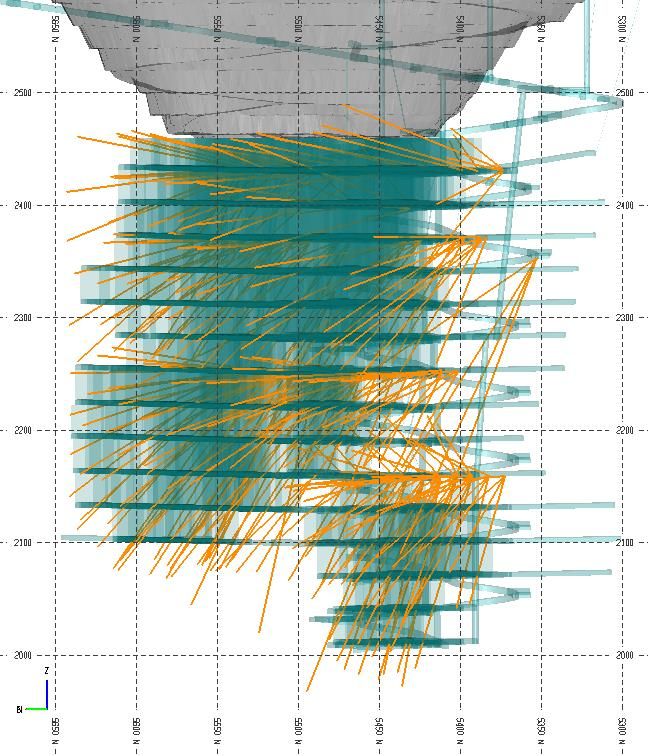
Strong Cash Flow Margins
          SOLID BUSINESS WITH TOP TIER ASSETS SET TO DELIVER STRONG MARGINS

                                                                             Sustaining Free Cash Flow Margins
    45%                                                                                              (2017E to 2019E)

    40%

    35%

    30%

    25%

    20%

    15%

    10%

     5%

     0%
                                                                             GG
                                               TXG

                                                                                                                                                               AUY
                            OGC

                                                                                                                                                                           DGC

                                                                                                                                                                                                                         PPP
                                                                                                                                                                                       KGC

                                                                                                                                                                                                   IAG
              TMR*

                                                                                              EDV

                                                                                                                      PAAS

                                                                                                                                              AR

                                                                                                                                                        SSRI

                                                                                                                                                                                                                    PG
                                         BTO

                                                                                                          EGO

                                                                                                                             THO

                                                                                                                                        NEM

                                                                                                                                                   HL

                                                                                                                                                                                 DPM

                                                                                                                                                                                                         CG
                     PVG*

                                                                       NGD

                                                                                  ASR

                                                                                                                                                                                                              ALO
                                                                                        ABX

                                                                                                                                   KL

                                                                                                                                                                                             AKG
                                  ROXG

                                                     GUY

                                                           AEM

                                                                 KDX

                                                                                                                CDE
                                                                                                    AGI

                                                                                                                                                                     TGZ
Source: RBC Capital Markets

          8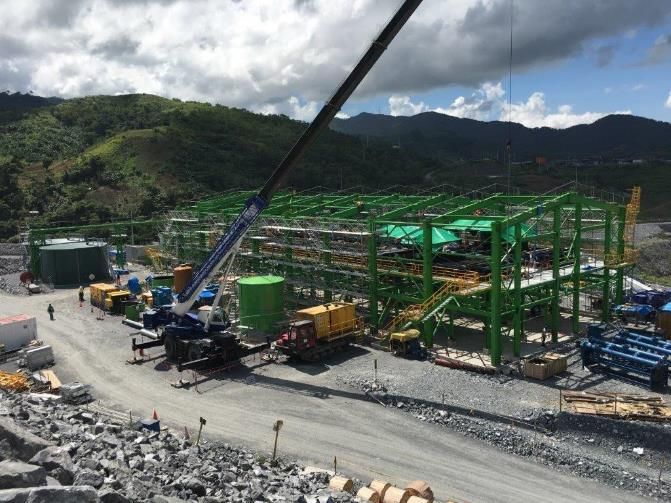
OceanaGold Strategy
POSITIONED WELL TO DELIVER ON HIGH MARGIN GROWTH OPPORTUNITIES

9
A Focus on Organic Growth
                 SIGNIFICANT ORGANIC GROWTH POTENTIAL UNDERPINS DEEP VALUE

                                           Annual Exploration Capital Spend Profile

                                              2011 to 2017E Capex Variance(1)                     Focus on organic
            40                                           ~240%                                        growth
            35

            30

            25
     USDm

            20
                             Didipio construction                                M&A in 2015
            15

            10

            5

            0
                       2011                    2012                    2013      2014      2015   2016        2017E

1.   Based on the midpoint of exploration capex guidance range of $30m to $40m

       10
Growing Existing Assets
CURRENT MINE OBJECTIVE FOR
AREAS OF FOCUS
LIFE INCREASED MINE LIFE
Annual
Brownfields & Greenfields
HAILE 2032 exploration
Reserve
replenishment
Annual
Extensional drilling at Didipio
DIDIPIO 2032 Near-mine targets
Reserve
replenishment
Martha Project, Brownfields &
WAIHI 2019 Greenfields exploration 10+ years
Round Hill Project,
MACRAES 2020 Brownfields exploration 10+ years
11Growth Opportunities
POSITIONED IN MULTIPLE GOLD PROVINCES
GSV & NUG
HAILE
CARLIN TREND
LOCRIAN
CORTEZ TREND CAROLINA TERRANE
RESOURCES
DIDIPIO
MYANMAR
LAOS CAGAYAN VALLEY
PHILIPPINE FAULT ZONE
WAIHI
COROMANDEL
VOLCANIC ZONE LA CURVA JV
MACRAES
DESEADO MASSIF
OTAGO TERRANE
12UNITED STATES PRODUCTION
2017 GUIDANCE(1)
Gold 110,000 – 130,000
(oz) (was 150,000 – 170,000)
AISC $600 – $650(2)
(per oz sold) (was $500 – $550)
RESOURCES
P&P Gold 3.46
Reserves (Moz)
Total Gold
Haile Resources
(2)
(Moz)
4.35
1. Production includes both commercial and non-commercial production
2. Total Resources = M&I and Inferred Resources. M&I Resources are inclusive of reservesCommissioning Focus Areas
SOME COMMMISSIONING ISSUES BUT CLEAR PATH FORWARD
Estimated
Area Issue Solution Expected Completion
Cost
SAG Mill grate Aperture of grate is inadequate Replace with larger grate $50k July 2017
Sub-optimal density of fine grind
Regrind inflow Close the feed circuit $200k July 2017
material
Inadequately sized piping Redesign and install a new piping
CIL Piping System $700k August 2017
system system
CIL Tank Liners De-lamination of CIL tank liners Removal and re-apply new liner Nil (warranty) December 2017
System response slower than
Control system expected due to volume of data; Review and upgrade over time $2M - $3M Staged upgrades over time
longer to tune circuits
Achieved nameplate throughput capacity numerous times in Q2
Team has identified a pathway forward
Confident in our revised timeframe
14Haile Optimisation Study
OPTIMISATION STUDY RESULTS DEMONSTRATES INHERENT VALUE
Champion Small Mill Zone Ledbetter Snake
Horseshoe
UPGRADED RESERVES
70% increase in Reserves (3.46 Moz reserves vs. 2.02 Moz previously)
ENHANCED ECONOMICS(1)
Cash flows of $1.4 billion based on current reserves, $1.8 billion based on current total mineable
inventory(2)
LONGER MINE LIFE, HIGHER PRODUCTION
Increased mine life to 2034(3) at nominal LOM gold production of 189,000 oz (vs. 13.25 years @ 127 koz)
CONTINUED HIGH MARGINS
LOM AISC $650 – $700 per ounce
1. Pre-tax and undiscounted 2. Mineable inventory includes Inferred Resources in mine plan 3. Based on mineable inventory
15New Mine Plan
NEW MINE PLAN DRIVES ENHANCED VALUE AT HAILE
Pit shells based on $1,150/oz gold price
HORSESHOE UNDERGROUND
OPEN PIT PHYSICALS UNDERGROUND PHYSICALS
Total Resources 3.66 Moz Total Resources 0.69 Moz
Reserves 3.02 Moz Maiden Reserves 0.44 Moz
LOM Strip Ratio 8.7 : 1 Mining rate 0.7 Mtpa
Mining rate 30 Mtpa
Mining cost $35 – $40 / t milled
Mining cost $1.45 - $1.55 / t mined
Mining method Long-hole open stope
Initial Capex (including site
$132m Pre-production Capex $55m
infrastructure & mining fleet)
LOM Sustaining Capex $194m LOM Sustaining Capex $25m
16Production & Process Scheduling
Profile
Process Plant Ore Feed Profile
(‘000 tonnes)
4,500
OP Ore to Mill UG Ore to Mill
4,000
3,500
3,000
2,500
2,000
1,500
1,000
500
-
2017 2018 2019 2020 2021 2022 2023 2024 2025 2026 2027 2028 2029 2030 2031 2032
LOM Gold Production and Grade Profile
Payable Gold Gold Grade Processed (g/t)
250 3.00
2.50
Gold Production (‘000 oz)
200
Gold Grade (g/t)
2.00
150
1.50
100
1.00
50
0.50
0 -
2017 2018 2019 2020 2021 2022 2023 2024 2025 2026 2027 2028 2029 2030 2031 2032
17Cost Overview
STUDY CONFIRMS HIGH-MARGIN BUSINESS OVER LIFE OF MINE
Operating Costs
Open Pit Mining costs $ / t mined 1.45 – 1.55
Underground Mining costs $ / t mined 35 – 40
Processing costs $ / t milled 10 – 11
Site G&A costs $ / t milled 3–4
LOM AISC $ per oz 650 – 700
Capital Costs (US$m) Initial Capital LOM Sustaining Capital
Open Pit 67 75
Underground 55 26
Process Plant 67 25
Site Infrastructure 65 119
Total Capital 254 245
18Haile LOM Cash Flows
STRONG CASH FLOW GENERATION PROFILE
Pre-tax cash flows(1) based on Reserves Pre-tax cash flows(1) based on total mineable inventory
$1.4 billion $1.4 billion
Pre-tax Cash Flow Profile
400
Revenue Operating Cost Expansion Capex Sustaining Capex Net Cash Flow
300
200 177
157 144
135
118 114 116
100 75 68 76 63 70
59
USDm
31
8 14
0
-100
-200
-300
2017 2018 2019 2020 2021 2022 2023 2024 2025 2026 2027 2028 2029 2030 2031 2032
1. Undiscounted
19Project Timelines
ESTIMATED TIMING FOR THE EXPANSION
2016 2017 2018 2019 2020 2021
Q3 Q4 Q1 Q2 Q3 Q4 Q1 Q2 Q3 Q4 Q1 Q2 Q3 Q4 Q1 Q2 Q3 Q4
Optimisation Study
Preparing permit
Permitting Process
applications
Underground development
Engineering &
procurement
Plant expansion
First underground
ore processed
Today
20Haile Drilling
$8M+ BUDGET – GROWING THE RESOURCE BASE
A’
A
21Haile 2017 Exploration
Champion Small
Mill Zone
Ledbetter Snake
Reserve Design
>0.4 g/t Au
Horseshoe
Palomino
Section A-A
Red
DDH0618
Metavolcanic rocks
Hill
Snake
Horseshoe
Au grade
1 g/t Au (g/t)
grade shell
< 0.035
0.035 – 0.15
0.15 – 0.40
0.40 – 0.80
0.80 – 1.50
DDH0621
Palomino 1.50 – 3.00
3.00 – 5.00
Snakeshoe > 5.00
Palomino & Snake Drilling
September, 2016 – June, 2017
Assays reported
Assays pending
Metasedimentary rocks Metased/Metavol contact
100 m Northwest view
700 m thickness
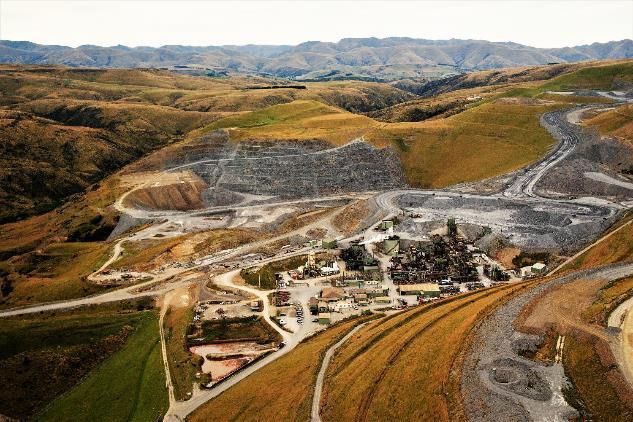
22PRODUCTION
2017
GUIDANCE
NEW ZEALAND WAIHI
Gold
(oz)
110,000 – 120,000
AISC $740 – $790
(per oz sold)
Auckland MACRAES
Waihi Gold 180,000 – 190,000
(oz)
AISC $950 – $1,000
(per oz sold)
(1)
RESOURCES
Reefton
Wellington
WAIHI MACRAES
Blackwater
Christchurch Gold 0.35 1.21
Macraes P&P (Moz)
Reserves Silver
Gold-Tungsten 1.31 -
Dunedin (Moz)
Project
Gold 0.57 4.79
Total (Moz)
(2)
Resources Silver 1.58 -
(Moz)
1. As at 31 Dec 2016 – refer to www.oceanagold.com
2. Total Resources = M&I and Inferred Resources. M&I Resources are
inclusive of reservesWaihi - A Top Tier Asset
EXPLORATION CONTINUES TO UNLOCK VALUE
December 31, 2014 December 31, 2015 December 31, 2016
Total Resource(1) Total Resource(1) Total Resource(1)
360,000 430,000 570,000
ounces ounces ounces
~300 koz mined during 2015 and 2016
1. Total Resources = M&I and Inferred Resources. M&I Resources are inclusive of reserves.
24Waihi 2017 Exploration
Significant SIGNIFICANT GROWTH planned
exploration program PIPELINEfor
& DRILL
WaihiPROGRAM
in 2017
Martha Project
DRILL DRIVE 1
Construction status(1): 75% complete
Completion: Q3 2017
Diamond drilling planned: 12,200m
DRILL DRIVE 2
Construction status(1): 40% complete
Completion: Q4 2017
Underground Drilling
Infill and extensional: 18,000m+
Other Opportunities
Brownfields drilling: 17,000m+
Greenfields drilling: 6,000m+
1. As at 31 May 2017
25Waihi - Martha Project
800m RL DRILL PROGRAM – 12,200m
Martha Open Pit
Daybreak
Historic Underground
Development Development as
at 31 May 2017
Resource targets
coloured blocks
26Waihi - Martha Project
EXTENSIVE DRILL PROGRAM PLANNED
Martha Open Pit
Daybreak
Historic Underground
Development Development as
at 31 May 2017
Resource targets
coloured blocks
27Regional Exploration Projects
COROMANDEL GOLD DISTRICT PRODUCTION >12 MOZ AU, 52 MOZ AG
Dome Field North & South
Map/sample/geophysics
Twin Hills
Map/sample/target generation
Sinter Ohui
Water table
deposits Map/sample/target generation/access
silica
Hydrothermal
breccia
White Bluffs
Geophysics/target generation/access
Glamorgan
Map/sample/geophysics/target generation/access
Hauraki
Map/sample/geophysics - drilling at WKP
28Macraes – Coronation North
CONTINUE TO GROW THE RESOURCE BASE
Coronation North
Coronation
Golden Point
Round Hill
FRUG
29Macraes – Golden Point
OPPORTUNITY TO ADD OUNCES TO ROUND HILL PROJECT
Coronation North
Coronation
Golden Point
Round Hill
FRUG
30Macraes Beyond
ADVANCING THE MACRAES ROUND HILL PROJECT
ROUND HILL/GOLDEN POINT
Relocated
Process Plant
~1.38 Moz
Resource(1)(2)
Round Hill
Deposit
STUDY ADVANCING: Additional technical &
economic work underway
CONCEPT: New location + build of smaller
process plant w/Tungsten circuit
MINE LIFE EXTENSION: Potential for mine life
of 10-12 years
1. As at 31 Dec 2016
2. Total Resources = M&I and Inferred Resources. M&I Resources are inclusive of reserves
31PRODUCTION
PHILIPPINES 2017
GUIDANCE
Island of Gold 150,000 – 160,000
(oz) (was 110,000 – 130,000)
Luzon
Copper 18,000 – 19,000
San Fernando (Port) (t) (was 15,000 – 17,000)
Far Southeast
Didipio
AISC $70 – $120(1)
(Goldfields/Lepanto) (per oz sold) (was $130 – $180)
Manila
Masbate (2)
(B2Gold) RESOURCES
Gold 1.46
(Moz)
P&P
Reserves Copper 0.18
(Mt)
Co-O
(Medusa) Gold 2.06
(Moz)
Total
(3)
Island of Resources Copper 0.24
Mindanao (Mt)
1. Costs based on a copper price assumption of $2.50 / lb and a gold price of $1,200
2. As at 31 Dec 2016 – refer to www.oceanagold.com
3. Total Resources = M&I and Inferred Resources. M&I Resources are inclusive of reservesDidipio Mining Transition
TRANSITION TO UNDERGROUND MINING ADVANCING WELL AT DIDIPIO
Didipio paste fill plant under construction
OPEN PIT
UNDERGROUND Near completion
First ore expected at end of 2017
STOCKPILES
PROJECT INFRASTRUCTURE >24 million tonnes @ 0.54 g/t Au, 0.37% Cu
Ventilation, water pumping and paste plant on track expected after completion of open pit
33Didipio Drill Program
INFILL AND EXTENSIONAL DRILLING CONTINUES
DESIGNED DRILLHOLES
Infill drilling across 500m vertical
Five levels and two panels
TOTAL METERAGE
~300 drill holes for >51km of drilling
UPSIDE
Testing depth extensions
Near mine targets
342017 Priorities
CONTINUED FOCUS ON CREATING VALUE, DELIVERING ON COMMITMENTS &
STAKEHOLDER ENGAGEMENT
REVISED 2017 GUIDANCE
Gold Production Copper Production All-In Sustaining Costs
550,000 – 600,000 18,000 – 19,000 US$600 – US$650
ounces tonnes per ounce
OPERATIONS DEVELOPMENT
Further improve on safety
Commercial production at Haile
Continue to deliver meaningful benefits
to our host communities Continue to advance Didipio U/G
construction
Deliver on guidance and cash flows
GROWTH STAKEHOLDERS
Increase resource base through
exploration Continued strong stakeholder
engagement
Advance technical and optimization
studies Increase global ESG engagement
35Executive Management Team
A MANAGEMENT TEAM WITH BROAD AND DEEP EXPERIENCE
Mick Wilkes Mark Cadzow Scott McQueen Craig Feebrey
President & Chief EVP and EVP and EVP Exploration
Executive Officer Chief Development Officer Chief Financial Officer
Michael Holmes Mark Chamberlain Yuwen Ma Liang Tang
EVP and Chief Operating EVP Corporate Development EVP Human Resources Company Secretary &
Officer Corporate Counsel
37Board of Directors
Jim Askew Mick Wilkes Diane Garrett
Chairman President & CEO Director
• Mining engineer with over 35 • Over 30 years industry • Over 20 years of senior
years broad international experience management and financial
experience as a Director/CEO for • Developed major projects in expertise in the field of natural
a wide range of international Australia & SE Asia resources
publicly listed mining, mining • Strong Operations background in • Most recently she held the
finance, and other mining related
companies
hard rock mining position of President and CEO of
Romarco Minerals Paul Sweeney
• Strong in Community and
• Served on the board of Government relations • Dr. Garrett is currently CEO of Director
numerous resource public Wellgreen Platinum and also a
• Extensive SE Asian experience • Over 35 years in financial
companies, which currently director of TriStar Gold. Inc.
include Evolution Mining, Asian • Dr. Garrett holds a PhD in management of mining &
Mineral Resources Ltd and Engineering in addition to a renewable energy companies
Syrah Resources where he Master of Arts (MA) in Mineral • Management roles with Placer
serves as the non-executive Economics from the University of Dome & Gibraltar Mines, board
Chairman Texas at Austin. roles with Pan American Silver &
New Gold
• Currently on the boards of Tahoe
Joey Leviste Bill Myckatyn Dr. Geoff Raby Resources & Grenville Strategic
Royalty
Director Director Director
• Chairman of OceanaGold • Mining engineer with over 30 • Former Australian
(Philippines), Inc. and Philippine years’ experience in mine Ambassador to The
resident of the Australia- development and operations People’s Republic of China
Philippines Business Council • Former Chairman of Quadra from 2007 – 2011
• Appointed by Philippine FNX Mining Ltd., until its • Joined the Australian public
President as private sector takeover in 2012, a company he service in 1986 and has held
member of Governing Council of co-founded as CEO in 2002 various postings throughout
the Philippines Council for • Currently on the Board for First Asia and Europe prior to his
Agriculture, Aquatic & Natural Point Minerals and San Marco posting in Beijing
Resource. Resources • Serving as the non-
executive director of ASX
listed Fortescue and
SmartTrans
38Argentina – New Opportunities 39
Mineral Resource and Reserves
     RESERVE STATEMENT (31 December 2016)
               PROJECT                                      PROVEN                                   PROBABLE                                          PROVEN & PROBABLE RESERVE
                 AREA                            Mt     Au g/t  Ag g/t         Cu %       Mt      Au g/t Ag g/t          Cu %        Mt       Au g/t     Au Moz   Ag g/t Ag Moz  Cu %                Cu Mt
     MACRAES Open Pit                           12.2     1.08      -             -       18.1      1.12     -              -        30.3       1.10       1.07       -      .      -                    -
     MACRAES Underground                        0.54     2.70      -             -       1.31      2.30     -              -        1.85       2.42       0.14       -      .      -                    -                 Does not include recently updated
                                                                                                                                                                                                                                  Haile Resources
     WAIHI Open Pit                             0.16     3.05    30.5            -       0.66      2.91   29.1             -        0.81       2.94       0.08     29.4   0.77     -                    -
     WAIHI Underground                          0.37     9.14    18.1            -       0.76      6.56   13.1             -        1.13       7.40       0.27     14.7   0.54     -                    -
     DIDIPIO Open Pit                           28.6     0.47     2.5            -       2.40      0.94    2.3           0.45       31.1       0.51       0.51      2.5   2.46   0.35                 0.11
     DIDIPIO Underground                         2.3     2.48     2.6            -       13.7      1.76    2.5           0.43       15.9       1.86       0.95      2.5   1.27   0.44                 0.07
     HAILE                                      19.6     2.19      -             -       10.9      1.82     -              -        30.5       2.06       2.02       -      -      -                    -
     TOTAL                                      63.7     1.26      -             -       47.8      1.60     -              -        112        1.41       5.04       -     5.0     -                  0.18

      Notes:
      1.       Reserves are reported within current mine designs using economic assumptions unless otherwise noted: US$1,300/oz gold, US$3.00/lb copper and US$19/oz silver.
      2.       Didipio reserves based on US$1,250/oz gold and US$3.20/lb copper.
      3.       Haile reserves based on US$950/oz gold price.
      4.       Estimates of contained metal do not make allowances for processing losses.

     RESOURCE STATEMENT (31 December 2016)
          PROJECT                                     MEASURED                                    INDICATED                                             MEASURED & INDICATED                                                         INFERRED RESOURCE
            AREA                            Mt      Au g/t Ag g/t          Cu %        Mt       Au g/t  Ag g/t         Cu %       Mt       Au g/t      Au Moz  Ag g/t   Ag Moz           Cu %      Cu Mt      Mt      Au g/t      Au Moz   Ag g/t Ag Moz                Cu %        Cu Mt
MACRAES Open Pit                           17.5      1.11     -              -        65.1       0.95      -             -       82.5       0.99        2.62      -        -               -          -       39       0.9          1.1       -      -                    -            -
MACRAES Underground                        3.88      3.11     -              -        7.34       2.06      -             -       11.2       2.42        0.87      -        -               -          -       3.5      1.4          0.2       -      -                    -            -
REEFTON                                    1.26      1.83     -              -        6.55       1.49      -             -        7.8       1.54        0.39      -        -               -          -       1.4      1.1          0.0       -      -                    -            -
BLACKWATER                                   -         -      -              -          -          -       -             -         -          -           -       -        -               -          -       0.9      23           0.7       -      -                    -            -
WAIHI Open Pit                             0.16      3.05   30.5             -        0.66       2.91    29.1            -        0.8       2.94        0.08    29.4     0.77              -          -        -        -             -       -      -                    -            -
WAIHI Underground                          0.37      9.13   15.5             -        0.88       6.57    11.5            -        1.2       7.33        0.29    12.7     0.51              -          -       0.7      6.9          0.2     13.5    0.3                   -            -
DIDIPIO Open Pit                           28.9      0.48   2.48           0.34        7.1       0.65    2.15          0.30      36.0       0.51        0.59    2.41     2.79            0.33       0.12      2.4      0.5          0.0      2.0    0.2                  0.2         0.01
DIDIPIO Underground                        2.57      2.50   2.58           0.48       17.2       1.74    2.38          0.46      19.8       1.84        1.17    2.41     1.53            0.46       0.09      6.5      1.3          0.3      1.6    0.3                  0.4         0.02
HAILE Open Pit                             36.8      1.78     -              -        33.6       1.68      -             -       70.3       1.73        3.92      -        -               -          -       19       1.1          0.7       -      -                    -            -
TOTAL                                      91.3      1.35     -              -        138        1.34      -             -       229.7      1.34        9.93      -       5.6              -        0.21      73       1.3          3.1       -     0.8                   -          0.03

Notes:
1.       Mineral Resources include Mineral Reserves.
2.       Macraes and Reefton open pit resources constrained by a NZ$2,200/oz gold price pit shell. Macraes underground resources are geologically constrained.
3.       The commencement of Reefton closure and rehabilitation was announced on 19 December 2016.
4.       The Waihi open pit resources are reported to a 0.5 g/t Au cut-off within a pit design to the 890mRL. The underground resources are based on a NZ$1,857/oz gold price.
5.       For Didipio, open pit resources are reported above the 2,460mRL and underground resources between the 2,460mRL and 2,070mRL. Open pit resources use AuEq cut-off based on US$1,300/oz gold and US$3.00/lb copper. Underground resources use AuEq cut-off based on
         US$1,450/oz gold and US$3.80/lb copper
6.       Haile open pit resources are reported to a 0.41 g/t Au cut-off within a US$1,200/oz gold price pit shell

      MINORITY INTEREST RESOURCE STATEMENT (31 December 2016)
         PROJECT                                         MEASURED                                   INDICATED                                             MEASURED & INDICATED                                                         INFERRED RESOURCE
           AREA                               Mt       Au g/t Ag g/t         Cu %        Mt       Au g/t  Ag g/t         Cu %       Mt       Au g/t      Au Moz  Ag g/t   Ag Moz           Cu %      Cu Mt      Mt      Au g/t      Au Moz   Ag g/t Ag Moz                   Cu %    Cu Mt
 SAMS CREEK                                    .         .      .              .         2.0       1.77     .              .        2.0       1.77        0.11     .         .               .         .        2.0      1.3          0.1      .       .                       .       .
 TOTAL                                         .         .      .              .         2.0       1.77     .              .        2.0       1.77        0.11     .         .               .         .        2.0      1.3          0.1      .       .                       .       .

Notes:
OceanaGold has a 20% interest in the Sams Creek Project. The tabulated resource is factored by the percentage ownership.

         40
You can also read