Consumers' Perspectives and Behaviors towards Corporate Social Responsibility-A Cross-Cultural Study
←
→
Page content transcription
If your browser does not render page correctly, please read the page content below
sustainability

Article
Consumers’ Perspectives and Behaviors towards Corporate
Social Responsibility—A Cross-Cultural Study
Yi Hsu * and Thi Hong Gam Bui

                                          Department of Business Administration, National Formosa University, Huwei Township 632301, Taiwan;
                                          graciebui1312@gmail.com
                                          * Correspondence: yihsu214@gmail.com

                                          Abstract: This study measured consumers’ perspectives and behaviors with respect to corporate
                                          social responsibility (CSR). Specifically, we explored the components of CSR, including CSR aimed
                                          towards the environment, society, customers, employees, suppliers, and shareholders. We also
                                          examined the impact of CSR practices on brand attitude and purchase intention. The study surveyed
                                          616 consumers across three locations, with detailed questionnaires in four languages. A total of
                                          564 samples (186 from Vietnam, 189 from Indonesia, and 189 from Taiwan) qualified for data analysis.
                                          Additionally, statistics software including LISREL 8.8, STATISTICA 10, and MINITAB 19 were utilized
                                          to evaluate our hypotheses and construct a structural model. The results indicated that the consumers
                                          across the three areas were not concerned about CSR aimed towards shareholders, while all consumers
                                          considered CSR aimed towards themselves. Vietnamese customers prioritized a company’s care for
                                          its employees, while both Indonesian and Taiwanese consumers concentrated on the environment
                                          and society. In addition, suppliers’ benefits and rights attracted Indonesians’ attention. Furthermore,
                                CSR had a positive significant impact on brand reputation in all three cultures. However, while

                                          CSR had a positive influence on customer purchase intention in Indonesia and Taiwan, it did not
Citation: Hsu, Y.; Bui, T.H.G.
                                          in Vietnam.
Consumers’ Perspectives and
Behaviors towards Corporate Social
                                          Keywords: corporate social responsibility; brand attitude; purchase intention; linear structure relation
Responsibility—A Cross-Cultural
                                          model; regression model
Study. Sustainability 2022, 14, 615.
https://doi.org/10.3390/su14020615

Academic Editors: María del
Carmen Valls Martínez,                    1. Introduction
José-María Montero and Pedro
                                          1.1. Research Background
Antonio Martín Cervantes
                                               These days, many companies are attempting to humanize themselves. Specifically,
Received: 4 December 2021                 they are endeavoring to behave like humans in order to win customers’ hearts. For exam-
Accepted: 29 December 2021                ple, Howard Schultz—the founder of Starbucks—was inspired by his father’s adversity.
Published: 6 January 2022                 Schultz’s father struggled to make ends meet and was underestimated by his employers;
Publisher’s Note: MDPI stays neutral      moreover, he was seriously injured in the workplace. The hard times experienced by his
with regard to jurisdictional claims in   father prompted Schultz’s motivation to genuinely care about his employees’ lives and
published maps and institutional affil-   implement corporate social responsibility (CSR). He established a “Transformation Agenda”
iations.                                  targeting the firms’ employees [1]. Specifically, Starbucks not only remunerates its employ-
                                          ees equally but also offers insurance and other benefits to all part time and full time staff.
                                          Additionally, Starbucks has implemented numerous initiatives focused on the environment
                                          and the community. Regarding the community, Starbucks operates community stores in
Copyright: © 2022 by the authors.         collaboration with local nonprofit organizations. Through these endeavors, Starbucks has
Licensee MDPI, Basel, Switzerland.
                                          undertaken a host of activities to help the communities in which they are located. With
This article is an open access article
                                          respect to environmental responsibility, Starbucks has tried to reduce its waste by recycling
distributed under the terms and
                                          and conserving water and energy. Furthermore, its CSR performance has earned a great
conditions of the Creative Commons
                                          deal of support from its customers and, as a result, has contributed to increased profits.
Attribution (CC BY) license (https://
                                          After implementing these strategies, Starbucks bounced back financially, and by 2013 had
creativecommons.org/licenses/by/
4.0/).
                                          even exceeded its previous revenue.

Sustainability 2022, 14, 615. https://doi.org/10.3390/su14020615                                     https://www.mdpi.com/journal/sustainability
Sustainability 2022, 14, 615                                                                                           2 of 23

                                     Recently, CSR has received attention due to its importance to customers, employees,
                               shareholders, suppliers, the environment, and society as a whole. The practice of CSR
                               is one of the effective ways by which an enterprise can enhance its reputation [2] and
                               sharpen its competitive edge, which is subsequently reflected in a firm’s profitability [3].
                               These days, in particular, with competition becoming increasingly tougher, CSR should
                               be taken into consideration. Therefore, extensive studies have been conducted to better
                               understand the components of CSR, as well as the correlations between their roles and
                               consumer perspectives with respect to brand and purchase intention. More specifically,
                               CSR practices can enhance consumers’ perspectives on a particular brand or company with
                               respect to trust, engagement, contentment, and attachment [4]. In addition, CSR practices
                               have a significant influence on the target audience’s attitude towards the company and
                               their purchase intention [5].
                                     In Taiwan, CSR has entered the mainstream, shifting from its use mainly in NGOs
                               and companies in the public sectors to finding utility in private companies. In September
                               2014, the government imposed compulsory CSR on all companies with capital above TWD
                               10 billion, as well as food, chemical, and finance enterprises listed on TWSE/TPEx [6]. In
                               2015, 77% of Taiwan’s top companies published CSR reports, compared to an average of
                               73% of top firms doing the same around the world. Moreover, to ensure that these reports
                               were reliable, many companies hired one of the big four accounting companies to confirm
                               and verify them. Approximately 50% of the CSR reports were verified independently by
                               certification, testing companies, or accounting firms. To date, many Taiwanese companies
                               have committed to addressing CSR, including the Taiwan Business Bank (TBB), BASF,
                               and Taiwan FamilyMart Co., Ltd. CSR strategies do indeed enhance the competitiveness
                               and corporate reputation of a firm. This can be explained by the fact that consumers in
                               this area are aware of CSR and are more likely to support companies that take on social
                               responsibility, even if the price or quality of the products or services provided by these
                               companies do not exceed those of products or services provided by their counterparts.
                               Indonesia was the first country to adopt a compulsory approach to CSR. According to
                               Article 15 of Law 25 2007, all companies must implement CSR [7]. In reality, the lack
                               of clarity on definitions has resulted in the government finding it difficult to enforce
                               CSR. Companies have, nevertheless, deemed the implementation of CSR to be capable of
                               increasing their competitiveness. Therefore, many domestic and multinational companies,
                               such as Unilever Indonesia, Nestle, Coca-Cola, Exxon Mobil, Conoco Phillips, Pertamina,
                               Chevron, Indosat Ooredoo, etc., have voluntarily adopted CSR. In Vietnam, in the 2000s,
                               CSR was introduced by multinational firms [8,9]. These days, many companies, including
                               BIDV, Bitis, and Vinamilk, have voluntarily adopted CSR, and VinGroup has been a rising
                               star. VinGroup donated a large portion of its budget to help alleviate the damage caused
                               by the COVID-19 pandemic. In emerging markets such as Vietnam and Indonesia, CSR is
                               not generally taken seriously. In particular, there are no official regulations or accounting
                               standards in accordance with which enterprises are to disclose CSR activities in either
                               country [10,11]. At the same time, sufficient support for issuing global CSR certificates is
                               not provided [11]. In cases where businesses communicate CSR activities, they are likely
                               to announce them in their yearly report or, rarely, in a CSR report or sustainable report;
                               however, the report indicators and methods are inconsistent [12]. Most companies take on
                               CSR superficially and spontaneously due to their altruistic motives and do not put much
                               effort into fulfilling their social responsibility. In order words, these types of enterprises
                               do not engage actively in sustainable growth due to profit motives [13]. On the one hand,
                               the cost of CSR activities is quite high, which outweighs the benefit that they could derive.
                               On the other hand, consumers who operate in the markets pay more attention to the core
                               value of products rather than CSR.
                                     On 11 March 2020, the World Health Organization (WHO) declared COVID-19 a
                               pandemic, which has since then led to a serious economic crisis [14] with more than
                               276 million cases and 3.3 million deaths (https://www.worldometers.info/coronavirus/,
                               accessed on 22 December 2021). In Taiwan, the COVID-19 pandemic has been controlled
Sustainability 2022, 14, 615                                                                                             3 of 23

                               well [15] due to the experience of SARS in 2003 [16,17]. At the beginning of the pan-
                               demic, on 27 April 2020, Taiwan had only 429 cases and 6 deaths [15]. As of 26 December
                               2020, just 783 cases were confirmed on this island due to its efficient quarantine poli-
                               cies [18]. Although Taiwan encountered a severe wave of infections in May 2021 with about
                               15,000 cases by 15 July 2021 [19], the number of daily cases decreased to approximately
                               30 in July 2021 [15]. Updated in 22 December 2021, Taiwan recorded only 16,840 total
                               cases, 850 total deaths, 705 total cases per million people, compared to 35,501 total cases
                               per million people globally, 36 deaths per million people compared to 691 deaths per
                               million people globally. In contrast, in Indonesia and Vietnam, the situation is much worse.
                               Indonesia, a country with the fourth highest population, is likely to be severely affected
                               by the pandemic [20]. In November 2020, the death rate from COVID-19 in Indonesia
                               was the highest in Asia (8% in 2020) [21]. On 22 December 2021, Indonesia recorded
                               4,261,000 total cases, 144,034 total deaths, and 15,340 total cases per million people, 519 total
                               deaths/million of the population (https://www.worldometers.info/coronavirus/, accessed
                               on 22 December 2021). The explanation for this serious situation is that vaccination pro-
                               grams were rolled out slowly and most Indonesian people follow Islam which limits the
                               consumption of goods—including vaccines—to only those that meet halal certification.
                               Regarding Vietnam, the government controlled the COVID-19 pandemic well during 2020
                               due to effective quarantine policies [22]. Since April 2021, the most serious COVID-19
                               outbreak in Vietnam saw 1,588,000 total cases, 30,250 total deaths, and 16,105 total cases per
                               million people, and 307 total deaths per million people, as updated on 22 December 2021
                               (https://www.worldometers.info/coronavirus/, accessed on 22 December 2021). Many
                               enterprises have been struggling, and some have entered bankruptcy [23]. Obviously,
                               a pandemic—such as COVID-19—is an unexpected event and can magnify the cost of
                               CSR activities [24] and also amplify the sensitivity of customers. In this situation, from a
                               company’s perspective, whether it should take on its social responsibility or focus on profit
                               has always been a widely debated issue. In addition, to what extent consumers would
                               support companies that perform CSR remains unknown. According to prior research [25],
                               culture affects CSR disclosures. Particularly, in Western countries, where individualism is
                               embraced and the power gap is not high, CSR reports are prevalent. However, in Asian
                               countries, which are comparatively conservative, the CSR disclosure rate is lower.

                               1.2. Research Purpose
                                    Based on previous studies [26–28], this research aims to examine the components and
                               their associated weights in different cultures. Although the concept of CSR components
                               has existed for over a decade, they are still worth researching in the current COVID-19
                               pandemic—a sensitive time. Furthermore, this research proposes and examines how
                               consumers perceive CSR as well as the influence of CSR on their attitude toward brand
                               and consumer intention. We also collected demographic information for statistical analysis
                               to increase the precision of data in this research. To carry out this study, we collected
                               samples from consumers in Taiwan—a developed economy—as well as two developing
                               economies—Indonesia and Vietnam—during the COVID-19 pandemic. The results analyze
                               CSR components and customers’ perception towards CSR, as well as gauge how CSR
                               influences brand attitude and purchase intention. In the research, we make comparisons in
                               three areas. Lastly, this research also makes theoretical and practical contributions.

                               1.3. Research Structure
                                     Section 1 introduces CSR generally and particularly in Taiwan, Indonesia, and Vietnam.
                               It also briefly mentions the purpose of this research and the study structure. Section 2 is
                               the literature review—it defines CSR components, namely, CSR towards the environment,
                               society, customers, employees, suppliers, and shareholders. It also investigates CSR’s effects
                               on customers’ attitudes toward brands and their purchase intention. In this section, a model
                               including nine hypotheses is also described. In Section 3, the sampling technique and the
                               research methodology are demonstrated. Specifically, we show the way to distribute, collect,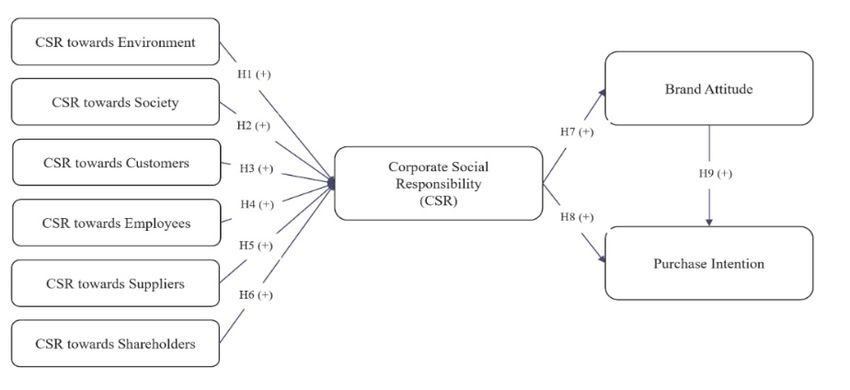
Sustainability 2022, 14, 615                                                                                            4 of 23

                               and analyze data. Section 4 presents the hypotheses testing results extracted from analyzing
                               the data collected. Moreover, the results of the statistical analyses show the similarities and
                               differences in the three locations. Section 5 includes the conclusion, discussion, limitations,
                               and further studies.

                               2. Literature Review
                               2.1. CSR
                                     The concept of CSR dates back to a long time ago. Especially, after World War II,
                               CSR was adopted and gradually became prevalent [29]. Nowadays, CSR has received a
                               great deal of attention from the public. Many companies issue CSR reports as a means of
                               communicating their CSR performance. Public and company awareness leads to the growth
                               of CSR initiatives [30]. There are many standards used as social reporting frameworks.
                               Global Reporting Initiative (GRI) has become commonly used for reporting sustainabil-
                               ity [31] since GRI reports are used to judge improvement year by year, and also facilitates
                               making comparisons with their rivals [32]. It provides three standards, including economic,
                               environmental, and social metrics [33]. The ESG metrics are based on three aspects (en-
                               vironmental, social, and governance); ESG disclosures can also help companies become
                               more reliable and transparent and, then, improve their reputation [34]. Furthermore, ISO
                               26,000 is not certifiable but offers guidance on socially responsible practices to organizations
                               as well as the public sector [35]. One of the most valuable frameworks is the United Nations
                               Global Compact (UNGC), which correlates firms’ strategies and activities with human
                               rights, labor, environment, and anticorruption principles [30]. Regarding employees, So-
                               cial Accountability International’s SA8000 standard and FLA Workplace Code guide on
                               maintaining social practices in the workplace [36].
                                     Although many previous theories and models have studied CSR, to date, there is a
                               scarcity of research models that examine how CSR affects brand attitude and purchase
                               intention. In addition, previous research was conducted on just one specific area and did not
                               examine the interrelations in areas that have different legal, economic, cultural, and social
                               conditions. Moreover, previous research was carried out in normal situations. However,
                               this study is conducted in a crisis, the COVID-19 pandemic, in which the cost of CSR
                               activities [24] and the sensitivity of customers are prone to be high. Therefore, this study
                               proposed the influence of CSR on purchase intention in Vietnam and Indonesia—emerging
                               economies—and Taiwan—a developed economy.
                                     Since the 1950s, there have been many definitions of CSR. In the study, CSR is defined
                               as a set of principles that a company adopts voluntarily beyond legal requirements to be
                               accountable toward the environment, society, customers, employees, suppliers, and share-
                               holders [26,27]. Therefore, it improves quality of life and also contributes to sustainable
                               development. According to [28], CSR is a seven-dimensional construct, which includes
                               the environment, society, community, customers, employees, suppliers, and shareholders.
                               However, we realize that there are some overlaps between the two domains—community
                               and society—and we integrate the two domains into one. Therefore, in this study, CSR
                               includes six subdomains.

                               2.1.1. CSR towards the Environment
                                     Environmental sustainability and green business management have received a great
                               deal of attention. The environment domain plays a crucially important role in CSR and
                               environmental conservation is a duty of corporations and can be a strategic instruction
                               for how enterprises achieve sustainable development [34]. CSR towards the environment
                               is the combination of the awareness of environmental management and the philosophy
                               of corporate operation to alleviate the effect of manufacturing on the environment [37].
                               CSR towards the environment has been mentioned widely but lacks quantitative data to
                               evaluate the outcomes, while many frameworks, such as ESG, involve environmental crite-
                               ria to gauge how well a company serves the environment. CSR towards the environment
                               can be considered as enterprises minimizing energy consumption, using ecofriendly and
Sustainability 2022, 14, 615 5 of 23
sustainable materials, and having proper waste management. Moreover, these companies
engage in constant efforts to preserve the environment, as well as invest in research and
development related to environment protection [28,38,39]. This study assumes the existence
of the positive relationship of CSR towards the environment and overall CSR. As a result,
the following first hypothesis is developed:
Hypothesis 1 (H1). CSR towards the environment has a positive impact on overall CSR.
2.1.2. CSR towards Society
Apart from environmental issues, recently, social issues have emerged. Society is de-
scribed as the surroundings in which an enterprise deploys its CSR practices and activities.
In general, society often expects the returns from a company to afford that company ac-
ceptance and legitimacy [40]. Instead of avoiding social issues, enterprises nowadays have
taken on CSR to address those problems [41]. CSR towards society can be considered as an
enterprise’s contributions to community development related to job creation, especially
for disabled people, economic development, as well as contributing to enhancing the life
quality of the community [28,42]. An assumption is that there is a positive correlation
between CSR towards society and overall CSR. Therefore, the hypothesis is developed:
Hypothesis 2 (H2). CSR towards society has a positive impact on overall CSR.
2.1.3. CSR towards Customers
Customers are a substantial source of the value of a company [43]. If a company does
not take responsibility for its customers, it will be unable to attract customers and generate
revenue or profits. In the case that customers are unsatisfied with a company’s products or
behaviors, they can stop supporting or even boycott the company’s products or services.
The worst case could be that company is likely to lose profits or go bankrupt. Consequently,
CSR towards customers is key in CSR strategy. CSR towards customers can be considered
as an enterprise making honest claims to customers through advertising or marketing,
providing safe products with high quality, fair prices [28,38,39]. This study speculates the
positive link between CSR towards customers and overall CSR. Therefore, the following
hypothesis is developed:
Hypothesis 3 (H3). CSR towards customers has a positive impact on overall CSR.
2.1.4. CSR towards Employees
Employees are a vital resource of a company [44]. Employees’ competence is necessary
and can be considered a core value of an enterprise. In cases where employees are not
satisfied with their jobs, work performance is affected. The quality and quantity of products
and services are prone to be reduced. Taking on CSR towards employees is necessary for a
company to maintain its business and improve its outcomes [45]. The foundations of CSR
should focus on employees’ wellbeing [46]. There are many frameworks, such as Social
Accountability International’s SA8000 standard, FLA Workplace Code, etc., which provide
guidance on maintaining social practices in the workplace [36]. CSR towards employees can
be considered as an enterprise paying adequate salaries to their employees [47], creating
safe, decent working conditions, and providing professional development and promotion
opportunities to their employees [48]. It is also worth mentioning that companies must
treat their employees fairly (without region or gender discrimination or abuse) as well as
offer their employees adequate medical insurance [28,38,39]. The following hypothesis
is assumed:
Hypothesis 4 (H4). CSR towards employees has a positive impact on overall CSR.Sustainability 2022, 14, 615 6 of 23
2.1.5. CSR towards Suppliers
There is an important link between suppliers and a company in a distribution chain
and that connection is key in a company’s business. The reason for this is that suppliers
provide a company with materials with reasonable prices and quality. If a company
does not fulfill its duties towards suppliers, the materials’ quality may be unreliable.
Consequently, its products and services can be affected. Therefore, embracing CSR towards
suppliers is of importance for a company to run its business [49]. CSR towards suppliers
can be considered as an enterprise providing fair terms and conditions for all suppliers.
Furthermore, enterprises must communicate openly, honestly, and confidentially, as well as
comply with contractual payment terms [28]. The following hypothesis is assumed:
Hypothesis 5 (H5). CSR towards suppliers has a positive impact on overall CSR.
2.1.6. CSR towards Shareholders
Shareholders are individuals who own a company’s shares. By investing in a company,
shareholders gain benefits from improving the company’s financial situation with a high
share dividend in return. Besides investing in a company, shareholders can engage in the
company’s activities, such as consulting and other assistance related tasks. Without share-
holders’ engagement, a company cannot operate well. In fact, CSR towards shareholders
is vital in a business—if a company does not take on the responsibility, it may struggle
with financial issues [50]. CSR towards shareholders can be considered as an enterprise
investing the capital of shareholders properly. Moreover, companies must respect their
shareholders by communicating openly and honestly with them. Finally, companies have
to guarantee sustainable development and long term success to the shareholders [28,38,47].
The following hypothesis is developed:
Hypothesis 6 (H6). CSR towards shareholders has a positive impact on overall CSR.
The utility formulation can be conceptualized as:
CSR = a0 + a1 Evn + a2 Soc + a3 Cus + a4 Emp + a5 Splr + a6 Sh + ε1 (1)
CSR: Consumers’ perspectives on CSR
Evn: CSR towards the environment
Soc: CSR towards society
Cus: CSR towards customers
Emp: CSR towards employees
Splr: CSR towards suppliers
Sh: CSR towards shareholders
2.2. Brand Attitude
Brand attitude is considered as the consumers’ willingness to show a favorable or
unfavorable reaction toward a certain brand [51]. An individual’s attitude toward any
brand is based on the information or knowledge he or she has gained through particular
sources, such as their family, friends, networking, cultural, and global aspects [52]. On the
other hand, together with engagement, those attitudes are founded through consumers’
experiences [53]. Gradually, consumers form their attitude toward the brand: they may
trust, like, or be loyal to the brand [54]. In this study, brand attitude refers to consumers’
attitudes towards brands that are socially responsible. Based on firms’ CSR engagement,
customers may have a positive view of companies or brands [55–57]. According to previous
research [58], CSR can be important for improving brand attitude. The following hypothesis
is developed:
Hypothesis 7 (H7). CSR has a positive influence on brand attitude.Sustainability 2022, 14, 615 7 of 23
2.3. Purchase Intention
Purchase intention is the inclination of consumers towards products or services. Specif-
ically, after making a certain evaluation, consumers have an intention to buy products or
use services [59]. Many factors influence consumers’ intentions [60]. The final decision
relies on consumers’ preferences as well as external aspects [61]. In this study, purchase
intentions refer to consumers’ intentions to purchase products from companies taking on
social responsibility [62]. Based on the theory of reasoned actions [63], personal attitudes
and behaviors have a relationship. According to [64], in the Italian banking industry, CSR
practices related to the environment, society, and ecosustainable projects are important;
at the same time, customers believe that there is a link between CSR practices and their
choice of banks. In the hospitality industry, during the COVID-19 pandemic, CSR practices
encouraged customers to prepay services [65]. In the wine industry, CSR towards the
environment receives a great deal of attention [66]. Therefore, we assume that purchase
intention is influenced by CSR and brand attitude. Thus, we form the final two hypotheses:
Hypothesis 8 (H8). CSR positively influences purchase intention.
Hypothesis 9 (H9). Brand attitude has positively impact on purchase intention.
The utility formulation can be conceptualized as:
BR = b0 + b1 CSR + ε2 (2)
PI = c0 + c1 CSR + c2 BR + ε3 (3)
BR: brand attitude
Sustainability 2022, 14, x FOR PEER REVIEW
PI: purchase intention 8 of 24
The conceptual model related to CSR, Brand attitude, and Purchase intention is
demonstrated in Figure 1.
Figure 1.
Figure Conceptual model.
1. Conceptual model.
3. Research Methodology
3. Research Methodology
3.1. Collect Data and Questionnaire
3.1. Collect Data and Questionnaire
A survey research method was conducted to obtain insights into CSR and its influence
A
on brandsurvey research
attitude method was
and purchase conducted
intention to as
as well obtain insights
test the into CSR
proposed and itsmodel.
conceptual influ-
ence on brand attitude and purchase intention as well as test the proposed
All question items of the questionnaire were composed to attain the most precise data to conceptual
model. Allreject
accept or question items of theinquestionnaire
the hypotheses the proposedwere model.composed to attain the
Multidimensional most precise
analysis results
data to accept
are needed; or reject the hypotheses
consequently, demographic in the proposedismodel.
information Multidimensional
collected. The research isanalysis
exempt
results
from theareregulations
needed; consequently, demographic
of the Institutional Reviewinformation
Board (IRB)isregarding
collected.theTheinvolvement
research is
exempt
of human from the regulations
subjects according to ofthe
theHelsinki
Institutional ReviewThe
declaration. Board (IRB)
reason regarding
is the researchthe in-
posed
volvement of human
almost no risks subjects
to human according
subjects. to the
Ethical Helsinkiwere
principles declaration.
abided by Theincluding
reason isprivacy
the re-
search posed almost no
and confidentiality, etc.risks
[67].toThe
human subjects. Ethical
questionnaires principles
contain were abided
information by includ-
about the reason
ing privacy andthe
for conducting confidentiality, etc. [67].
survey, instructions onThe questionnaires
answering, contain information
and a statement on assuringabout
their
the reason for conducting the survey, instructions on answering, and a statement on as-
suring their privacy and confidentiality. There are two parts to the questionnaires. The
first part contains 40 questions that asks consumers about their perspective on CSR to-
wards the environment, society, customers, employees, and suppliers, and overall CSR of
a hypothetical company, as well as their brand attitude and purchase intention. The sec-Sustainability 2022, 14, 615 8 of 23
privacy and confidentiality. There are two parts to the questionnaires. The first part contains
40 questions that asks consumers about their perspective on CSR towards the environment,
society, customers, employees, and suppliers, and overall CSR of a hypothetical company, as
well as their brand attitude and purchase intention. The second part contains 10 questions
about personal information. A 5-point Likert scale (totally disagree = 1 to totally agree = 5)
is used to evaluate the variables [68]. The questionnaire was first composed in English
and then translated into three languages, including Chinese, Indonesian, and Vietnamese.
Therefore, respondents across three areas (Taiwan, Indonesia, and Vietnam) can understand
the questionnaire holistically without any confusion during the answering process.
The questionnaires were distributed mainly via Google Forms to alleviate the accu-
mulation of defective data that might otherwise impact the analysis results. Through the
qualitative research results, as the preliminary survey, the observed variables have been
adjusted and supplemented to match the research. To collect the data, a nonprobability
convenience sampling was accepted with the purpose of theory testing [69]. The eligibility
criteria are consumers over 16 years old residing in the three target countries with accept-
able reading comprehension. Initially, 616 participants took part in the survey, however,
11 respondents were not from the three target areas, 9 samples were under 16 years old, and
32 samples were disqualified because survey takers missed some questions or answered
questions carelessly (all answers are the same, etc.). After eliminating improper samples, the
number of qualified samples was 564, including 186 respondents from Vietnam, 189 from
Indonesia, and 189 from Taiwan. The reliability of research constructs can be assessed by
using Cronbach’s alpha values [70] in each dataset and the pooled data.
3.2. Data Analysis
3.2.1. Descriptive Statistics
Descriptive statistics are used to demonstrate the basic traits of data gathered from
empirical research in numerous ways [71]. It is considered an indicator for depicting
quantitative information in a brief structure. This technique is remarkably useful for
helping us to understand and demonstrate features or characteristics of a certain dataset by
briefly summarizing the samples and their parameters. The most commonly used types are
concentrated trend parameters, including mean, median, and weak, which are used in most
—if not all—levels of mathematics and statistics. There are two basic types of measurement:
centralized trend measurement and volatility or dispersion measurement. The former
describes the center of a dataset whereas the latter demonstrates the dispersion of data.
The demographic statistic is usually applied in qualitative and demographic variables [72].
In this study, STATISTICA 10 is applied since it offers a variety of integrated statistical
information such as age, occupation, income, etc. [73].
3.2.2. Regression Analysis
The most primitive form of regression analysis is the method of least squares, which
was first used scientifically in 1885 [74]. Moreover, the method was developed as the
method of least squares procedures [75]. Regression analysis is defined as an analytical
method to understand the relationship between a dependent variable and independent
variables [76]. In addition, it can be used to estimate and predict the expected value of a
dependent variable in a conceptual model. After performing regression analysis with the
Minitab 19 software, we obtain results including the beta coefficient (β), p-value, t-value,
and R2 . Next, we can use these to evaluate whether or not the hypotheses should be
accepted or rejected. Adjusted R2 indicates how independent variables influence the
dependent variable. In theory, if it is good (over 50%), the study is well justified [77]. In
addition, p-value is the probability that the null hypothesis is supported. At large, a variable
with a p-value not over 0.05 shows that the variable, within the model, is significant; while
a p-value exceeding 0.05 implies that the variable should be removed [77]. Regarding the
beta coefficient (β), which independent factor has the largest beta coefficient also has the
greatest influence on the change in the dependent variable.Sustainability 2022, 14, 615 9 of 23
3.2.3. Linear Structural Relations (LISREL)
LISREL is a statistics software for modeling structural equations [78] and was used as
a research tool in 1972 [79]. For this research, LISREL 8.8 software was used. The reason
for applying it is that we can test the hypotheses in the proposed model easily and flexibly.
Moreover, we can use this software in various fields thanks to the ability of this software to
easily adapt according to the situation, especially in constructing models for estimating
relationships between independent and dependent variables. The third reason is providing
crucial indicators such as χ2 /df, P, RMSEA, AGFI, PGFI, GFI, NFI, CFI, IFI, and SRMR,
LISREL also helps us determine the goodness of fit test [80]. Importantly, the results from
running LISREL 8.8 also show the model’s structural validity, and the t-test helps determine
any significant relationship between the two variables. In theory, NFI should be over
0.9 [81], GFI and CFI higher than 0.9 [82].
4. Results
4.1. Demographic Statistics
Questionnaires were distributed over two months from 3 September 2021, to 19 Novem-
ber 2021, via an online survey—Google Forms in Vietnamese, Indonesian, Chinese, and
English. According to previous research, monetary incentives are beneficial to enhance
the response rate and completion rate [83]. Therefore, the authors used a lottery-style
approach, which means we provided a USD 25 gift to the luckiest respondent by a random
draw. Overall, we attained 616 responses. However, 52 participants were not qualified
and 564 complied with the requirements of the survey. Table 1 depicts the demographic
profile of the collected data. There are 186 Vietnamese, 189 Indonesian, and 189 Taiwanese
respondents, which accounts for about 33% of each region. According to previous studies,
urban vs rural differences are prone to obscure sophisticated influences [84]; measure of
urban vs rural characteristics is considered in the research. The percentage of urban partici-
pants (78.01%; 440 samples) is four times higher than that for rural counterparts—21.99%;
124 samples. Moreover, 60.82% of the total participants are females while 39.18% are males.
Only 11.88% are high school students, the rest completed higher education. Maritalwise,
the number of single participants is dominant, with 436 samples (77.30%), while married
individuals occupy 22.16% (125 samples). Regarding age, the proportion of individuals
from 18 to 35 years old constitutes 82.62% (466 samples). The data show that respondents
with the lowest income (less than USD 250 per month) take up the highest rate (37.23%;
210 samples), while those making the highest income (over USD 5000 per month) make up
the smallest proportion (0.89%; 5 samples).
Table 1. Demographic statistics (n = 564).
Characteristics Freq. (%) Characteristics Freq. (%)
Location 564 100.00% Age 564 100.00%
Vietnam 186 32.98% Under 18 2 0.35%
Indonesia 189 33.51% 18–25 281 49.82%
Taiwan 189 33.51% 26–35 185 32.80%
Area 564 100.00% 36–45 40 7.09%
Countryside 124 21.99% 46–55 33 5.85%
City 440 78.01% Over 55 23 4.08%
Gender 564 100.00% Occupation 564 100.00%
Female 343 60.82% Student 270 47.87%
Male 221 39.18% Com. employee 178 31.56%
Education 564 100.00% Civil servant 20 3.55%
Highschool grad 67 11.88% Self employed 81 14.36%
VoTech program 25 4.43% Homemaker 13 2.30%
Bachelor’s degree 377 66.84% Retired 2 0.35%
Master’s degree 93 16.49% Monthly income 564 100.00%
Doctoral degree 2 0.35% Less than USD 250 210 37.23%Sustainability 2022, 14, 615 10 of 23
Table 1. Cont.
Characteristics Freq. (%) Characteristics Freq. (%)
Marital status 564 100.00% USD 251–500 138 24.47%
Single 436 77.30% USD 501–1000 119 21.10%
Married 125 22.16% USD 1001–2500 78 13.83%
Divorced 1 0.18% USD 2501–5000 14 2.48%
Widow 2 0.35% >USD 5000 5 0.89%
Based on the database collected, Cronbach’s alpha values were utilized to test the
reliability of research constructs. Table 2 shows that all Cronbach’s alpha indicators of the
pooled data and each dataset surpass the generally agreed threshold of 0.8 [85]. Therefore,
the research is reliable for each location and the cross locations.
Table 2. Construct reliability (Cronbach’s alpha).
Constructs Pooled Vietnam Indonesia Taiwan
Evn 0.91 0.88 0.92 0.93
Soc 0.5 0.94 0.95 095
Cus 0.8 0.87 0.89 0.87
Emp 0.96 0.94 0.97 0.97
Splr 0.92 0.94 0.93 0.90
Sh 0.96 0.95 0.97 0.97
CSR 0.87 0.86 0.85 0.90
BR 0.89 0.85 0.87 0.95
PI 0.83 0.84 0.82 0.82
4.2. Regression Analysis and LISREL Testing
4.2.1. Regression Analysis
Based on the database collected, regression analysis was carried out via Minitab 19
software. According to the proposed models, we performed a regression analysis based
on Equations (1)–(3) with four datasets. The results demonstrated in Table 3 show that, in
three regression models for Equations (1)–(3) with four datasets, R2 and adjusted R2 , are
over 0.05, which means all models are well justified. Moreover, we observed that indexes
such as R2 and the adjusted R2 of model 1 are higher than those of models 2 and 3 in the
four datasets. Therefore, model 1 is more justified than models 2 and 3.
Table 3. Regression model.
Pooled Vietnam Indonesia Taiwan
Equation (1) Regression summary for dependent variable CSR
R2 0.72 0.64 0.74 0.78
Adjusted R2 0.71 0.63 0.74 0.77
p-value 0.00 0.00 0.00 0.00
Coefficients
β (t-value) β (t-value) β (t-value) β (t-value)
(Constant) 0.09 (0.87) 0.34 (1.48) 0.12 (0.72) −0.07 (−0.40)
Evn 0.18 (3.43) * 0.04 (0.39) 0.31 (3.55) * 0.18 (2.16) *
Soc 0.22 (3.48) * 0.10 (0.65) 0.18 (1.98) * 0.25 (2.40) *
Cus 0.33 (7.39) * 0.29 (3.35) * 0.35 (4.85) * 0.31 (4.19) *
Emp 0.20 (2.67) * 0.62 (3.86) * −0.00 (−0.03) −0.03 (−0.23)
Splr 0.16 (2.68) * 0.23 (1.76) 0.23 (2.42) * 0.11 (1.17)
Sh −0.13 (−1.97) * −0.38 (−3.00) * −0.12 (−1.14) 0.19 (1.67)Sustainability 2022, 14, 615 11 of 23
Table 3. Cont.
Pooled Vietnam Indonesia Taiwan
Equation (2) Regression summary for dependent variable BR
R2 0.60 0.52 0.67 0.60
Adjusted R2 0.60 0.52 0.67 0.60
p-value 0.00 0.00 0.00 0.00
Coefficients
β (t-value) β (t-value) β (t-value) β (t-value)
(Constant) 0.93 (8.57) * 1.15 (5.45) * 0.82 (5.06) * 0.85 (4.30) *
CSR 0.77 (28.91) * 0.70 (14.11) * 0.80 (19.33) * 0.82 (16.77) *
Equation (3) Regression summary for dependent variable PI
R2 0.54 0.57 0.53 0.55
Adjusted R2 0.54 0.56 0.52 0.55
p-value 0.00 0.00 0.00 0.00
Coefficients
β (t-value) β (t-value) β (t-value) β (t-value)
(Constant) 0.57 (4.74) * 0.41 (1.78) * 0.48 (2.31) * 0.82 (4.31) *
CSR 0.24 (5.50) * 0.06 (0.79) 0.35 (4.04) * 0.29 (4.15) *
BR 0.51 (11.66) * 0.75 (10.15) * 0.41 (4.72) * 0.04 (5.94) *
Note: * indicates p-value ≤ 0.05.
Model 1 relating to Equation (1) is built as follows:
For the pooled data
CSR= 0.09 +0.18 × Evn +0.22 × Soc +0.33 × Cus
(0.87) (3.43) (3.48) (7.39)
(0.38) (0.00) (0.00) (0.00)
+0.20 × Emp +0.16 × Splr −0.13 × Sh
(2.67) (2.68) (−1.97)
(0.01) (0.01) (0.05)
For Vietnamese data
CSRV = 0.34 +0.04 × EvnV +0.10 × SocV +0.29 × CusV
(1.48) (0.39) (0.65) (3.35)
(0.14) (0.70) (0.51) (0.00)
+0.62 × EmpV +0.23 × SplrV −0.38 × ShV
(3.86) (1.76) (−3.00)
(0.00) (0.08) (0.00)
For Indonesian data
CSRI = 0.12 +0.31 × EvnI +0.18 × SocI +0.35 × CusI
(0.72) (3.55) (1.98) (4.85)
(0.48) (0.00) (0.05) (0.00)
−0.00 × EmpI +0.23 × SplrI −0.12 × ShI
(−0.03) (2.42) (−1.14)
(0.98) (0.02) (0.26)
For Taiwanese data
CSRT = −0.07 +0.18 × EvnT +0.25 × SocT +0.31 × CusT
(−0.40) (2.16) (2.40) (4.19)
(0.69) (0.03) (0.02) (0.00)
−0.03 × EmpT +0.101 × SplrT +0.19 × ShT
(−0.23) (1.17) (1.67)
(0.82) (0.24) (0.10)
Model 2 relating to Equation (2) is built as follows:Sustainability 2022, 14, 615 12 of 23
For the pooled data
BR= 0.93 +0.77 × CSR
(8.57) (28.91)
(0.00) (0.00)
For Vietnamese data
BRV = 1.15 +0.70 × CSRV
(5.45) (14.11)
(0.00) (0.00)
For Indonesian data
BRI = 0.82 +0.80 CSRI
(5.06) (19.33)
(0.00) (0.00)
For Taiwanese data
BRT = 0.85 +0.82× CSRT
(4.30) (16.77)
(0.00) (0.00)
Model 3 relating to Equation (3) is constructed as follows:
For the pooled data
PI= 0.57 +0.24 × CSR +0.51 × BR
(4.74) (5.50) (11.66)
(0.00) (0.00) (0.00)
For Vietnamese data
PIV = 0.41 +0.06 × CSRV +0.75 × BRV
(1.78) (0.79) (10.15)
(0.08 (0.43) (0.00)
For Indonesian data
PII = 0.48 +0.35 × CSRI +0.41 × BRI
(2.31) (4.04) (4.72)
(0.02) (0.00) (0.00)
For Taiwanese data
PIT = 0.82 +0.29 × CSRT +0.40 × BRT
(4.31) (4.15) (5.94)
(0.00) (0.00) (0.00)
Table 4 shows the results of hypotheses testing. For the pooled data, all hypotheses
are supported except H6 (β = −0.13 < 0). For each regional data, we find that H3, H7, and
H9 are supported, while H6 is rejected in all three areas. Both Indonesian and Taiwanese
data support H1, H2, and H8 while those hypotheses are rejected in Vietnam. However,
regarding H4, Vietnamese data supports it (β = 0.62 > 0 and p-value ≤ 0.05) whereas
both Indonesian and Taiwanese information rejected it. In contrast, H5 is supported with
Indonesian data (β = 023 > 0 and p-value ≤ 0.05), while it is rejected in both Vietnam
and Taiwan.
Table 4. Hypotheses testing—regression.
Supported (β)
Hypotheses
Pooled Vietnam Indonesia Taiwan
Yes No Yes Yes
H1: Evn → CSR
0.18 * 0.04 0.31 * 0.18 *
Yes No Yes Yes
H2: Soc → CSR
0.22 * 0.10 0.18 * 0.25 *
Yes Yes Yes Yes
H3: Cus → CSR
0.33 * 0.29 * 0.35 * 0.31 *
Yes Yes No No
H4: Emp → CSR
0.20 * 0.62 * 0.00 −0.03
Yes No Yes No
H5: Splr → CSR
0.16 * 0.23 0.23 * 0.11
No No No No
H6: Sh → CSR
−0.13 * −0.38 * −0.12 0.19Sustainability 2022, 14, 615 13 of 23
Table 4. Cont.
Supported (β)
Hypotheses
Pooled Vietnam Indonesia Taiwan
Yes Yes Yes Yes
H7: CSR → BR
0.77 * 0.70 * 0.80 * 0.82 *
Yes No Yes Yes
H8: CSR → PI
0.24 * 0.06 0.35 * 0.29 *
Yes Yes Yes Yes
H9: BR → PI
0.51 * 0.75 * 0.41 * 0.40 *
Note: * indicates p-value ≤ 0.05. Supported: yes (β > 0 and p-value ≤ 0.05).
4.2.2. LISREL Testing
• Covariance matrix
The covariance matrix depicting the linear relationship between constructs is demon-
strated in Table 5 for the pooled Vietnamese, Indonesian, and Taiwanese data. It can be
seen that all values in the matrix are positive, showing an increasing linear relationship
between the constructs.
Table 5. Covariance matrix of the measure variables.
Pooled CSR BR PI Evn Soc Cus Emp Splr Sh
CSR 1.04
BR 0.80 1.04
PI 0.66 0.72 0.97
Evn 0.75 0.72 0.56 0.89
Soc 0.85 0.83 0.59 0.81 1.12
Cus 0.69 0.61 0.54 0.67 0.68 0.79
Emp 0.85 0.83 0.58 0.82 1.02 0.69 1.10
Splr 0.85 0.80 0.57 0.82 1.03 0.68 1.02 1.15
Sh 0.85 0.85 0.57 0.86 1.04 0.71 1.08 1.05 1.20
Vietnam CSR BR PI Evn Soc Cus Emp Splr Sh
CSR 0.87
BR 0.61 0.82
PI 0.51 0.66 0.92
Evn 0.52 0.48 0.42 0.68
Soc 0.62 0.57 0.50 0.60 0.82
Cus 0.55 0.49 0.46 0.56 0.56 0.72
Emp 0.63 0.56 0.50 0.60 0.74 0.58 0.77
Splr 0.62 0.58 0.47 0.60 0.77 0.54 0.73 0.84
Sh 0.57 0.55 0.48 0.61 0.74 0.57 0.73 0.74 0.82
Indonesia CSR BR PI Evn Soc Cus Emp Splr Sh
CSR 1.10
BR 0.88 1.05
PI 0.75 0.74 1.07
Evn 0.88 0.84 0.63 1.06
Soc 0.91 0.87 0.58 0.94 1.25
Cus 0.76 0.70 0.59 0.77 0.72 0.86
Emp 0.90 0.86 0.54 0.98 1.12 0.77 1.26
Splr 0.97 0.87 0.58 1.00 1.18 0.78 1.20 1.38
Sh 0.92 0.92 0.53 1.03 1.16 0.78 1.25 1.25 1.42
Taiwan CSR BR PI Evn Soc Cus Emp Splr Sh
CSR 1.09
BR 0.89 1.21
PI 0.67 0.74 0.89
Evn 0.79 0.83 0.61 0.87
Soc 0.96 1.02 0.65 0.83 1.22
Cus 0.68 0.61 0.53 0.62 0.66 0.70
Emp 0.96 1.04 0.67 0.85 1.15 0.68 1.24
Splr 0.90 0.94 0.60 0.79 1.05 0.64 1.08 1.13
Sh 1.00 1.07 0.68 0.89 1.16 0.71 1.21 1.09 1.30Sustainability 2022, 14, 615 14 of 23
• Goodness of fit testing
In the study, goodness of fit testing was used to evaluate the covariance between the
variables. Indexes are demonstrated in Table 6. The χ2 /df of the pooled database and
that of each region are significant. The explanation for this is that the data are collected
from respondents from all walks of life in three locations (different areas, ages, educational
background, marital status, jobs, and monthly income). This index is high and p < 0.000,
which means that the one-factor model does not fit the data. However, it cannot negate the
proposed models, since χ2 is sensitive to the size and diversity of the samples [86]. Further-
more, the index is nonparametric statistics [87] and the possibility of finding differences
is less than the parameter tests [88]. Consequently, the χ2 test is not as suited as a general
independent test [89]. Indices such as RMSEA, AGFI, and PGFI were not fit. However,
indices, namely, GFI, NFI, CFI, and IFI are over 0.9, and SRMR is less than 0.08. Therefore,
the model can be considered as accepted.
Table 6. Measurement of goodness of fit statistics.
Fit Measures Pooled Vietnam Indonesia Taiwan Statistics Target
χ2 /df 14.17 3.28 5.65 8.89
P 0.00 0.00 0.00 0.00
RMSEA 0.15 0.11 0.16 0.21 Lower than 0.08
AGFI 0.76 0.83 0.72 0.59 Higher than 0.9
PGFI 0.25 0.25 0.25 0.24 Higher than 0.5
GFI 0.94 0.95 0.93 0.90 Higher than 0.9
NFI 0.98 0.99 0.98 0.97 Higher than 0.9
CFI 0.98 0.99 0.98 0.97 Higher than 0.9
IFI 0.98 0.99 0.98 0.97 Higher than 0.9
SRMR 0.06 0.08 0.049 0.074 Lower than 0.08
• Hypotheses testing
Table 7 shows hypotheses testing. With the pooled data, apart from H6, all hypotheses
are supported. For each regional data, H3, H7, and H9 are accepted while H6 is rejected
in all three areas. Moreover, Indonesian and Taiwanese data support H1, H2, and H8
whereas those hypotheses are refused in Vietnam. Regarding H4, Vietnamese data support
it (Est. = 0.20 > 0 and |t-value| ≥ 1.96) while both Indonesian and Taiwanese information
rejects it. Nonetheless, H5 is accepted with Indonesian data while it is rejected with both
Vietnamese and Taiwanese data.
Table 7. Hypotheses testing—LISREL.
Supported (Est.)
Hypotheses
Pooled Vietnam Indonesia Taiwan
Yes No Yes Yes
H1: Evn → CSR
0.18 * 0.04 0.31 * 0.18 *
Yes No Yes Yes
H2: Soc → CSR
0.22 * 0.10 0.18 * 0.25 *
Yes Yes Yes Yes
H3: Cus → CSR
0.33 * 0.29 * 0.35 * 0.31 *
Yes Yes No No
H4: Emp → CSR
0.20 * 0.62 * −0.00 −0.03
Yes No Yes No
H5: Splr → CSR
0.16 * 0.23 0.23 * 0.11
No No No No
H6: Sh → CSR
0.13 * 0.38 * −0.12 0.19Sustainability 2022, 14, 615 15 of 23
Sustainability 2022, 14, x FOR PEER REVIEW 16 of 24
Sustainability 2022, 14, x FOR PEER REVIEW 16 of 24
Table 7. Cont.
No
No No
No No No
H6: Sh
H6: Sh → CSR
→ CSR
Hypotheses 0.13 ** Supported (Est.)
0.38 * No No
Pooled 0.13 Vietnam 0.38 * Indonesia −0.12
−0.12 Taiwan 0.19
0.19
Yes Yes Yes Yes Yes Yes Yes Yes
H7: CSR → BR
H7: CSR
H7: → BR
CSR → BR 0.77 * Yes 0.70 * Yes 0.80 * Yes 0.82 * Yes
Yes 0.77 ** No
0.77 0.70 ** Yes
0.70 0.80 ** Yes
0.80 0.82 **
0.82
H8: CSR → PI
0.24 * Yes 0.06 No 0.35 * Yes 0.29 * Yes
H8: CSR
CSR → → PI
PI Yes
Yes Yes
No Yes Yes
H8:
H9: BR → PI 0.24 **
0.24 0.06 Yes
0.06 0.35 ** Yes
0.35 0.29 **
0.29
0.51 * 0.75 * 0.41 * 0.40 *
Yes Yes Yes Yes
Note:
H9:: BR
H9
*
BR → → PI
indicates
PI |t-value| ≥ 1.96; Yes
supported: Yes (Est. > 0 and Yes
|t-value| ≥ 1.96). Yes Yes
0.51
0.51 *
* data, Vietnamese0.75
0.75 ** 0.41 **
0.41 0.40 **
0.40
Note: *The result |t-value|
indicates of LISREL≥for thesupported:
1.96; pooled Yes (Est. > 0 and data, Indonesian
|t-value| ≥ 1.96).data, and
Note: * indicates
Vietnamese data|t-value| ≥ 1.96;
are depicted supported:
in Figures Yes (Est. > 0 and |t-value| ≥ 1.96).
2–5 respectively.
Figure 2.2.Result of LISREL
Result of LISREL forthe
the pooled data.
Figure2.
Figure Result LISRELfor
for thepooled data.
pooled data.
Figure 3. Result of LISREL for Vietnamese data.
Figure 3. Result of LISREL for Vietnamese data.
Figure 3. Result of LISREL for Vietnamese data.Sustainability 2022, 14, x FOR PEER REVIEW 17 of 24
Sustainability 2022, 14, 615 16 of 23
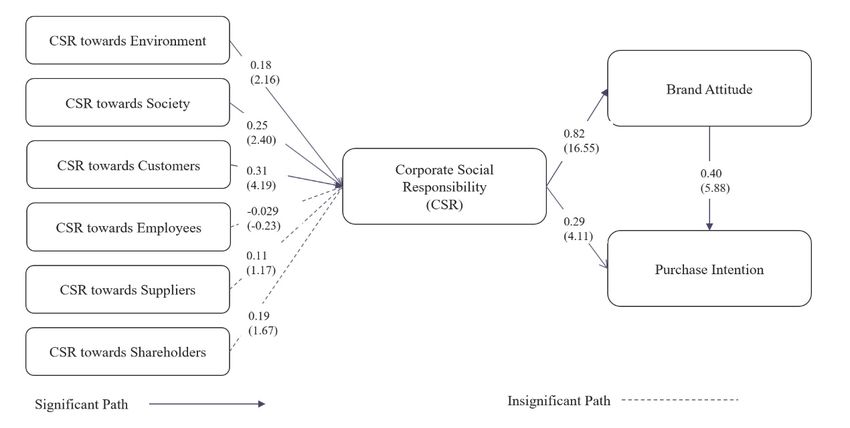
ResultofofLISREL
Figure4.4.Result
Figure LISRELfor
forIndonesian
Indonesiandata.
data.
Figure 5. Result of LISREL for Taiwanese data.
Figure 5. Result of LISREL for Taiwanese data.
4.2.3. Comparison of the Regression Analysis and LISREL Model
4.2.3. Comparison of the Regression
Regression analysis Analysis
is a reliable and LISREL
and powerful toolModel
that can solve the relationship
between independent and dependent variables as linear
Regression analysis is a reliable and powerful tool that can solve models. In regression models,
the relationship be-R2
and adjusted
tween R2 demonstrate
independent and dependent structural validity.
variables In thismodels.
as linear research,In all indices ofmodels,
regression the pooled
R22
database
and adjustedor each area are over
R2 demonstrate
2 0.5, particularly,
structural validity.some
In thisindices are over
research, 0.7. Therefore,
all indices we can
of the pooled
consideror
database theeach
modelareaasare
reaching theparticularly,
over 0.5, fit. Regarding LISREL,
some the are
indices advantage
over 0.7.isTherefore,
that it is highly
we
flexible
can for concluding
consider the model as thereaching
relationship of Regarding
the fit. variables. In this study,
LISREL, some indices
the advantage are fitted,
is that it is
however,
highly others,
flexible for such as RMSEA,
concluding AGFI, and PGFI,
the relationship are not suitable
of variables. (RMSEA
In this study, someis much
indices higher
are
than the cut-off value = 0.05 and AGFI and PGFI are way lower
fitted, however, others, such as RMSEA, AGFI, and PGFI, are not suitable (RMSEA is than the requirement).
Therefore,
much higherwe could
than thenot claimvalue
cut-off that the model
= 0.05 andisAGFI
fully fitted.
and PGFI are way lower than the
requirement). Therefore, we could not claim that that
Comparing the two methods, we found the regression
the model model is better than
is fully fitted.
the Comparing
LISREL model due methods,
the two to its validity.
we found However,
that theboth methods
regression showed
model similarities
is better than thein
supporting or rejecting the hypotheses. Especially for the pooled
LISREL model due to its validity. However, both methods showed similarities in support- data, we rejected H6
and accepted the rest. We also rejected two hypotheses with Indonesian
ing or rejecting the hypotheses. Especially for the pooled data, we rejected H6 and ac- data and rejected
three with
cepted Taiwanese
the rest. We alsodata. However,
rejected in Vietnam,
two hypotheses with four hypotheses
Indonesian datawereand accepted while
rejected three
five hypotheses were rejected.
with Taiwanese data. However, in Vietnam, four hypotheses were accepted while five
hypotheses were rejected.
5. Discussion and Conclusions
5.1. Summary of Results
Overall, for pooled data, CSR towards shareholders can be ignored while CSR towards
other issues positively influences CSR. In particular, CSR towards customers is the most
important factor. Furthermore, CSR significantly affects brand attitude and purchaseSustainability 2022, 14, 615 17 of 23
intention. Moreover, the influence of CSR on brand attitude is higher than it is on purchase
intention. Brand attitude significantly positively influences purchase intention.
Observing the Vietnamese data, CSR towards employees is the most important factor,
followed by CSR towards customers, while other issues can be ignored. The result shows
that CSR significantly influences brand attitude but does not affect purchase intention.
Brand attitude still has a significant positive impact on purchase intention.
Regarding the Indonesian data, CSR towards customers is the most important factor,
followed by the environment and society, while other factors can be neglected. CSR also has
a positive impact on brand attitude and purchase intention (the impact of CSR on the former
is much higher than on the latter). Furthermore, purchase intention is still influenced by
brand attitude and the influence is higher than CSR’s influence on purchase intention).
For the Taiwanese data, CSR towards customers is the most significant influence on
CSR, followed by CSR towards society and the environment, whereas other aspects related
to employees, suppliers, or shareholders can be ignored. Moreover, CSR has a significant
impact on brand attitude. The influence of brand attitude is higher than the effect of CSR
on purchase intention.
5.1.1. The Correlation across All Areas
Regarding the pooled data across all three areas, the results showed that some aspects—
namely, the environment, society, customers, employees, and suppliers—have a positive
impact on CSR. The explanation lies in the fact that, since the COVID-19 pandemic, cus-
tomer perspectives have changed significantly. Specifically, for societal issues, employees
are given a great deal of consideration. Additionally, together with the increasing aware-
ness of the environment, issues such as environmental deterioration or natural disasters are
becoming, in general, a pressing concern across the world [90]—particularly in Vietnam,
Indonesia, and Taiwan. However, from the customers’ standpoint, the conflict between
shareholders’ benefits and customers still exists [91]. Implementing CSR leads to an in-
crease in company costs and risks, together with a decrease in shareholders’ benefits [92].
In this regard, taking on responsibility towards shareholders has no impact on CSR; this is
in contrast to prior research. In terms of brand attitude, CSR has a significantly positive
impact on it. In other words, customers are likely to exhibit favorable feelings towards
brands that engage in social responsibility. Additionally, the results depict that there is a
positive correlation between brand attitude and purchase intent.
5.1.2. The Correlation per Area
The effect of the environment on CSR varies across the three locations. Indonesian
customers perceive the environment positively influences CSR, and its effect is higher
than in Taiwan. However, it has no positive effect on CSR in Vietnam. In the Quran—the
equivalent of the Christian Bible—Earth is mentioned over 400 times and Muslims are
called to save it [93]. According to Islamic beliefs, environmental issues are seriously
considered [94]. In Indonesia—an Islamic country—in the 1960s, the Suharto regime
concentrated on economic growth together with environmental efforts [95]. Therefore,
Indonesian people are likely to have a much higher awareness of the environment. Previous
research shows that the concept of environmental sustainability bears resemblance to Taoist
(Daoist) principles [96]. In Taiwan, many people are Taoists [97]; issues relating to the
environment, therefore, are pervasive throughout the culture. Since 1992, Taiwan has
progressed positively towards environmental sustainability [98]. As a result, Taiwanese
people are paying much attention to the environment. Nonetheless, in Vietnam, consumers’
awareness of environmental and social issues is still limited [99]. As mentioned in previous
studies [100,101], these days, economic activities are in opposition to the socialist ideology
declared by the party state, which has failed the environment and society [8]. In contrast,
in Taiwan and Indonesia, social issues have caught the public’s attention.
From the customer’s perspective, their rights and benefits are crucially important.
Consequently, fulfilling duties towards customers positively influence CSR in three areas.Sustainability 2022, 14, 615 18 of 23
A new point of this research that is different from previous CSR research is that CSR
towards shareholders does not impact CSR. This is because customers tend to believe that
there is a conflict between shareholders’ values and customers’ benefits [91]. Regarding
employees’ benefits, in Vietnam, employees are positively affected by CSR while they
are not in the other two areas. On the one hand, Vietnamese culture has been affected by
Buddhism, Confucianism, and Taoism (Daoism), therefore, the centrality of nhan (humanity,
humanness) plays an important role in moral values [8]. On the other hand, in Taiwan,
nowadays, the COVID-19 pandemic has been severe, leading to job losses, and many
employees continue to struggle from the pandemic’s fallout. Therefore, employee related
issues are taken into citizens’ consideration. Regarding Indonesia, its economy is the largest
in Southeast Asia and the country is an emerging global economy. Over the past decade, the
Indonesian economy has developed rapidly and, by 2030, is likely to become the seventh
largest economy in the world [102]. It is reasonable to postulate that, in Indonesia, issues
related to the economy or supply chain are worth considering. CSR towards suppliers,
therefore, has a positive impact on CSR.
Regarding the relationship between CSR and brand attitude, in three areas, CSR
has a positive influence on brand attitude. In particular, the impact of CSR in Taiwan is
the greatest, followed by Indonesia, and Vietnam. This means that Taiwanese consumers
display their affinity towards CSR brands more than Indonesian and Vietnamese consumers.
Moreover, when it comes to purchase intention, CSR takes effect in Indonesia and Taiwan.
Specifically, Indonesian consumers are influenced by CSR more than their Taiwanese
counterparts. Nevertheless, Vietnamese customers are not affected. Regarding the link
between brand attitude and purchase intention, three areas experience positive relations.
5.2. Theoretical Contribution
The academic contributions of this research are as follows. Firstly, based on stake-
holder theory, this research assessed customers’ perspectives on overall CSR and in each
domain. In addition, this work analyzed CSR components and ascertained the influences
of the components, including the environment, society, customers, employees, and sup-
pliers, on CSR. Moreover, the study showed that, in the three areas during the COVID-19
pandemic, taking on responsibility towards shareholders does not influence CSR—an
obvious departure from prior studies. This could be explained by the fact that, during the
COVID-19 pandemic, customers focused more on their benefits and other issues instead of
shareholders’ interest. Secondly, regarding the applied theory of reasoned actions [63], this
study constructed a model of purchase intention based on CSR and brand attitude. The
results showed that, with the pooled data, CSR positively influences brand attitude and
purchase intention; additionally, brand attitude also affects customers’ purchasing intent.
Thirdly, the survey was conducted across three different locations with different cultures
and economic statuses. This provides a comprehensive picture of customers’ perspectives
on CSR to brand attitude and purchase intent during the COVID-19 pandemic. In particu-
lar, Vietnamese people focus more on human issues, such as CSR towards customers and
employees. Furthermore, in Vietnam—a communist country—CSR does not have a positive
effect on purchase intention. However, apart from CSR towards customers, Taiwanese and
Indonesian citizens pay attention to environmental and social issues.
5.3. Managerial Implications
Evaluating customers’ perceptions of CSR allows companies to measure customers’
awareness level of their CSR practices [28], and the effect of CSR on brand attitude and
purchase intention. This research can be applied to launch improved strategies for busi-
nesses. Regarding the importance of CSR, in general, companies should pay more attention
to CSR practices to enhance brand attitude and purchase intention in crises such as the
current COVID-19 pandemic. However, in Vietnam, the COVID-19 pandemic is likely to
amplify customers’ perspectives on prices, therefore, companies should weigh the costs
and benefits associated with taking on CSR practices. Focusing on each area, it can beYou can also read