Consumer Surplus Changing in the Transition from State Natural Monopoly to the Competitive Market in the Electricity Sector in the Developing ...
←
→
Page content transcription
If your browser does not render page correctly, please read the page content below
International Journal of Energy Economics and
                                                       Policy
                                                               ISSN: 2146-4553

                                               available at http: www.econjournals.com
                                  International Journal of Energy Economics and Policy, 2020, 10(2), 265-275.

Consumer Surplus Changing in the Transition from State
Natural Monopoly to the Competitive Market in the Electricity
Sector in the Developing Countries: Azerbaijan Case

Mayis Gulali Gulaliyev1*, Gulshen Zahidqizi Yuzbashiyeva1, Gulnara Vaqifqizi Mamedova1,
Samira Tahmazqizi Abasova2, Fariz Rafiq Salahov1, Ramil Ramiz Askerov1

Institute of Economics, Azerbaijan National Academy of Sciences, Baku, Azerbaijan, 2Azerbaijan State University of Economics,
1

Baku, Azerbaijan, *Email: mayis_gulaliyev@yahoo.com

Received: 28 September 2019                                  Accepted: 04 January 2020                      DOI: https://doi.org/10.32479/ijeep.8909

ABSTRACT
The objectives of the study are to analyze changes in consumer surplus and protect the social interest of poor households (HHs) in the transition from a
state monopoly over the electricity sector to the market. For this purpose, the volume of HH electricity consumption by various incomes was calculated,
the electricity demand function of HHs and the marginal cost of generating electricity were constructed. A methodology is given for calculating the
electricity demand function for HHs and prices in an equilibrium market. The consumer surplus and its change are calculated. As well as there are
given some recommendations to reduce the social burden for certain HH groups while raising prices in the transition from a monopoly to the market,
and the amount for the state subsidy for poor HHs.
Keywords: Consumer Surplus, Producer Surplus, Electric Power Sector, Pricing, Marginal Cost, Average Costs
JEL Classifications: D42, L51

                    1. INTRODUCTION                                           and medium-sized businesses, but reduces the income of electricity
                                                                              production companies. In such situations, demand volume usually
In many developing countries, especially in the countries of the              unreasonably increases and the quality of power supply decreases.
former Soviet Union, including Azerbaijan, the entire electric
power system, including production, transmission, distribution                Related with an increasing of incomes and market thinking of the
and sale, is under state monopoly. All electricity companies are              population, as well as in connection with the state liberalization
state owned, and the price of electricity is determined by the Tariff         policy in recent years, a need has arisen for a transition from a
Council under the government (TCRA). As usual, the state as a                 natural state monopoly in the electricity sector to market relations in
natural monopolist, unlike a monopolist in the market, keeps prices           the countries of the former Soviet Union, including in Azerbaijan.
below market to protect the interests of the population. At the same          Privatization of some fields of the electricity sector, for example,
time, producer losses for low prices are covered from the state               production and retail sales, is strategic vision of many developing
budget. This is due to government policies to protect household               countries, e.g., of Azerbaijan (SRM, 2016). At the initial stage of
(HH) interests. Most states where there is a state monopoly in                privatization, there is a high probability for price increasing in this
the electricity sector, the state sets prices below real to reduce the        strategically important sector and this can lead to social problems
cost of electricity for businesses. Such government intervention in           for HHs, as well as lead to changes of the business environment
pricing reduces energy costs and stimulates the actions of small              for small and medium-sized businesses. Therefore, there is a need

                              This Journal is licensed under a Creative Commons Attribution 4.0 International License

                 International Journal of Energy Economics and Policy | Vol 10 • Issue 2 • 2020                                                   265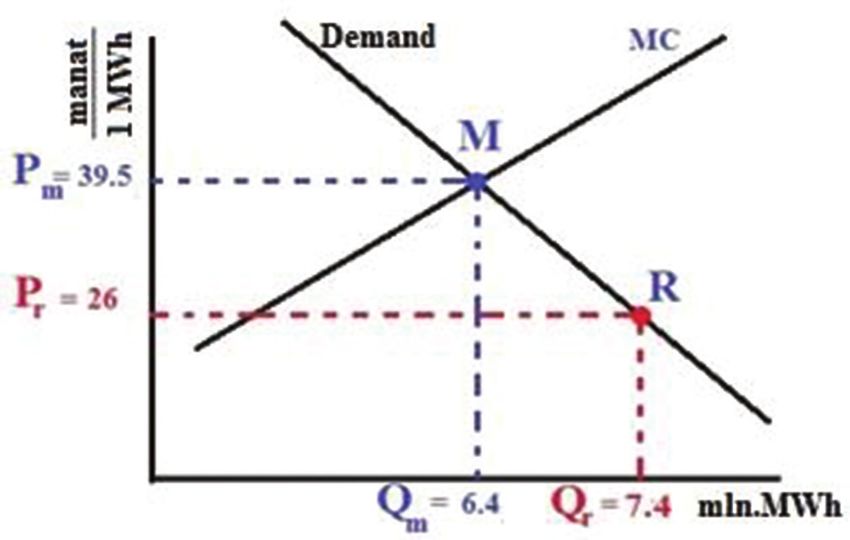
Gulaliyev, et al.: Consumer Surplus Changing in the Transition from State Natural Monopoly to the Competitive Market in the Electricity Sector in the Developing
                                                                    Countries: Azerbaijan Case

to calculate the electricity demand function for HHs and industry,                 especially for countries with economies in transition, where the
as well as the marginal cost of the main producers to estimate the                 electricity sector is state-owned, and the price of electricity is set
amount of change in the consumer surplus and producer surplus                      by the state bodies.
in the transition from a natural monopoly to the market.
                                                                                                         3. METHODOLOGY
Purpose of the investigation is to assess the level of possible
electricity price changes due to the transition from a natural state               Electricity Demand in HHs is generated by maximizing benefits
monopoly to a perfect market to mitigate the loss of consumer                      and minimizing costs. The amount of electricity used in HHs may
surplus.                                                                           depend on several determinants, including the cost of electricity,
                                                                                   total HH income, the number of HH members, and the size of
To achieve this goal, the following tasks were set: (1) assessment
                                                                                   living space and other determinants. Given these indicators, the
of electricity demand volume dynamics relationship with
                                                                                   electricity demand in HHs can be simplistically expressed as:
HHs’ income and expenditure for electricity; (2) determine the
structure of costs and revenues for the production of electricity
                                                                                                 ElecCons=F (Price,…I, HN, DS, G, PW)(1)
in Azerbaijan; (3) determination of the function of general and
average costs for the Azerbaijan Thermal Power Plant (ATPP) and
                                                                                   Here, the ElecCons is the amount of electricity consumed in HHs,
for the “Azerenerji” OJSC; (4) determining the demand function
                                                                                   Price is the price of electricity, Income is the income of the HH, HN
for HHs and industry; (5) determining the function of marginal cost
                                                                                   is the number of people in the HH, DS is the size of the living space
for some power plants; (6) determining the elasticity of electricity
                                                                                   in the HH, G is the energy products that can replace electricity, PW
demand at prices.
                                                                                   is the potential production capacity of power plants operating in
                                                                                   the country. We can take as “G” natural gas, thermal energy (for
ATPP and “Azerenerji” OJSC were taken as case study of the
                                                                                   the urban population) and wood energy (for the rural population).
research. Similar calculations can be made for other electricity
                                                                                   The key reason for incorporating PW into the empirical model
power plants of any countries.
                                                                                   that the EC depends on is that demand in the electricity market
                                                                                   depends to some extent on supply. If electricity is not produced or
The main hypothesis: (1) The price of electricity under a state
                                                                                   is not produced in the required volume, the volume of demand also
natural monopoly and in the absence of an electricity market is
                                                                                   changes. The list of such determinants in the economic literature
lower than in a perfect market; (2) As usual the state regulates
                                                                                   is different. For example, you can consider the size of the living
the price of electricity below the market price to reduce the social
                                                                                   space on which the HH is located, or the regional characteristics of
burden of HHs and to stimulate small and medium businesses;
                                                                                   the use of electricity as dummy indicators. The price of gas, which
(3) in the transition process from a natural state monopoly to the
                                                                                   can replace electricity, can also be included in the demand function.
perfect market there are expected an increasing of electricity prices
                                                                                   When using electricity, models are also proposed that take into
and decreasing of consumer surplus in short run.
                                                                                   account the age and education of HH members. When you include
                                                                                   another energy sources in the model, e.g.,natural gas, it is important
               2. LITERATURE REVIEW                                                to consider that it “replaces” electricity or “supplements” it.

An analysis of the theoretical and empirical literature on the                     In many developing countries, including in Azerbaijan, there are
electricity market confirms that most of these models are applicable               several distinctive features of the use of electricity in HHs, and
in liberal markets. For example, volatility models, such as Auto                   we must consider when studying:
Regressive Conditional Heteroscedasticity (ARCH), General                          1. The price of electricity does not depend on the regions within
ARCH, Multidimensional GARCH, are suitable for describing                               countries
volatility in the heteroscedasticity price structure. There were                   2. Electricity price is constant for any consumers, i.e., for HHs
studied some issues on autoregressive models (Misiorek et al.,                          and industry. Or electricity prices have two-three levels,
2006; Guthrie and Videbeck, 2002; Popova, 2004), as well as                             depending on the volume of use and are determined by the
transition switching and mode switching models (Cartea and                              state. For example, in Azerbaijan electricity prices have two
Figueroa, 2005), and volatility models (Serletis and Shahmoradi,                        levels: if a HH uses electricity up to 250 kWh/month, the
2006), the problems of electricity pricing in the monopolistic                          tariff will be 0.07 (manat1/1 kWh) and 0.11 (manat/1 kWh) if
market (Julian and Edward, 1983; Juan and Alejandro, 2010), etc.                        electricity consumption exceeds 250 kWh/month. Until 2016,
Studies such as determining the demand function for electricity                         electricity prices did not depend on the volume of use.
for HHs or for industry are often found in the economic literature                 Since HH incomes in Azerbaijan are very different, and income
(e.g., Madhu and Narasimha, 2009; Seung-Hoon et al., 2007;                         inequality in the country is quite large (Gulaliyev et al., 2018),
Naceur et al., 2018) and studies such as price forecasting (Rafał,                 it is more appropriate to calculate the electricity demand in
2014). In the economic literature, various models are proposed                     accordance with each income group. Since the difference in the
for determining the price of electricity in a market and natural                   elasticity of demand in price and income is noticeable in such
monopolies (e.g., Greer, 2011; Holmberg and Newbery, 2010). But                    a grouping.
the problems of consumer surplus losses in the transition process
from a natural state monopoly to a market have not been studied                    1     1 manat = 0.588 US dolar (according to exchange rate dates from January
much. But this problem is typical mainly for developing countries,                       2017 to October 2019).

 266                                                        International Journal of Energy Economics and Policy | Vol 10 • Issue 2 • 2020
Gulaliyev, et al.: Consumer Surplus Changing in the Transition from State Natural Monopoly to the Competitive Market in the Electricity Sector in the Developing
                                                                    Countries: Azerbaijan Case

The dependence of the electricity demand function in the country                   not a competitive market, but a natural state monopoly exists. In
on the average HH income, electricity prices, the share of                         such countries, including in Azerbaijan the price of electricity is
electricity costs in total costs, consumer price index, consumption                determined by the tariff council under the government. Given that
of substitute energy sources can be expressed as:                                  in a market where there is a state monopoly, and there is no supply
                                                                                   curve, we take the cost function as the main one. In the process of
ElecConst = a0 + a1 * Pricet + a2 * Incomet + a3 * EXPt + a4 *                    research, we will try to establish the cost function, as well as the
            CPIt + a5 * Gas & etct + εt                      (2)                  function of total costs in the production of electricity at major power
                                                                                   plants in the country. In determining this function, we will take into
In the initial approximation, we consider the dependence of                        account the costs of “Azerenerji” OJSC as a whole. Describing the
consumption on four indicators - the cost of electricity - Pricet,                 intersection of marginal costs and the demand function as a possible
HH income - Incomet, the share of electricity costs in total HH                    market price, we compare it with the price set by the Tariff Council
spending - EXPt, and the price index – CPIt. Although the cost                     in the country. Based on this comparison, we will try to determine
of electricity is stable for a long period, it can affect the volume               the changing of consumer surplus, as well as the changing producer
of demand as a result of changes in the consumer price index.                      surplus. During the calculations, we must accept some assumptions:
Therefore, it makes sense to look for dependence on this indicator.                • We will assume that there are no stable costs and all costs
The study of the dependence of HH demand for electricity on                             are variable. In this case, instead of average stable costs and
the price index in the country is important, since the price index                      average variable costs, only “average costs” will be calculated
changes affect the cost structure. As well as the price index can                  • When determining costs and average costs, we will prefer to
affect the share of electricity in total expenditures and ultimately                    build an approximate relationship based on actual costs for
changes the volume of consumption.                                                      certain years
                                                                                   • Since electricity prices in Azerbaijan are regulated by the state,
To determine the elasticity of HH electricity consumption by                            we will compare current prices with possible market prices
income, we consider the following assumptions:                                          when calculating consumer surplus and producer surplus
• Suppose that HHs can be divided into several income groups,                      • Possible market prices will be considered the point at which
    and average income and average consumption will be                                  the marginal cost and the demand are equal
    determined without taking into account differences between                     • We will assume that marginal costs and the marginal revenue
    incomes within each group                                                           function are linear
• Assume that for each year, the volume of electricity                             • Taking into account the fact that the main expenses during the
    consumption by all HH groups (GHH) consists of two terms:                           operation of thermal power plants after a certain limit are fuel
    (1) the amount provided for a living wage (LW); (2) the                             and other costs are relatively low, we describe the function of
    proportion of electricity is proportional to the expenditure                        total costs as quadratic increasing, i.e.,TC = a * Q2 + b * Q + c
    remaining after deducting the amount of LW for the given                       • The average cost function for the heat power plant will be
    year from HH expenses                                                               expressed as a hyperbolic decreasing function, that is, AC =
• Assume that GHH energy consumption is equal to the                                    TC/Q. Here Q is the volume of production.
    multiplication of the number of HHs included in this group
    by the average HH consumption in the group                                     Necessary dates to calculate the HH electricity demand function in
• Assume that the demand function for each HH income groups                        Azerbaijan, including the distribution of HH income and expenses
    is linear and will be described as P = c - d * Q                               from 2000 to 2017, the structure of income and expenditure per
• Assume that the coefficient “c” in the demand function for                       capita in the HHs for the month, the consumption of energy
    GHH is relevant to the price of electricity that is no longer                  products by HHs (in the natural forms) and other information
    available for GHH, and at this point consumption stops.                        were obtained from the official website of the State Statistical
    Assume that this price has relation with the remainder after                   Committee of the Republic of Azerbaijan (SSCRA, 2018).
    deducting the cost of living from the total HH income
• The coefficient “d” in the demand function is related to the                                                  4. RESULTS
    amount of electricity used in the country when it is free.
    Assume that this volume is also not infinite. Since the use                    4.1. The Function of the Volume of Electricity
    of electricity in both winter and summer is associated with                    Consumption by One HH
    certain electrical equipment, and the purchase of these devices                The result obtained from initial studies of regression ratios (2) over
    requires a certain amount of money, and its quantity is limited                the past 10 years between the average HH electricity consumption
    for each GHH. In the case when electric energy is free, its                    (ElecCons), electricity cost (Price), HH income (Income), and the
    consumption cannot exceed the production volumes that                          share of electricity costs in total costs (EXP), the consumer price
    relevant to the maximum power of the stations. Therefore, it                   index (CPI) and the volume of consumption of “substitute” energy
    is possible to accept the maximum consumption of GHH with                      products (Gas & etc) allows us to say that
    the lowest income as a share of GHH in production, which
    relevant to the maximum capacity of the stations.                              1. The average volume of electricity consumption by HHs in
                                                                                      Azerbaijan does not dependent on the cost of electricity and
It is impossible to determine the selling price of electricity by                     the consumer price index because of the fact that the electricity
the supply and demand curves in the countries where there is                          price is regulating by state

                  International Journal of Energy Economics and Policy | Vol 10 • Issue 2 • 2020                                                            267
Gulaliyev, et al.: Consumer Surplus Changing in the Transition from State Natural Monopoly to the Competitive Market in the Electricity Sector in the Developing
Countries: Azerbaijan Case
2. The average volume of electricity consumption by HHs Assessment show that an increase in total HH income increases
is more dependent on the volume of income and HH’s electricity consumption (Table 1). The volume of electricity
expenditure structure. consumption by a HH with a monthly per capita income up to
90 manat is at least 4 times less than HHs whose income exceeds
Assessment show that the function of the volume of electricity 200 manat. Nevertheless, the volume of consumption for each
consumption by one HH can be expressed by the model group decreases every year. There are two main reasons for this.
ElecCons = 1738.823 + 0.247901* Income + 69551.11* EXP The decreasing in electricity consumption in Azerbaijan with a
(702.2023) (0.026113) (7279.007) (3) stable income, as well as without changing the price of electricity,
is associated with an increase in the general price index. An
Here we did not take into account dependence on variable Gas &
increase in the price index in the overall economy increases
etc. This is because the positive dependence of ElecCons on Gas
GHH expenditures and reduces the share of electricity in total
& etc is largely due to the dependence of Gas & etc on Income.
expenditure. With rising prices for other goods and services, the
In other words, there is autocorrelation between Gas & etc and
share of electricity in total HH spending decreases. It was also
Income indicators. The negative dependence of ElecCons on Gas
affected by the increase in electricity prices according to a certain
& etc is relatively less than the positive relationship between Gas
scheme in 2016. The second reason is the increase in HHs’ use
& etc and Income. In order to prove the negative relationship
of other energy sources, especially heating systems and the use
between the ElecCons and Gas & etc indicators, it is necessary to
of natural gas.
study the effect of gas consumption on HH electricity consumption
in a certain income group, i.e., when income does not change.
As well as assessment show that electricity consumption by more
than 121000 HHs in 2010, 19000 HHs in 2011, 35000 HHs in
4.2. Electricity Demand Function for HH Groups
2013, 149000 HHs in 2014, 44000 HHs in 2015, 24000 HHs in
(GHH) in Azerbaijan
The strong dependence of the volume of electricity use in HHs 2016, and 29000 HHs in 2017 is below the level defined for HHs
on income (3) makes it possible to group the consumption of with MLW.
electricity by HH groups by income and to compile a demand
function for each group. HH incomes in Azerbaijan are grouped Comparison of the share of GHH with different incomes in
by different methods. electricity consumption shows that there is some correlation
between HH incomes and electricity consumption (Table 2). This
We can use the income division forms for HHs on quantile, decile dependence is largely connected with the fact that, possibility of
and other groups. We will use the SSCAR income distribution the purchasing of HH appliances, including refrigerators, washing
for the period 2010-2017. We take this distribution as the basis machines, dishwashers, air conditioners, and water heaters, etc.,
for comparing income with a living wage. In some cases, for increasing by HH incomes increasing. Even in multi-storey
simplicity, we will divide HHs with an income ofGulaliyev, et al.: Consumer Surplus Changing in the Transition from State Natural Monopoly to the Competitive Market in the Electricity Sector in the Developing
Countries: Azerbaijan Case
(electricity, gas and water) per capita in HHs showed an upward assume that, despite the fact that electricity prices are stable during
trend in the period 2001-2017. In 2013, these expenses were the the period 2010-2016, higher prices for other necessary goods led
highest over the past 17 years with a value of 7.7%. In subsequent to a decrease in electricity demand in HHs with revenues up to
years, this indicator decreased slightly (Figure 1). 200 manat. Accepting such a decline as rising electricity prices
with similar proportions, we can create a demand function for HHs
An interesting point regarding the consumption of electricity in with different incomes. That is, if the price of 1 kWh of electricity
GHH in Azerbaijan is that, firstly, with an increase in income, in 2010 was 0.06 manat, and HHs with a monthly income of 120-
the volume of consumption increases. Secondly, the number of 125 manat consumed 2510.1 kWh of electricity per year, then in
low-income GHH, i.e., which is smaller or has a slight difference case of stability of other prices and an increase in electricity prices
from MLW, is steadily declining, and the amount of high-income by 49, 5% of the consumption will be about 1316.7 kWh. Because
GHH is increasing. For example, in 2010, the number of HHs there is no other reason to reduce or increase consumer electricity
with a 200 manat monthly income or more amounted to 7.8% of costs. Based on these assumptions, the dependence of electricity
the total number of HHs, whereas in 2017 their number amounted expenses on the consumer price index (or adjusted price) for one
to 69.3%. This means that in 2017, this particular group was the HH included in GHH with different incomes can be established.
main consumer of electricity. In markets where prices are liberal,
the consumer volume of consumers with such weight plays an 4.3. The Structure of Costs and Revenues for
important role in determining prices. Thirdly, even in the HHs Electricity Production in Azerbaijan
included in this GHH, average electricity consumption tended Most of the electricity consumed in Azerbaijan (about 84%)
to decrease over the period 2010-2017. As mentioned above, the is produced by thermal power plants. Volume of electricity
main reason for this is the sharp increase in the consumer price generation by thermal power plants over the past 15 years has
index in those years. A certain increase in HH gas costs among changed from 16 to 21 million MWh. In recent years, production
utilities has also led to lower electricity costs. However, we accept has remained stable at around 20 million MWh. Among the thermal
the change in the consumer price index as the main reason and power plants in Azerbaijan and in the South Caucasus, the largest
Table 1: Electricity consumption by income for one household (kWh)
p.c. HH’s 2010 2011 2012 2013 2014 2015 2016 2017
income (manat)
70.1-75.0 1486.0 0.0 0.0 0.0 0.0 0.0 0.0 0.0
75.1-80.0 1588.4 0.0 0.0 0.0 0.0 0.0 0.0 0.0
80.1-85.0 1690.8 0.0 0.0 0.0 0.0 0.0 0.0 0.0
85.1-90.0 1793.2 0.0 0.0 0.0 0.0 0.0 0.0 0.0
90.1-95.0 1895.6 1639.7 0.0 1416.2 0.0 0.0 0.0 0.0
95.1-100.0 1998.0 1728.3 0.0 1492.7 0.0 0.0 0.0 0.0
100.1-105.0 2100.5 1816.8 1686.8 1569.2 1585.5 0.0 1427.3 0.0
105.1-110.0 2202.9 1905.4 1769.0 1645.7 1662.8 1710.3 1496.9 0.0
110.1-115.0 2305.3 1994.0 1851.3 1722.2 1740.1 1789.8 1566.5 0.0
115.1 -120.0 2407.7 2082.6 1933.5 1798.7 1817.4 1869.3 1636.1 1263.0
120.1-125.0 2510.1 2171.2 2015.8 1875.2 1894.7 1948.9 1705.7 1316.7
125.1-130.0 2612.5 2259.8 2098.0 1951.7 1972.0 2028.4 1775.3 1370.4
130.1-140.0 2766.1 2392.6 2221.4 2066.5 2087.9 2147.6 1879.6 1451.0
140.1-150.0 2970.9 2569.8 2385.8 2219.5 2242.5 2306.7 2018.8 1558.5
150.1-160.0 3175.8 2747.0 2550.3 2372.5 2397.2 2465.7 2158.0 1665.9
160.1-180.0 3483.0 3012.7 2797.1 2602.0 2629.1 2704.2 2366.8 1827.1
180.1-200.0 3892.6 3367.1 3126.0 2908.1 2938.3 3022.3 2645.1 2042.0
200.1 and more 4150.5 3986.3 3700.9 3442.9 3478.6 3578.1 3131.6 2417.5
250 and more - 6513.8 4523.3 4207.9 4251.6 4373.2 3827.5 2954.7
300 and more - - 9261.7 14444.4 14680.3 10333.2 7370.8 4184.6
Calculation of authors
Figure 1: Dynamics of electricity consumption (kWh) in GHH with different incomes
International Journal of Energy Economics and Policy | Vol 10 • Issue 2 • 2020 269Gulaliyev, et al.: Consumer Surplus Changing in the Transition from State Natural Monopoly to the Competitive Market in the Electricity Sector in the Developing
Countries: Azerbaijan Case
Table 2: Dynamics of electricity consumption by GHH with different incomes (million kWh)
p.c. HH’s 2010 2011 2012 2013 2014 2015 2016 2017
income (manat)
70.1-75.0 2.84 0.00 0.00 0.00 0.00 0.00 0.00 0.00
75.1-80.0 51.69 0.00 0.00 0.00 0.00 0.00 0.00 0.00
80.1-85.0 48.55 0.00 0.00 0.00 0.00 0.00 0.00 0.00
85.1-90.0 102.99 0.00 0.00 0.00 0.00 0.00 0.00 0.00
90.1-95.0 134.27 31.79 0.00 5.64 0.00 0.00 0.00 0.00
95.1-100.0 172.13 113.91 0.00 8.91 0.00 0.00 0.00 0.00
100.1-105.0 184.97 165.53 3.31 28.11 6.39 0.00 9.45 0.00
105.1-110.0 206.64 184.69 59.09 36.04 6.71 6.98 9.91 0.00
110.1-115.0 185.35 224.20 138.23 72.00 24.56 14.61 10.37 0.00
115.1-120.0 193.59 226.08 132.97 103.84 40.31 22.89 14.44 21.15
120.1-125.0 225.85 252.53 186.16 111.99 76.41 27.84 18.81 0.00
125.1-130.0 245.07 232.17 185.51 139.87 103.38 53.82 31.33 26.23
130.1-140.0 466.00 459.18 453.94 382.59 298.92 175.34 103.65 48.61
140.1-150.0 455.00 448.35 468.80 455.10 420.54 254.23 169.22 74.58
150.1-160.0 425.57 399.38 506.13 448.69 493.03 372.41 266.57 119.58
160.1-180.0 713.45 654.11 868.36 865.06 986.03 1015.59 725.68 441.53
180.1-200.0 529.09 489.54 657.23 683.13 870.94 980.82 875.21 620.49
200.1 and more 1412.24 772.75 1003.53 1165.15 1367.79 1847.68 1844.36 1694.79
250 and more 1262.19 497.72 510.99 668.70 955.08 1148.22 1237.19
300 and more 1340.02 1698.38 1928.29 2210.60 2844.31 2850.44
Calculation of authors
is the Azerbaijan Thermal Power Station (ATPS). Over the past Figure 2: Dynamics of retail prices (manat) for electricity (base year
5 years, the ATPS produced about 31-35% of the total electricity 2001)
production and has a total capacity of 2400 megawatts (MW).
During 2011-2018 sales of the produced electricity increased
from 122 million to 344 million manat. The increase in sales is
not sustainable, but the general trend indicates a certain increase.
As sales in 2011-2018 changed from $ 242 million (max. in 2014)
to $ 109 million (min. 2016). Fluctuations in sales over the years
are largely due to changes in production volumes and fluctuations
in the dollar-manat exchange rate. As the sales volume increased
by 180% in the period 2011-2018, when the volume of final
consumption changed by only 33% (i.e. increased from 13 million
MWh to 17.6 million MWh).
As the capacity of thermal power plants is used, their costs decrease
in accordance with the economies of scale. The main costs in Figure 3: Average costs of per 1 kWh of electricity generated by ATPS
ATPS’s cost structure are fuel costs. They make up more than 60%
of total costs. Another important part of the costs is depreciation
of equipment, maintenance and repair costs, and staff costs. For
2011-2017, these costs, together with fuel costs, accounted for
more than 90% of total costs. But in 2018, these costs decreased
to 75% of total costs. The prevalence of fuel costs in the main
costs of thermal power plants has a significant impact on the price
of electricity generated. As while fuel prices, especially oil and
gas, are changing in the global market, costs are also changing.
If the electricity market is a fully competitive market, changes in
fuel prices should immediately reflect on the cost of electricity.
However, the decline in oil prices from $ 71.8 in 2006 to $ 53.52 in
2007, an increase to $ 132.82 by 2008, and then a decrease to $ 41
in 2009, again growth until 2014 and a decrease to $ 31 by 2016
did not affect electricity prices in Azerbaijan. The main reasons compensated by the state, since revenues are formed on the basis
why such fluctuations in oil prices did not affect electricity prices of prices established by the Tariff Council.
in Azerbaijan are (1) electricity prices are determined by the state,
with compensation by the state for possible losses; (2) Azerbaijan The costs for ATPS personnel has not changed significantly over
has own oil and gas resources and price for internal market is the past 8 years. The absence of significant differences in wages
stable for short run. The losses of consumers and producers are indicates that there is no significant improvement in the social
270 International Journal of Energy Economics and Policy | Vol 10 • Issue 2 • 2020Table 3: Dynamics of nominal and real marginal revenue at the azerbaijan thermal power station (thousand manat/MWh)
Years Average nominal income Average real income Total nominal income- Total real income Total average Total Marginal Marginal real
from the sale of energy from the sale of energy (thousand manats) (thousand manats) nominal average real nominal income income
income income
2011 0.019 0.019 133074.0 133074.0 0.0212 0.021 - -
2012 0.018 0.017 145534.0 139267.0 0.0179 0.017 0.0068 0.0065
2013 0.018 0.018 142441.0 141591.5 0.0187 0.019 0.0063 0.0062
2014 0.025 0.027 193976.0 213160.4 0.0252 0.028 1.0217 1.1228
2015 0.032 0.050 240080.0 373374.8 0.0324 0.050 -0.1642 -0.2553
2016 0.027 0.028 186854.0 192831.8 0.0276 0.029 0.0831 0.0858
2017 0.042 0.026 345100.0 210042.6 0.0423 0.026 0.1133 0.0689
2018 0.037 0.022 296791.0 182304.1 0.0397 0.024 0.0697 0.0428
Average 0.027 0.026 210481.3 198205.8 0.028 0.027 0.162 0.154
Calculated by authors by using dates from Azerenerji (2018)
Countries: Azerbaijan Case
International Journal of Energy Economics and Policy | Vol 10 • Issue 2 • 2020
Table 4: Dynamics of nominal and real costs for ATPC
Years Volume of Share of production in Total nominal costs Total real costs Average Average real costs Marginal nominal Marginal real costs
production (thousand potential production (thousand man.) (Base year: 2011) nominal costs (man/kWh), (base costs (dman/dKW (d man/d kW),
kWh) (%) (thousand man.) (manat /kWh) year: 2011) hour) (base year: 2011)
2011 6289234 29.9 125849 125849 0.020 0.0200 - -
2012 8126446 38.7 152964 151300 0.019 0.0188 0.0148 0.0069
2013 7633202 36.3 156317 151031 0.020 0.0193 0.0068 0.0065
2014 7683640 36.6 198029 188599 0.026 0.0248 0.8270 1.0728
2015 7402814 35.3 240948 220648 0.033 0.0302 0.1528 -0.1793
2016 6762489 32.2 193804 157949 0.029 0.0236 0.0736 0.1020
2017 8159728 38.9 348978 251788 0.043 0.0310 0.1111 0.1570
2018 7466651 35.6 345809 243871 0.046 0.0324 0.0046 0.0988
average 7440526 35.4 220337.3 186379 0.0295 0.0250 0.170091 0.1807
Calculated by authors according to (TCRA, 2018; SSCRA, 2018; Azerenerji, 2018)
271
Gulaliyev, et al.: Consumer Surplus Changing in the Transition from State Natural Monopoly to the Competitive Market in the Electricity Sector in the DevelopingGulaliyev, et al.: Consumer Surplus Changing in the Transition from State Natural Monopoly to the Competitive Market in the Electricity Sector in the Developing
Countries: Azerbaijan Case
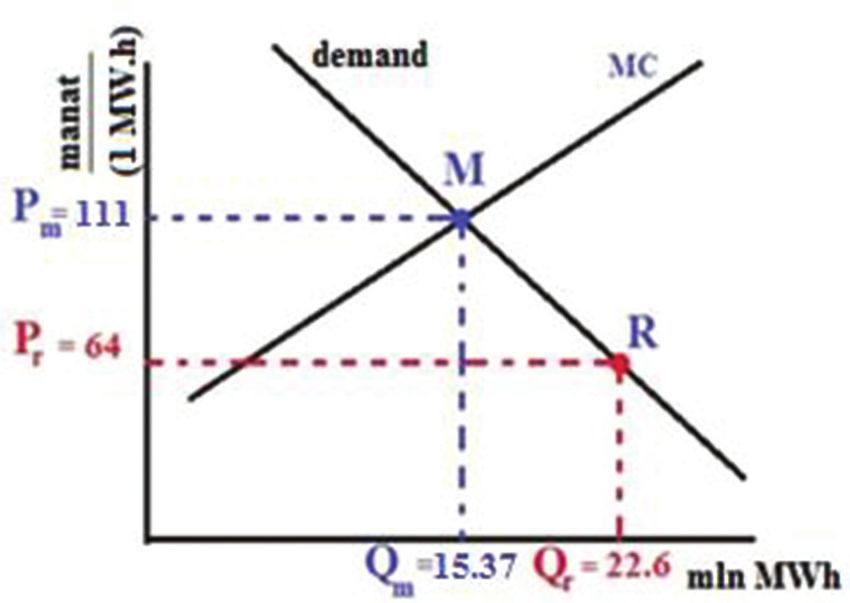
Figure 4: The modeling for selling prices and production volume of in 2018 increased 1.19 times, and costs increased 2.7 times. Sales
“Azerenerji” in conditions of state natural monopoly and competitive revenue for the same period increased 2.2 times. The cost of fuel
market for the production of 1 kWh at ATPS in 2011 was significantly
lower than in 2018. So, in 2011 fuel consumption decreased to
1.3 qepiks/1 kWh, and in 2018 - 2.9 qepiks. It should be noted
that prices for oil and natural gas in the domestic market in 2018
were slightly higher in manats than in 2011. The reason for the
significant difference in fuel consumption in ATPS for 2011-2018
is, most likely, the technical characteristics of the equipment.
4.4. General and Average Cost Function for Thermal
Power Plants Azerbaijan
If we take the maximum amount of electricity produced by ATPS
with a capacity of 2400 MW equal to 21 million MWh, then we
will see a fluctuation of the production share in potential production
between 30% and 40% in the period 2011-2018. Over the past
8-9 years, ATPS capacity has been used steadily in this interval
to ensure Azerbaijan’s electricity balance. This allows to generate
about 6-8 million MWh of electricity. Assuming that most of the
Figure 5: The modeling for comparison of wholesale selling prices costs are fuel costs, while other costs have not changed much, the
and production volumes at ATPS at the competitive market and state ATPS total cost function can be expressed by the formula (Geoffrey
natural monopoly and Tomas, 2003) TC = a * Q2 + b * Q + c, and the average cost
TC
function as AC = . When calculating costs, it would be more
Q
accurate to take costs in real prices based on a base year
(e.g., relative to 2011) (Figure 2), or costs calculated in US dollars.
Empirical calculations performed using the least square method
show that the ATPS total cost function for the period 2011-2018
can be expressed approximately in the form (4), (5) and (6),
respectively, in nominal prices, real prices and US dollars:
TC = 2.10−5 * Q2 −258.67 * Q + 9 * 108 (4)
TC = 4.10−6 * Q2 − 11.736 * Q + 7 * 107 (5)
status of workers of ATPS. The costs of raw materials, maintenance TC = 10−5 * Q2 – 100 * Q + 4 * 108 (6)
and repair, depreciation of fixed assets and other operating costs
varied in volume over the years. Such changes do not have a It should be noted that the figures for 2012 are not included in
serious relationship with production volumes. The assessment the calculations. In 2012, compared with 2011, with an increase
shows that the Pearson correlation coefficient between the volume in production by almost 2 million MW, the increase in costs
of production (thousand kWh) and the total nominal costs does amounted to only 25 million manat, in subsequent years, on the
not exceed r = 0.41. contrary, with a decrease in production, costs increased. This is
most likely due to the reconstruction and acquisition of fixed
Revenues from ATPS sales are significantly less than its total costs assets in 2012. Therefore, for simplicity, this year’s figure was
and, therefore, ATPS is a loss-making enterprise. Estimates over not taken into account. ATPS’s actual total costs for the period
the past 8 years show that sales revenue exceeded ATPS operating 2011-2018 differ from the estimated total costs in empirical
costs only in 2018. In 2011-2017, operating costs were higher models (4) and (6).
than sales revenue. Subject to other costs, ATPS total costs for
the period 2011-2018 exceeded total revenue. It should be noted We will use only model (5), since this model, calculated on the
that the average income at the station changes dramatically over basis of real prices, gives results close to actual costs. Using this
the years (Table 3). So, in 2011, 2012 and 2013, revenue from the model, the short-term function of marginal costs (MC) for ATPS
sale of 1 kWh determined to 1.9; 1.8 and 1.8 qepiks2, respectively, can be expressed as:
and in 2018 it settled to 3.6 qepiks. The increase in sales revenue
in 2018 is likely due to differentiation and, in fact, an increase in dTC
MC = = 8.10− 6 Q − 11.736 (7)
electricity prices. Compared to 2011, the volume of production dQ
2 1 qepiks = 0.01 manat= 0.0128 US dollar in 2011-2014 and 1 qepiks = 0.01 Where, Q is the volume of generated electric energy (MWh), MC
manat=0.00588 US dollar in 2016-2018. is calculated in manats. Calculations using formula (7) show that
272 International Journal of Energy Economics and Policy | Vol 10 • Issue 2 • 2020Gulaliyev, et al.: Consumer Surplus Changing in the Transition from State Natural Monopoly to the Competitive Market in the Electricity Sector in the Developing
Countries: Azerbaijan Case
ATPS’s short-term marginal costs for per 1 MWh of energy in If we accept 2017 y. (when real prices were minimum,
2011-2018 changed from 38.5 to 53.5 manat. Over this period, i.e., 23.3 manat/MWh) and 2006 y. (when prices were maximum,
the average short-term (i.e. annual) marginal costs amounted to i.e., 45 manat/MWh), as limit years for the variable (P) the price
47.8 manat. Based on real prices, marginal costs calculated in the functions, then 23.5 GWh and 20.8 GWh respectively, should be
long term, i.e., 2011-2018, amount to 100 manat for each MWh. taken as limits for variable of output to solve (equation 10). If we
This is close to the average marginal cost at that time. solve differential equation (10) in the form indicated above, then
we can get e = −0.2. Over the past 18 years, the elasticity of HHs’
We will use two points to build the marginal cost function for the electricity demand at prices has been around e = −0.2. Using this
long-term period, covering 2011-2018. The first point is the point value of elasticity, we can find the HHs electricity demand function
of marginal costs for the long-term period, covering 2011 and by solving differential equation (11).
2018, i.e., the point (7.5 million MWh; 100 manat), the second
point is the point of marginal costs of medium production and Q P
dx dy
average costs in relation to 2011, i.e., the point (74.4 million MWh;
52.58 manat). The function of long-term marginal costs built on
∫ x
= -0.2* ∫ y (11)
2.1*107 23.3
the basis of these empirical points is expressed as follows: The electricity demand function can be expressed as
MC = 1.8 × 10⁻³ × Q – 13340 (8)
9.55*1037 (12)
P=
The ATPS long-term marginal cost function (5) is very different Q5
from the short-term marginal cost function (8). The main reasons by solving differential equation (11). Here P is expressed in manat,
for this are related to sharp fluctuations of factors in the long run and Q is measured in MWh.
on which the components of operating costs depend.
∆Q
It should be noted that ATPS’s nominal marginal costs for 2011- Q
2018 also differ sharply from each other. Since, in some years, In the long run, we can find the elasticity by the formula .
∆P
these costs are very high. For example, marginal costs increased P
sharply as a result of a slight increase in production in 2014 and Calculations show that during 2011-2017, the elasticity of electricity
2017. In 2014, marginal costs increased to 827 manat/1 MWh. demand at prices is e = −0.8. The coefficient of elasticity for a long
Accordingly, production volumes in 2013 and 2014 were equal period is also too small. Despite the fact that the coefficient of elasticity
to 7.6 and 7.7 million MWh, and although the fuel consumption is a rather inert indicator, its change takes place in connection with a
required for production did not differ significantly over the years change in the structure of expenditures of the population. By the
(329-336 kg/MW) differences between the annual cost of fuel used changing of income, the share of electricity expenditure is changing.
were reflected in marginal costs. ATPS’s average costs (Figure 3) In the long run, HHs can reduce share of the electricity expenditure
for 2011-2018 exceeded average revenue (Table 4). or replace it with other types of energy source, e.g., gas.
Average marginal revenue is also lower than average marginal The nominal prices for electricity sales in Azerbaijan for the period
cost. Marginal revenue depends not only on production, but from 2001 to 2017 is changed 3 times and increased from 0.0184
also on prices. The marginal revenue function for ATPS can be to 0.07 manat. However, the real price was also the highest in
expressed as, 2016. In this case, the demand elasticity for electricity produced
QA0ES
by ATPS will be equal to e = −0.8* 0.315= −0.05. Here,
dTR d(P Q) dP Qtotal
MR = = =Q +P (9) QA0ES
dQ dQ dQ – this is ATPS’s share in the volume of electricity produced
Qtotal
as the supply function in a competitive market also depends on in Azerbaijan. It seems that the demand elasticity for electricity
prices. Here, P(Q) is the demand function. produced by ATPS is much less in the long run. The demand
∝ function can be found by solving the differential equation
The energy demand function for HHs can be expressed as = ,
Qβ Q dx P dy
and then α and β can be determined on the basis of total HH ∫6.3*106 x
= -0.05* ∫
60 y (13)
electricity consumption and real prices over the past 17 years.
Since ATPS is an integral part of the absolute monopoly electricity
using the ATPS elasticity value. Thus, the demand function for
supplier in Azerbaijan, short-term elasticity can be found based
ATPS can be expressed as
on the equation
5.8*10137
dQ P= (14)
Q 20
e= Q (10)
dP The average cost of electricity produced by “Azerenerji” OJSC
P has constantly increased in manat in the period of 2011-2018
International Journal of Energy Economics and Policy | Vol 10 • Issue 2 • 2020 273Gulaliyev, et al.: Consumer Surplus Changing in the Transition from State Natural Monopoly to the Competitive Market in the Electricity Sector in the Developing
Countries: Azerbaijan Case
(excluding 2016). The average cost in dollars also tends to increase change this percentage. In this case, it may be necessary to
before the devaluation of Azerbaijan currency in 2015. Although compensate additional expenditure of the HHs with small incomes.
there was a decline after 2 years of devaluation, then recovery
took place. In both cases, there is no pattern in the dependence of It is possible to calculate changes in consumer surplus and
average costs on the volume of production. Although the bulk of producer surplus as the trapezoid area (PmMRPr) for “Azerenerji”
“Azerenerji” OJSC costs is largely dependent on fuel consumption and ATPS in the Figures 4 and 5, respectively. For “Azerenerji” in
and cost, average costs are independent of production. 329.31 kg the transition from regulated prices (Pr) to market (Pm), consumer
of fuel was spent on the production of 1 MWh of electricity at surplus decreases in volume as
this station in 2012, while in 2009 fuel consumption increased
to 358.26 kg for 1 MWh. Probably, this was due to the upgrade (Pm − Pr) * (Qr + Qm)/2 = (111−64) * (22.6 + 15.37)*106/2 =
of technical equipment. Using the real marginal cost functions 892,3*109 (manat) (17)
(4) and (6) and the demand function (13) for “Azerenerji” OJSC,
we can determine the possible equilibrium values in which a And for ATPS in the transition process from regulated prices (Pr)
competitive market can function. In this case to market (Pm), consumer surplus decreases in volume as
Pm = 8.10−6 * Qm − 11.736 (Pm − Pr) * (Qr + Qm)/2 = (39.5−26) * (6.4 + 7.4) * 106/2 = 93.15
* 106 (manat) (18)
9.55*1037
Pm = 5
(15)
Qm Naturally, the bulk of consumption is not related to the HHs and
Solving system equation (15), we can obtain expected values has mainly commercial character. Therefore, there is a need to
for Pm = 111 manat and Qm = 15.37 million MWh. Where Pm -is compensate the losses of low-income HHs in case of the transition
expected market price and Qm -is expected quantity demanded in process from state natural monopoly to the competitive market to
market equilbirium. In other words, in the competitive market, reduce the social burden.
by increasing the cost of selling electricity to the HHs will be
increased price of electricity in compare with current regulated 5. CONCLUSIONS
prices and will be reduced amount of consumption.
So, by using the demand function and marginal cost function for
Similar calculations can be made for ATPS. In this case, Pm is electricity, we have established model to calculate the price changing
the wholesale selling price of the energy produced by ATPS in transition from natural state monopoly to the competitive market
to Azerenerji in the competitive market, and Qm is the ATPS and to calculate consumer surplus changing for the countries where
production volume in the competitive market. In this case, we electricity price is regulated by state. In case of Azerbaijan where
need to solve the system equation (16). electricity prices are regulated by state we have proved that current
electricity price is much lower than if it would be established in
the free market. Therefore, electricity power plants are absolute
Pm = 8.10−6 * Qm − 11.736 monopolists and are state enterprises, they incur losses that are
covered by the state budget to protect consumers. However, at the
5.8 * 10137 (16) same time, demand increases, and sometimes leads to unjustified
Pm = 20
Q m consumption and waste. In order to protect the interests of consumers,
By solving the system equation (16), one can obtain expected there is no need to keep the price of electricity below the market
values for Pm = 39.5 manat and Qm = 6.4 million MWh. In other and it is necessary to ensure a free electricity market in the country.
words, in a competitive market, the expected equilibrium values
for the electricity generated by ATPS will be slightly higher relative Calculations by offered model show that in the transition process
to current regulated values, and expected production volume will from monopoly pricing to market pricing, the price will be
be slightly lower. necessarily increased and the consumer surplus will be decreased.
Therefore, it is necessary to carry out the privatization of the
An approximate scheme of possible changes in prices under the electricity sector and at the same time to carry out a policy to
conditions of a state natural monopoly and a competitive market compensate the losses of low-income HHs from rising electricity
environment for “Azerenerji” and ATPS provides the basis for prices in order to acquire the minimum required amount of
asserting that currently regulated prices are much lower than free electricity for these HHs. The transition process from an absolute
market prices. So large production volumes lead to power plants’ state monopoly in the electricity sector to the market will increase
financial losses. As usual additional funds are allocated from the the quality of electricity supply, the volume of investments in this
state budget to improve social conditions and fully satisfy the sector, reduce excessive consumption, reduce the burden of the
electricity demand in the country. At present, raising prices to state budget aimed at covering the losses of producers.
the level of market equilibrium can create additional financial
difficulties for the general population. At present, a significant REFERENCES
part of HH expenses (about 6%) is accounted for electricity
consumption. Due to the lack of elasticity of electricity demand, Azerenerji. (2018), Reports of Azerenerji JSC. Available from: http://
rising prices to the level of market equilibrium can seriously www.azerenerji.gov.az/index/page/11/?lang=en. [Last accessed on
274 International Journal of Energy Economics and Policy | Vol 10 • Issue 2 • 2020Gulaliyev, et al.: Consumer Surplus Changing in the Transition from State Natural Monopoly to the Competitive Market in the Electricity Sector in the Developing
Countries: Azerbaijan Case
2019 Apr 15]. Studies in Nonlinear Dynamics and Econometrics, 10(3), 1-36.
Brue, S.L., Grant, R.R. (2007), The History of Economic Thought. Mason, Naceur, K., Muhammad, S., Hrushikesh, M., Nanthakumar, L. (2018),
OH: Thomson Southwestern. Estimation of electricity demand function for Algeria: Revisit of
Cartea, A., Figueroa, M.G. (2005), Pricing in electricity markets: A time series analysis. Renewable and Sustainable Energy Reviews,
mean reverting jump diffusion model with seasonality. Applied 82(3), 4221-4234.
Mathematical Finance, 12(4), 313-335. Popova, J. (2004), Spatial Pattern in Modeling Electricity Prices: Evidence
Geoffrey, R., Tomas, G. (2003), Electricity Economics: Regulation and from the PJM Market. West Virginia University Working Paper.
Deregulation. Hoboken: John Wiley and Sons Publication. Rafał, W. (2014), Electricity price forecasting: A review of the state-of-the-
Greer, M. (2011), Electricity cost modeling calculations electricity cost art with a look into the future. International Journal of Forecasting,
modeling calculations. Amsterdam, Boston: Elsevier. p313. 30(4), 1030-1081.
Gulaliyev, M., Aga, A., Azizov, A., Kazimov, F., Mir-Babayev, R. Serletis, A., Shahmoradi, A., (2006), Measuring and testing natural gas and
(2018), Assessing the degree of inequality in the distribution of electricity markets volatility: Evidence from Alberta’s deregulated
national income and its macroeconomic consequences in Azerbaijan. markets. Studies in Nonlinear Dynamics and Econometrics,
Espacious, 7(17), 85-108. 10(3), 1-20.
Guthrie, G., Videbeck, S. (2002), High Frequency Electricity Spot Price Seung-Hoon, Y., Joo, S.L., Seung-Jun, K. (2007), Estimation of residential
Dynamics: An Intra-Day Markets Approach. Available from: . Last accessed on 2019 May 11]. selection bias. Energy Policy, 35(11), 5702-5707.
Holmberg, P., Newbery, D.M. (2010), The supply function equilibrium Shi, G., Zheng, X., Song, F. (2012), Estimating elasticity for residential
and its policy implications for wholesale electricity auctions. Utilities electricity demand in China. The Scientific World Journal, 2012,
Policy, 18, 209-222. 395629.
Juan, F.E., Alejandro, J. (2010), Monopolistic competition in electricity SRM. (2016), Strategic Road Map on Development of Utilities (Electricity
networks with resistance losses. Economic Theory, 44, 101-121. and Thermal Energy, Water and Gas) in the Republic of Azerbaijan.
Julian, L.S., Edward, M.R. (1983), The theory of price-changing and Available from: https://www.president.az/articles/22368. [Last
monopoly power. Journal of Post Keynesian Economics, 6(2), accessed on 2019 Apr 25].
198-213. SSCRA. (2018), State Statistical Committee of Republic of Azerbaijan.
Madhu, K., Narasimha, D.R. (2009), Supply and demand of electricity in Available from: https://www.stat.gov.az/menu/4/e-reports. [Last
the developing world. The Annual Review of Resource Economics, accessed on 2019 May 10].
1, 567-596. TCRA. (2018), Tariff (Price) Council of the Azerbaijan Republic.
Misiorek, A., Trueck, S., Weron, R. (2006), Point and interval forecasting Available from: http://www.tariffcouncil.gov.az/?/en/resolution/
of spot electricity prices: Linear vs. Non-linear time series models. archive. [Last accessed on 2019 May 27].
International Journal of Energy Economics and Policy | Vol 10 • Issue 2 • 2020 275You can also read