Comparison of Efficiency and Cost of Methods for Conditioning of Slurries of Steam-Pretreated Softwood
←
→
Page content transcription
If your browser does not render page correctly, please read the page content below
ORIGINAL RESEARCH
                                                                                                                                    published: 09 August 2021
                                                                                                                              doi: 10.3389/fenrg.2021.701980

                                           Comparison of Efficiency and Cost of
                                           Methods for Conditioning of Slurries of
                                           Steam-Pretreated Softwood
                                           Dimitrios Ilanidis 1, Stefan Stagge 1, Björn Alriksson 2, Adnan Cavka 3 and Leif J. Jönsson 1*
                                           1
                                             Department of Chemistry, Umeå University, Umeå, Sweden, 2RISE Processum AB, Örnsköldsvik, Sweden, 3SEKAB
                                           E-Technology AB, Örnsköldsvik, Sweden

                                           Inhibitors formed during pretreatment impair lignocellulose bioconversion by making
                                           enzymatic saccharification and microbial fermentation less efficient, but conditioning of
                                           slurries and hydrolysates can improve fermentability and sometimes also enzymatic
                                           digestibility. Conditioning of pretreated softwood using four industrial reducing agents
                                           (sodium sulfite, sodium dithionite, sodium borohydride, and hydrogen) was compared with
                                           standard methods, such as overliming and treatment with activated charcoal. A dosage of
                                           approx. 1 mM sulfur oxyanion (sulfite or dithionite) per percent water-insoluble solids (WIS)
                                           in the slurry was found to result in good fermentability. Treatment of 10–20% WIS slurries
                                           with 15 mM sulfur oxyanion under mild reaction conditions (23°C, pH 5.5) resulted in
                                           sulfonation of the solid phase and saccharification improvements of 18–24% for dithionite
                           Edited by:      and 13–16% for sulfite. Among the different conditioning methods studied, treatment of
                        Richa Kothari,
   Central University of Jammu, India
                                           slurries with sodium sulfite was superior with respect to cost-efficient improvement of
                       Reviewed by:
                                           fermentability. Treatments of slurry or pretreatment liquid with 15 mM sulfite or dithionite
               Sivakumar Nallusamy,        resulted in 58–76% reduction of the content of formaldehyde. The comparison indicates
     Sultan Qaboos University, Oman
                                           that conditioning of pretreated biomass using sulfur oxyanions warrants further attention.
                         Zhaoxian Xu,
    Nanjing University of Science and      Keywords: lignocellulose bioconversion, enzymatic saccharification, hybrid hydrolysis and fermentation,
                  Technology, China        conditioning, detoxification, inhibitor, sodium sulfite, sodium dithionite
                  *Correspondence:
                         Leif J. Jönsson
                  leif.jonsson@umu.se      INTRODUCTION

                    Specialty section:     Lignocellulosic biomass is an abundant renewable resource for production of advanced biofuels,
         This article was submitted to     green chemicals, and bio-based materials (Ragauskas et al., 2006; Galbe and Wallberg, 2019). The
              Bioenergy and Biofuels,      main organic constituents are cellulose, hemicelluloses, and lignin. Biochemical conversion of
               a section of the journal    lignocellulose using hydrothermal pretreatment, enzymatic saccharification, microbial fermentation
         Frontiers in Energy Research      of sugars, and valorization of hydrolysis lignin is one of the most common approaches studied. As
           Received: 28 April 2021         sugars are prominent intermediates, this is sometimes referred to as a sugar-platform process.
           Accepted: 29 July 2021              Hydrothermal pretreatment under acidic conditions primarily targets hemicelluloses and the
         Published: 09 August 2021
                                           main goal of the pretreatment is to disrupt the physical structure, decrease the particle size, and
                             Citation:     increase the susceptibility of the cellulose to enzymatic saccharification. Hydrothermal pretreatment
    Ilanidis D, Stagge S, Alriksson B,     is sometimes performed as steam explosion and sometimes acid catalysts are added to promote
     Cavka A and Jönsson LJ (2021)
                                           hydrolysis of hemicellulose (Gandla et al., 2018). Regardless of whether acid is added, the
Comparison of Efficiency and Cost of
Methods for Conditioning of Slurries of
                                           pretreatment will be acidic, as carboxylic acids are formed when hemicelluloses are degraded.
         Steam-Pretreated Softwood.        Depending on the recalcitrance of the feedstock, the conditions that are utilized for pretreatment may
        Front. Energy Res. 9:701980.       be more or less severe. Typical conditions include temperatures of around 200°C and residence times
    doi: 10.3389/fenrg.2021.701980         of a few minutes (Gandla et al., 2018). Softwood, a common type of lignocellulosic biomass in boreal

Frontiers in Energy Research | www.frontiersin.org                             1                                       August 2021 | Volume 9 | Article 701980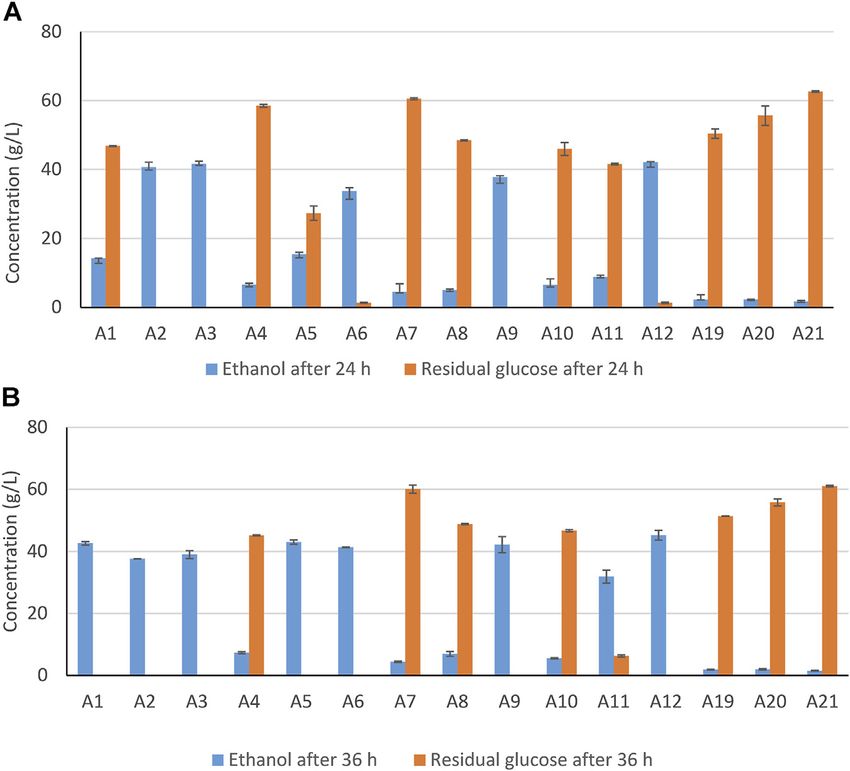
Ilanidis et al.                                                                                                Comparison of Conditioning Methods

and temperate forests, contains a relatively high fraction of lignin       suggest that using sodium sulfite for biochemical conversion of
and is comparatively recalcitrant (Galbe and Wallberg, 2019).              softwood is advantageous (Cavka et al., 2015a).
    Enzymatic and microbial processes can be combined or                      Studies of conditioning with reducing agents have so far
separated. Common approaches include separate hydrolysis                   mainly addressed treatments of hydrolysates, as in an SHF
and fermentation (SHF) and simultaneous saccharification and                approach. Therefore, it is important to address SSF and HHF
fermentation (SSF) (Öhgren et al., 2007). More recently, hybrid            scenarios by treatment of slurries and investigate if treatment of
hydrolysis and fermentation (HHF) has emerged as a common                  slurries and hydrolysates are different. Another important issue
approach (Zhong et al., 2019). In HHF, enzymes are first added at           regards the WIS content, which is related to the inhibitor
temperatures of around 50°C, and, after a while, the temperature           concentrations. Using highly concentrated systems to get
is lowered to 30°C, the microorganism is added, and enzymes and            higher sugar and ethanol concentrations is expected to also
microorganism then act in concert. In SHF, the residual solids can         affect inhibitor concentrations and required dosages of
be removed before the fermentation step, but in SSF and HHF                chemicals. Another issue concerns comparison of industrial
there will be both a liquid and a solid phase during the                   reducing agents. Sodium sulfite, sodium dithionite, and
fermentation. The efficiency of enzymatic saccharification is                sodium borohydride (Alriksson et al., 2011; Cavka and
strongly affected by the consistency, which is sometimes                   Jönsson, 2013) need to be compared, and hydrogenation,
determined as the content of WIS, water-insoluble solids.                  which is an industrially important approach, is also a
When WIS content or dry-matter content increases, enzymatic                possibility to consider.
saccharification becomes increasingly challenging (Hoyer et al.,               In this study we addressed that lack of knowledge using
2009; Kristensen et al., 2009; Koppram et al., 2014).                      pretreated sawdust from softwood, more specifically Norway
    Under severe acidic pretreatment conditions, hemicelluloses            spruce (Picea abies). The first investigation covered how the
are degraded to monosaccharide sugars, but there will also be              content of WIS in the range 10–20% (w/v) was correlated to
formation of by-products (Rasmussen et al., 2014; Jönsson and              sodium sulfite and sodium dithionite loadings in an HHF process.
Martín, 2016). If concentrations are sufficiently high, these by-           Second, an investigation was made how sulfur oxyanions affected
products may inhibit enzymes used for saccharification and                  the solid phase and the enzymatic saccharification. Third, a
microbes used for the fermentation process. Monosaccharides                comparison was made using different conditioning methods,
and phenols are important inhibitors of cellulolytic enzymes               including sodium sulfite, sodium dithionite, sodium
(Ximenes et al., 2010; Zhai et al., 2016). Aliphatic carboxylic            borohydride, alkali treatment, activated charcoal, and
acids (such as acetic acid, formic acid, and levulinic acid),              hydrogen, and including both experiments with slurries and
aliphatic aldehydes (such as formaldehyde), benzoquinones                  pretreatment liquids. Fourth, a comparison was made between
(such as p-benzoquinone), furans [such as furfural and 5-                  different reducing agents on basis of efficiency and cost. Fifth, the
hydroxymethylfurfural (HMF)], and phenylic substances                      impact of the different conditioning methods on
(i.e., phenolic and non-phenolic aromatics) are important                  monosaccharides and inhibitors in slurry and hydrolysate was
inhibitors of fermenting microorganisms (Jönsson and Martín,               investigated. Investigations in this area help to elucidate
2016).                                                                     fundamental aspects of efficient bioconversion processes, and
    There are many approaches to reduce problems with                      provide guidance for the development of competitive industrial
inhibition (Jönsson et al., 2013). One of the most commonly                processes.
used is conditioning, which includes measures such as adjustment
of pH, addition of essential nutrients for microorganisms,
dilution, and various treatments removing or inactivating                  MATERIALS AND METHODS
inhibitors.      Conditioning      targeting      inhibitors      of
microorganisms is often referred to as detoxification. There                Pretreatment of Raw Material
are several comparative studies of different conditioning                  The severity factor (SF) (Eq. 1) of the pretreatments was
methods (Larsson et al., 1999a; Cantarella et al., 2004; Guo               determined as the logarithm of the reaction ordinate developed
et al., 2013; Fernandes-Klajn et al., 2018), among which                   by Overend and Chornet (1987) (Eq. 2), and the combined severity
treatment with calcium hydroxide (overliming) and treatment                factor (CSF) of the acid-catalyzed pretreatments was calculated as
with activated charcoal (Parajó et al., 1997; Guo et al., 2013;            outlined by Chum et al. (1990) (Eq. 3):
Fernandes-Klajn et al., 2018) are some of the more common.                                        SF  Log Ro                                  (1)
More recently, conditioning using reducing agents has emerged                                                    Tr − 100
as one of the most promising approaches (Alriksson et al., 2011).                                 Ro  t x exp                               (2)
                                                                                                                  14.75
Treatment with reducing agents is advantageous as it is
                                                                                                 CSF  Log (Ro) − pH                           (3)
compatible with conditions suitable for enzymes and microbes
and does not require a separate process step, relatively low               where t is the residence time of pretreatment in minutes, and Tr is
concentrations of industrial chemicals can be used, and certain            the pretreatment temperature in °C.
reducing agents, such as the sulfur oxyanions sulfite and                      The pretreatment of sawdust from Norway spruce was
dithionite, have positive effects on both cellulolytic enzymes             performed by SEKAB E-Technology in the Biorefinery
and fermenting microorganisms (Alriksson et al., 2011; Cavka               Demonstration Plant (BDP), Örnsköldsvik, Sweden. The
et al., 2011; Cavka and Jönsson, 2013). Techno-economic studies            demonstration unit has a pre-treatment capacity of approx. 2

Frontiers in Energy Research | www.frontiersin.org                     2                                    August 2021 | Volume 9 | Article 701980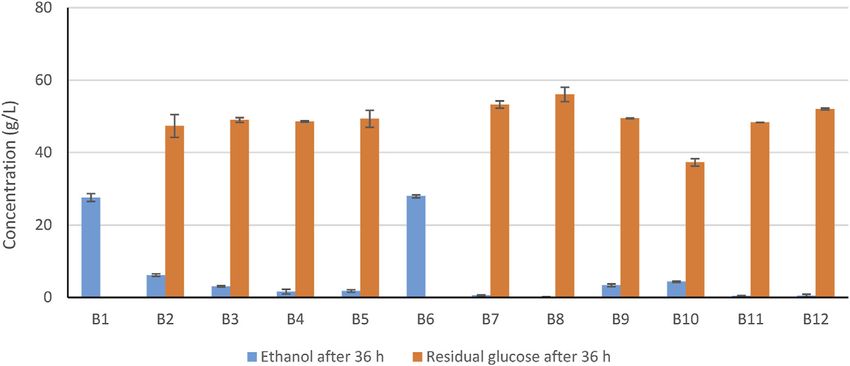
Ilanidis et al.                                                                                                                   Comparison of Conditioning Methods

TABLE 1 | Experimental conditions for Series A with varying concentrations of       TABLE 2 | Experimental conditions for Series B in which six conditioning methods
sodium dithionite and sodium sulfite and different content of WIS of                 for pretreatment slurry (15% WIS) were compared and experimental
pretreatment slurry.                                                                conditions for Series C including treatments of pretreatment slurry (PS) and
                                                                                    pretreatment liquid (PL) with and without addition of sodium dithionite, sodium
Combination          WIS (% w/v)           Na2SO3 (mM)          Na2S2O4 (mM)        sulfite, sodium borohydride, calcium hydroxide, activated charcoal, and
                                                                                    hydrogenation.
A1                         10                    7.5                  —
A2                         10                   12.5                  —             Combination               Treatment           Combination           Treatment
A3                         10                   17.5                  —
A4                         15                    7.5                  —             B1                        15 mM Na2SO3           C1PS            15 mM Na2SO3
A5                         15                   12.5                  —             B2                        15 mM Na2S2O4          C2PL            15 mM Na2SO3
A6                         15                   17.5                  —             B3                        11 mM Na2S2O4          C3PS            15 mM Na2S2O4
A7                         20                    7.5                  —             B4                        3.8 mM Na2S2O4         C4PS            11 mM Na2S2O4
A8                         20                   12.5                  —             B5                        15 mM NaBH4            C5PS            3.8 mM Na2S2O4
A9                         20                   17.5                  —             B6                        53 mM NaBH4            C6PL            15 mM Na2S2O4
A10                        10                    —                    5.0           B7                        1.7 mM NaBH4           C7PS            15 mM NaBH4
A11                        10                    —                    8.7           B8                        Ca(OH)2                C8PS            53 mM NaBH4
A12                        10                    —                   12.5           B9                        2.5% (w/v) ACa         C9PS            1.7 mM NaBH4
A13                        15                    —                    5.0           B10                       0.25% (w/v) AC         C10PL           15 mM NaBH4
A14                        15                    —                    8.7           B11                       Hydrogenation          C11PS           Ca(OH)2
A15                        15                    —                   12.5           B12                       —                      C12PS           0.25% (w/v) AC
A16                        20                    —                    5.0                                                            C13PS           2.5% (w/v) AC
A17                        20                    —                    8.7                                                            C14PS           Hydrogenation
A18                        20                    —                   12.5                                                            C15PL           Hydrogenation
A19                        10                    —                    —                                                              C16PS           —
A20                        15                    —                    —             a
                                                                                        Activated charcoal.
A21                        20                    —                    —

ton of feedstock per day and is equipped with a continuous steam                    [containing 150 g/L yeast extract, 75 g/L (NH4)2HPO4, 3.75 g/L
explosion pre-treatment reactor. The sawdust was impregnated                        MgSO4·7H2O, and 238.2 g/L NaH2PO4·H2O] and 1 mL yeast
with sulfur dioxide (approx. 0.5% w/w) prior to pretreatment and                    suspension was added to 48 mL of the enzymatically
the subsequent pre-treatment was performed at a temperature,                        hydrolyzed slurry resulting in a total culture volume of 50 mL.
residence time and pH that resulted in a CSF of approx. 2.3                         The yeast was the industrial S. cerevisiae strain ethanol red
(temperature, 195°C; residence time, 9 min). The pretreated                         (Fermentis, Marcq en Baroeul, France) and the initial yeast
biomass was stored at 4°C until further use. The water-                             biomass concentration in each culture was 2 g/L. The flasks
insoluble solids (WIS) was determined. The slurry was                               were sealed with parafilm (Pachiney Plastic Packaging
separated by vacuum filtration and then the solid phase was                          Company, Chicago, IL, United States) and aluminum foil to
washed with approx. 1 L of deionized water and the dry-matter                       prevent evaporation of ethanol during the process. The
content was measured by using an HG63 moisture analyzer                             reaction mixture was then incubated for 60 h at 35°C and
(Mettler-Toledo, Greifensee, Switzerland). The WIS content of                       170 rpm. Samples for analysis of glucose and ethanol were
the slurry was around 16.5% (w/v) and the pH was around 1.5.                        withdrawn after 0, 12, 24, 36, 48, and 60 h.

Conditioning of Slurry                                                              Experimental Design
Prior to conditioning, the WIS content of the pretreated slurry                     Three series of experiments were performed. In the first series
was adjusted to 10, 15, and 20% (w/v) (see Experimental                             (A), the concentrations of sodium dithionite and sodium sulfite
Design). The pH was adjusted to 5.5 using a 10 M aqueous                            and the WIS content were varied (Table 1). The concentration
solution of sodium hydroxide. Then the slurries were                                ranges were selected on basis of previous experiments (Alriksson
conditioned for 10 min at 23°C under magnetic mixing,                               et al., 2011; Cavka et al., 2015b).
using different methods as described in Section                                         The second experimental series (B) included six conditioning
Experimental Design.                                                                methods (Table 2). The WIS content was 15% (w/v). The sodium
                                                                                    sulfite loading was determined on basis of the results from Series
Saccharification and Fermentation                                                    A. Loadings of sodium dithionite and sodium borohydride were
Hybrid hydrolysis and fermentation (HHF) experiments were                           decided based on molar masses, on weight, and on cost
performed using 250-ml Erlenmeyer flasks. Triplicates of each                        estimations. Treatment with calcium hydroxide (overliming)
reaction mixture were included. After conditioning, the pH was, if                  was performed by adjusting the pH of the slurry to 10.0 by
needed, adjusted to 5.5. Enzymatic saccharification was initiated                    adding calcium hydroxide. The reaction time was 1 h at 23°C with
by addition of Cellic CTec2, procured from Sigma-Aldrich, at a                      stirring. After that the pH was adjusted to 5.5 using a 10 M
dosage corresponding to 0.1 g enzyme preparation per gram of                        aqueous solution of sodium hydroxide. Treatment with activated
WIS. The flasks were incubated for 36 h at 50°C and 140 rpm in                       charcoal (Norsk Turbokol, carbon size 0.4–0.8 mm) was
an orbital shaker (Kühner Lab-Therm LT-X, Adolf Kühner AG,                          performed by mixing different charges (1.25 g or 0.125 g
Birsfelden, Switzerland). After 36 h, 1 mL nutrient solution                        activated charcoal per 50 ml slurry) of activated charcoal

Frontiers in Energy Research | www.frontiersin.org                              3                                              August 2021 | Volume 9 | Article 701980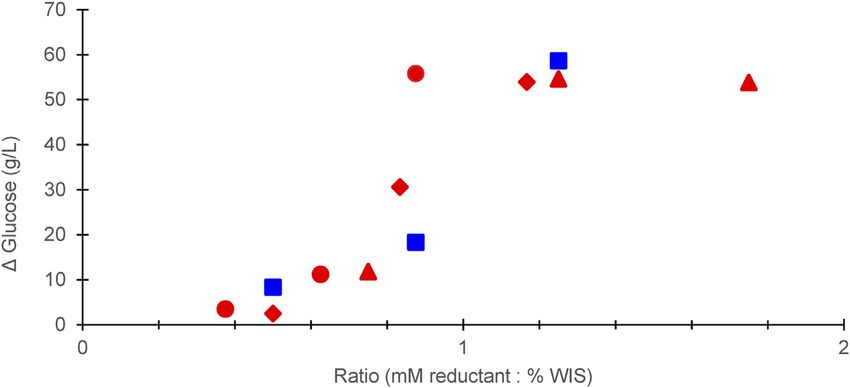
Ilanidis et al.                                                                                             Comparison of Conditioning Methods

powder with the slurry (Table 2). Hydrogenation was performed           Determination of Sulfur Content
by RISE Processum (Örnsköldsvik, Sweden) using a Hastelloy              Untreated slurry and slurry treated with sodium dithionite or
reactor from Büchi with a volume of 450 mL. Prior to                    sodium sulfite was analyzed with respect to the sulfur content.
hydrogenation, the pH of slurry was adjusted to 5.5 using a             After washing the solids with cold deionized water, the dried solid
10 M aqueous solution of sodium hydroxide. The reaction                 fractions were analyzed by RISE Research Institutes of Sweden
mixture contained slurry (B11 and C14) or filtrated liquid               AB (Borås, Sweden) using method SS-EN ISO 16994:2016 (Solid
phase (C15). In each case, 300 g of material was weighed                biofuels—Determination of total content of sulfur and chlorine).
directly into the reactor. The catalyst, 3 g of 5% palladium on
activated carbon paste type 395 (Johnson Matthey Plc,
Hertfordshire, United Kingdom), was then added. The reactor             Determination of Sugars and Microbial
was assembled and the stirring (1,000 rpm) was started.                 Inhibitors in the Liquids
Hydrogen gas was added through the lid (from the top of the             The concentrations of HMF and furfural were determined using
reactor without bubbling) to a pressure of 5.5 bar. The hydrogen        an Agilent 1,200 series HPLC system with diode-array detector
gas line was held open during the reaction time to maintain the         and a 3 × 50 mm, 1.8 μm Zorbax RRHT SB-C 18 column. The
hydrogen gas pressure. The reaction time was 1 h. The pressure          temperature was set to 40°C. Isocratic elution was performed
was decreased and the reactor was opened. The hydrotreated              using an aqueous solution of 0.1% formic acid and 0.1%
slurry was then used in the HHF experiments.                            acetonitrile at a flow rate of 0.5 mL/min.
   The third experimental series (C) consisted of treatments with          High-performance        anion-exchange        chromatography
sodium sulfite, sodium dithionite, sodium borohydride, alkali            (HPAEC) with pulsed amperometric detection (PAD) was
using calcium hydroxide, and hydrogenation of spruce                    used to analyze monosaccharides. Prior to analysis all samples
pretreatment slurry (PS) and spruce pretreatment liquid (PL)            were diluted with ultra-pure water and filtered through 0.2 μm
(Table 2). The goal with the third experimental series was to           nylon membranes (Millipore). The separation system consisted of
compare the methods with regard to reactions with the solid and         a separation column (4 × 250 mm), a guard column (4 × 50 mm)
liquid phases.                                                          (both CarboPac PA1, Dionex), and an ICS-5000 system (Dionex,
                                                                        Sunnyvale, CA, United States). Elution was performed with ultra-
Analysis of Glucose and Ethanol                                         pure water at a flow rate of 1 mL/min for 25 min. To amplify
Glucose and ethanol concentrations were determined using an             signal strength, post-column addition was made using a flow rate
HPLC instrument consisting of an Agilent (Santa Clara, CA,              of 0.5 mL/min with a 300 mM aqueous solution of NaOH.
United States) 1260 Infinity system equipped with refractive             Column regeneration was made during 11 min with a mixture
index and diode array detectors, an autoinjector, and a                 consisting of 60% of the 300 mM NaOH solution and 40% of a
column oven. The column was a Bio-Rad Aminex HPX-87H                    200 mM NaOH solution with 170 mM sodium acetate.
column (300 mm × 7.8 mm) equipped with a Bio-Rad 125-0131               Equilibration was made with ultra-pure water for 3 min. PAD
Standard Cartridge Holder guard column (30 mm × 4.6 mm).                was performed using a gold electrode with Gold Standard PAD
The temperature of the column oven was set to 80°C and the              waveform and Ag/AgCl as reference electrode.
temperature of the detector was set to 55°C. The injection volume          Determination of aliphatic carboxylic acids (formic acid, acetic
was 10 µL and the flow rate was 0.6 mL/min. The vials that were          acid, and levulinic acid) was performed by MoRe Research
used were 1.5 ml PP short Thread vials (32 × 11.6 mm)                   (Örnsköldsvik, Sweden). The method used was HPAEC with a
(Skandinaviska Genetec AB). The volume of the sample was                Dionex Ultimate 3000 system.
1.5 mL. The eluent consisted of a 0.005 M aqueous solution of              After derivatization with 2,4-dinitrophenylhydrazine
H2SO4. The software was OpenLAB CDS Chem Station edition                (DNPH), ultra-high performance liquid chromatography-
for LC and LC/MS Systems Rev.C.01.07(27).                               electrospray ionization-triple quadrupole-mass spectrometry
                                                                        (UHPLC-ESI-QqQ-MS) was used for determination of
Analytical Enzymatic Saccharification                                    formaldehyde, p-benzoquinone, vanillin, coniferyl aldehyde,
Analytical enzymatic saccharification (Gandla et al., 2018) was          syringaldehyde, 4-hydroxybenzaldehyde, and acetovanillone.
used for evaluating the susceptibility of pretreated solids             An Agilent 1290 Infinity system coupled to a 6490 triple-
to enzymatic digestion. Prior to analytical enzymatic                   quadrupole mass spectrometer (QqQ-MS) was used with a
saccharification, slurries with 10, 15, and 20% (w/v) WIS                2.1 mm × 150 mm XTerra MS C18 column (Waters, Milford,
were treated with 15 mM sodium sulfite or 15 mM sodium                   MA, United States). The MS parameters were set as follows: gas
dithionite. Then, 50 mg (dry weight) of solid fraction washed           temperature 290°C, gas flow 20 L/min, nebulizer 30 psi, sheath gas
with deionized water was suspended in 900 μL sodium citrate             temperature 400°C, sheath gas flow 12 L/min, capillary voltage
buffer (pH 5.2) and 50 μL of Cellic CTec2. Triplicates of each          −3,000 V, and nozzle voltage −2,000 V. Eluents consisted of 1) a
reaction mixture were prepared. The reaction mixtures were              0.1% (v/v) aqueous solution of formic acid, and 2) a 75:25 (v/v)
incubated in 2 mL microcentrifuge tubes in an Ecotron orbital           mixture of acetonitrile and 2-propanol with 0.1% formic acid.
incubator (Infors HT, Bottmingen, Switzerland) for 72 h. The            Gradient elution was performed as previously described (Stagge
temperature was set to 45°C, and the shaking to 170 rpm. The            et al., 2015).
glucose released after 72 h was quantified by HPLC as previously            The total concentration of phenolics was determined by using
described.                                                              Folin-Ciocalteu’s reagent (Singleton et al., 1999). Vanillin was

Frontiers in Energy Research | www.frontiersin.org                  4                                    August 2021 | Volume 9 | Article 701980
Ilanidis et al. Comparison of Conditioning Methods
TABLE 3 | Scheme for comparison of loadings of reducing agents (sodium sulfite, economy. The comparison was centered on the dosage 15 mM
sodium dithionite, and sodium borohydride) based on molarity, mass, and
(2.0 g/L) sodium sulfite and 15% (w/v) WIS, and covered
cost (using 15 mM Na2SO3 as the reference case).a
molarity, mass, and estimated cost (Table 3). Thus,
Agent Na2SO3 Na2S2O4 NaBH4 comparison on basis of molarity included 15 mM sodium
dithionite and 15 mM sodium borohydride. Comparison on
Molarity (mM) 15 15 15
Mass (g/L) 2.0 (15 mM) 2.0 (11 mM) 2.0 (53 mM) basis of mass included 2.0 g/L sodium dithionite (11 mM) and
Price (× 10-5 USD)b 3.3 (15 mM) 3.3 (3.8 mM) 3.3 (1.7 mM) 2.0 g/L sodium borohydride (53 mM). The cost of treatment with
a 15 mM sodium sulfite (which was estimated to 0.013 USD per L
The price of ethanol in the United States was estimated to USD 0.62 per liter of ethanol
(https://www.globalpetrolprices.com/ethanol_prices/). of slurry) was estimated to correspond to the cost for treatment
b
The price of reducing agent. with 3.8 mM sodium dithionite or 1.7 mM sodium borohydride.
used as calibration standard. Analyses was performed using RESULTS AND DISCUSSION
triplicates. The color generated after 2 h at ∼23°C was read at
760 nm in a microtiter plate in a Spectra Max i3X (Molecular Effects of Sulfur Oxyanions in Relation to
Devices, LLC, San Jose, CA, United States). the Content of Water-Insoluble Solids
The Total Aromatic Content (TAC) and the Total Carboxylic Several previous studies have addressed conditioning of
Acid Content (TCAC) were determined according to Wang et al. hydrolysates using reducing agents (Alriksson et al., 2011;
(2018). TAC, which is based on absorbance at 280 nm, was Cavka and Jönsson, 2013; Cavka et al., 2015a,b), but
measured using a UV1800 spectrophotometer (Shimadzu, conditioning of slurries and comparisons of conditioning of
Kyoto, Japan). TCAC was measured by titrating from pH 2.8 slurries and hydrolysates have not been well investigated. The
to pH 7.0 using a 200 mM aqueous solution of NaOH. first experimental series was devoted to how varying WIS content
and concentrations of sulfite and dithionite affect the
Techno-Economic Evaluation fermentability of spruce slurries (Table 1). Ethanol formation
Three reducing agents, sodium sulfite, sodium dithionite, and and residual glucose after 24 and 36 h of fermentation with S.
sodium borohydride, were compared with regard to effect and cerevisiae are shown in Figure 1 for A1–A12 and A19-A21. Data
FIGURE 1 | Concentrations of ethanol and residual glucose after 24 h (A) and 36 h (B) of HHF of Norway spruce slurry with sodium sulfite (A1–A9), with sodium
dithionite (A10–A12), and without addition (A19–A21). Error bars indicate standard deviations.
Frontiers in Energy Research | www.frontiersin.org 5 August 2021 | Volume 9 | Article 701980Ilanidis et al. Comparison of Conditioning Methods
FIGURE 2 | Glucose concentration after 24 h of enzymatic saccharification in relation to dosage of reductant expressed as the ratio of the reductant (in mM) to the
WIS concentration (in %, w/v). The data indicate: sodium sulfite addition in 10% (w/v) (red triangles), 15% (w/v) (red diamonds), or 20% (w/v) (red circles) WIS slurry;
sodium dithionite addition in 10% (w/v) (blue squares) WIS slurry.
on ethanol formation and residual glucose show good agreement TABLE 4 | Released glucose after 72 h of analytical enzymatic saccharification of
(Figure 1). Without treatment, there was no glucose buffered reaction mixtures containing 50 mg of pretreated solids originating
consumption or ethanol formation (A19–A21, Figure 1). from slurries conditioned with sodium dithionite or sodium sulfite, and sulfur
content of solid fractions.a
Slurries with 15% or 20% WIS that were treated with
5.0–12.5 mM sodium dithionite (A13–A18) showed no ethanol Sample Glucose (g/L) Sulfur content
formation or glucose consumption and are therefore not included (% dry weight)
in Figure 1. For A1-A12, treatments with the highest 10% WIS—15 mM Na2SO3 50.5 ± 0.1* 0.31 ± 0.01*
concentrations of sulfite (10–20% WIS, 17.5 mM) and 15% WIS—15 mM Na2SO3 49.9 ± 0.6* 0.45 ± 0.01*
dithionite (10% WIS, 12.5 mM) showed good results already 20% WIS—15 mM Na2SO3 49.2 ± 0.1* 0.46 ± 0.02*
after 24 h (Figure 1A). Also A2 (10% WIS, 12.5 sulfite) 10% WIS—15 mM Na2S2O4 51.1 ± 0.1* 0.50 ± 0.02*
15% WIS—15 mM Na2S2O4 52.3 ± 0.1* 0.58 ± 0.01*
showed good results after 24 h. After 36 h, also A1 (10% WIS, 20% WIS—15 mM Na2S2O4 53.6 ± 0.2* 0.60 ± 0.02*
7.5 mM sulfite), A5 (15% WIS, 12.5 mM sulfite), and A11 (10% 15% WIS—Untreated 43.4 ± 0.9 0.11 ± 0.01
WIS, 8.7 mM dithionite) showed good results. Raw Norway spruce NTDb 1 the fermentability did not increase further than that 50–70°C have been reported (Isoaho et al., 2019).
Frontiers in Energy Research | www.frontiersin.org 6 August 2021 | Volume 9 | Article 701980Ilanidis et al. Comparison of Conditioning Methods
FIGURE 3 | Concentrations of ethanol and residual glucose after 36 h of HHF of Norway spruce slurry using different methods (Table 2). Error bars indicate
standard deviations.
Effects of Sulfur Oxyanions on Solid Phase compared with standard methods such as overliming and
Reactions with dithionite and sulfite could result in sulfonation treatment with activated charcoal. Furthermore, hydrogenation
of lignin derivatives (Cavka et al., 2011). As sulfonation would is commonly used in industrial scale, and could be a potential
render lignin more hydrophilic, it could prevent catalytically alternative to previously studied reducing agents. An
non-productive adsorption of cellulolytic enzymes and thereby experimental series (B) was performed with slurries and
promote saccharification of cellulose. Analytical enzymatic different conditioning methods. The series was conducted with
saccharification and sulfur content determination (Table 4) 15% WIS and 15 mM sodium sulfite as reference case, i.e., a
were carried out to understand if there was a difference (mM): (% WIS) ratio of 1.0. This series also included a
between dithionite and sulfite with respect to sulfonation comparison of sodium sulfite, sodium dithionite, and sodium
reactions with lignin in the solid phase of the slurry. The borohydride based on molar concentration (15 mM), mass
experiment showed statistically significantly (p ≤ 0.01) higher concentration (2 g/L), and estimated cost (3.3 × 10⁻⁵ USD per
glucose concentrations for all treatments with sodium sulfite or treated unit), as outlined in Table 3 and with 15 mM sodium
sodium dithionite (Table 4). Treatments with equimolar sulfite as the reference case.
(15 mM) concentrations of sulfite and dithionite consistently The results of the fermentation experiment for Series B are
resulted in larger saccharification improvements after dithionite shown in Figure 3. Only the reference case with 15 mM sodium
treatment (18–24%) than after sulfite treatment (13–16%). sulfite (B1) and the highest concentration of sodium borohydride
Raw wood of Norway spruce contained negligible levels of (53 mM, B6) resulted in high ethanol titer. Treatments with the
sulfur, whereas the pretreated spruce wood contained low levels two highest concentrations of dithionite (15 mM, B2; 11 mM B3)
(0.11% w/w). All treatments with sulfite and dithionite resulted in and the highest loading of activated charcoal (2.5%, B9) resulted
statistically significant (p ≤ 0.01) increases of the sulfur content. in at least some ethanol. The lowest concentration of dithionite
Within each series with sulfite or dithionite, the sulfur content (B4), the two lowest concentrations of borohydride (B5, B7),
increased with the WIS content. However, the sulfur levels were overliming (B8), the lowest loading of activated charcoal (B10),
consistently higher for dithionite-treated material (0.50–0.60%) and hydrogenation (B11) were inefficient.
than for sulfite-treated material (0.31–0.46%). Thus, the results of The comparison of the three reducing agents (Figure 3;
the sulfur content analysis agree with the results from analytical Table 3) used for treatment of the softwood slurry indicates
enzymatic saccharification and show that sulfonation occurs even that with regard to concentration based on molarity (15 mM),
under very mild reaction conditions (23°C, pH 5.5, 10 min, sodium sulfite was better than sodium dithionite, which in turn
15 mM). Reactions of sulfur oxyanions with the solid phase was better than sodium borohydride. With regard to
would be side reactions with regard to alleviating microbial concentration based on mass (2 g/L), sodium sulfite and
inhibition, but this set of experiments demonstrates that the sodium borohydride performed equally well. That resulted in
reagent is not lost in vain but becomes useful in another way; sodium sulfite being superior with regard to lowest estimated
by promoting enzymatic saccharification. cost. The treatment cost was estimated to 2% of the market price
of ethanol.
The fact that some methods were inefficient in this
Comparison of Effects and Costs of comparative study does in no way imply that they are useless.
Conditioning Methods For instance, overliming is one of the best studied conditioning
Treatment with industrial reducing agents, such as sodium sulfite methods and previous studies show that effects can be very good
(Alriksson et al., 2011), sodium dithionite (Alriksson et al., 2011), and that problems such as sugar degradation can be minimized
and sodium borohydride (Cavka and Jönsson, 2013), can be through optimization of the conditions or by using alternative
Frontiers in Energy Research | www.frontiersin.org 7 August 2021 | Volume 9 | Article 701980Ilanidis et al. Comparison of Conditioning Methods
TABLE 5 | Concentration of monosaccharides in the pretreated slurry (PS) and hydrolysate (PL) with and without addition of sodium dithionite, sodium sulfite, sodium
borohydride, calcium hydroxide, activated charcoal, and hydrogenation.a
Combination Glucose (g/L) Xylose (g/L) Galactose (g/L) Mannose (g/L) Arabinose (g/L)
PS
C1 20.6 9.8 3.8 23.3 2.2
C2PL 21.3 10.2 3.9 24.1 2.3
C3PS 19.5 9.4 3.6 22.1 2.1
C4PS 20.5 9.8 3.8 23.3 2.2
C5PS 20.2 9.7 3.8 22.6 2.2
C6PL 21.4 10.3 4.0 24.1 2.3
C7PS 20.3 9.7 3.7 22.7 2.1
C8PS 18.1 8.6 3.3 20.1 1.9
C9PS 19.1 9.2 3.5 21.5 2.0
C10PL 20.8 10.1 3.8 23.6 2.2
C11PS 19.5 9.4 3.6 22.1 2.1
C12PS 18.7 9.1 3.5 21.3 2.0
C13PS 18.3 8.9 3.4 20.8 2.0
C14PS 20.6 10.0 3.9 23.3 2.2
C15PL 19.7 9.6 3.7 22.6 2.1
C16PS 21.6 10.3 4.0 24.5 2.3
a
Standard deviations (in g/L): glucose, 0.2; xylose, 0.2; galactose, 0.1; mannose, 0.2; arabinose, 0.1.
forms of alkali (Larsson et al., 1999a; Alriksson et al., 2006; Hydrogen would be expected to give the same effect (C15,
Fernandes-Klajn et al., 2018). Activated charcoal has been C16), but hydrolysates and slurries are complex mixtures and
shown to remove HMF, furfural, and phenolics, and can competing reactions likely occur.
sometimes give good effects (Parajó et al., 1997; Guo et al., Figure 4 shows the concentrations of by-products in the liquid
2013; Fernandes-Klajn et al., 2018). phase of pretreated spruce (C16) and the effects of the different
conditioning methods on formation of inhibitory by-products
(C1–C15). Acetic acid was the predominant aliphatic acid and
Comparison of Chemical Effects of accounted for 62% of the TCAC. Together with formic acid and
Conditioning Methods levulinic acid, the share was 81% of the TCAC. When the
To better understand the underpinning chemistry behind the concentrations of aliphatic carboxylic acids are above 100 mM,
different effects of the conditioning methods and also to they can be expected to have an inhibitory effect on S. cerevisiae
understand different effects on hydrolysates and slurries, a third (Larsson et al., 1999b).
experimental series, C, was conducted (Table 2). A drawback with The concentration of formaldehyde was exceptionally high,
some conditioning methods, such as overliming, is that they are not 12.8 mM (Figure 4). Cavka et al. (2015b) examined six
selective for inhibitors but also affect monosaccharide sugars. pretreatment liquids from various feedstocks, found
Therefore, potential effects on the five main monosaccharides formaldehyde concentrations of up to 4.4 mM, and found that
were investigated (Table 5). As expected for pretreated there were some inhibitory effects already at 1 mM. The
softwood prior to enzymatic saccharification (Table 5), concentrations of the carbohydrate-derived heteroaromatics
mannose (24.5 g/L) and glucose (21.6 g/L) were predominant, furfural (21.1 mM, 2.03 g/L) and HMF (15.8 mM, 2.00 g/L)
xylose was present in intermediate concentration (10.3 g/L), and were relatively low. Due to low molar toxicity, high
galactose (4.0 g/L) and arabinose (2.3 g/L) concentrations were concentrations of furfural (31 mM) and HMF (39 mM) may
low. Data consistently show that for each monosaccharide C8PS, be required for inhibitory effects (Wang et al., 2020).
C9PS, C12PS, and C13PS always exhibited the lowest values. Lignocellulosic hydrolysates contain a multitude of aromatic
Compared to the control (C16PS), these four treatments resulted substances (Du et al., 2010), and the two ones included in
in 12–16% less glucose, 11–17% less xylose, 12–18% less galactose, Figure 4, the phenolics vanillin and coniferyl aldehyde, merely
12–18% less mannose, and 13–17% less arabinose. Again, data are serve as examples. Vanillin and coniferyl aldehyde are guaiacyl-
very consistent, and, regardless of the monosaccharide analyzed, type phenolics derived from the guaiacyl lignin of the softwood
the decreases were always in the interval 11–18%. For the sum of raw material. p-Benzoquinone, 4-hydroxybenzaldehyde,
monosaccharides the decreases compared to the control were: syringaldehyde, p-coumaraldehyde, and acetovanillone were
C8PS, 17%; C9PS, 12%; C12PS, 13%; C13PS, 15%. Thus, detectable, but they are not included, as the initial
treatments with sodium borohydride and activated charcoal, concentrations were very low. Vanillin, coniferyl aldehyde, and
especially in large dosages, resulted in a substantial decrease in other phenolics are a part of the total phenolics and the TAC
the content of monosaccharide sugars. All other methods exhibited (Figure 4). Apart from phenolics, the TAC value also covers non-
values that were always within 10% of those of the control and phenolic aromatics and heteroaromatics, such as furans.
sometimes no difference could be detected. The effect of sodium The effects on by-products (Figure 4) on slurries and
borohydride (Table 5) can be attributed to reduction of the five pretreatment liquids (hemicellulose hydrolysates) were
aldose sugars to alditol products (Abdel-Akher et al., 1951). fundamentally different from the effects on monosaccharides
Frontiers in Energy Research | www.frontiersin.org 8 August 2021 | Volume 9 | Article 701980Ilanidis et al. Comparison of Conditioning Methods
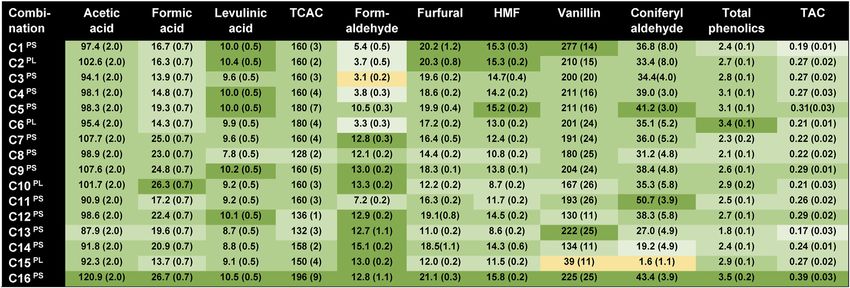
FIGURE 4 | Measurements of bioconversion inhibitors in the pretreated slurry (PS) and hydrolysate (PL) with and without sodium dithionite, sodium sulfite, sodium
borohydride, calcium hydroxide, activated charcoal, and hydrogenation. Concentrations of bioconversion inhibitors are indicated in mM, except for vanillin and coniferyl
aldehyde (μM), total phenolics (g/L with vanillin as calibration standard), and TAC (UV absorption at 280 nm with a dilution factor of 500). The concentrations are mean
values of three replicates, with standard deviations indicated in parentheses. Effects are color-coded in relation to C16PS (untreated reference), with lighter colors
reflecting lower concentrations in relation to C16PS: (dark green) 95% or higher, (medium green) 75–94%, (light green) 50–74%, (very light green) 25–49%, and
(yellow) < 25%.
(Table 5). Effects on aliphatic acids and TCAC were generally furan aldehydes, especially in reaction mixtures with
small. Treatments with activated charcoal, particularly using high pretreatment liquid (C10 and C15). For C10, addition of
dosage (2.5%), resulted in comparatively large reductions of the 15 mM sodium borohydride resulted in a roughly equimolar
concentrations of acids. The sulfur oxyanions, sulfite and decrease of furan aldehydes, as the combined concentration of
dithionite, caused decreases in the concentration of formic furfural and HMF dropped from 37 to 21 mM. As seen previously
acid that exceeded 25%. (Table 5), reagents such as sodium borohydride may also be
The effects on formaldehyde were highly variable (Figure 4). partially consumed by reactions in which aldose sugars are
Treatments with sulfite and dithionite decreased the reduced to sugar alcohols. Thus, reactions with sugars and
concentration of formaldehyde to less than 50% of the furans might explain the poor effect on formaldehyde of
original, except C5 for which the dithionite concentration was sodium borohydride and hydrogen. As furan aldehydes in C7
only 3.8 mM. The treatments of slurry or pretreatment liquid and C14 were less affected than in C10 and C15, the results also
with 15 mM sulfite or dithionite resulted in 58–76% reduction of suggest that treatments with sodium borohydride and
the original concentration of formaldehyde. The highest hydrogenation lead to further side reactions when solids are
concentration of sodium borohydride (C8) and overliming present in the reaction mixtures.
(C11) also caused some decrease in the concentration of Hydrogenation was the most efficient approach for reducing
formaldehyde, whereas the other seven methods had no or the concentrations of vanillin and coniferyl aldehyde (Figure 4).
negligible effects. It is particularly noteworthy that whereas Hydrogenation of pretreatment liquid (C15) even reduced the
sulfite and dithionite had large effects on formaldehyde, the levels to 25%) of the concentrations of furan with sodium borohydride (C7, C8), overliming (C11), treatment
aldehydes were observed for higher concentrations of sodium with high loading of activated charcoal (C13), and hydrogenation
borohydride (C8, C10), high loading of activated charcoal (C13), of slurry (C14) reduced the level of total phenolics withIlanidis et al. Comparison of Conditioning Methods
Many of the methods had a large impact on TAC (Table 5). Two phenomenon is not self-evident considering that reaction
of the methods, C1 (15 mM sodium sulfite) and C13 (high loading patterns in authentic hydrolysates sometimes differ from what
of activated charcoal), even reduced the TAC level with >50%. is observed in synthetic medium with only one inhibitor present
Due to the unexpectedly large difference between sodium at the time. The findings suggest that further research is
sulfite and sodium dithionite in experiments with slurry warranted with regard to utilization of sulfur oxyanions to
(Series A and B), the chemical effects of reducing agents in achieve optimal performance of enzyme preparations and
slurry and liquid were compared in Series C. The most microorganisms in pretreated lignocellulosic biomass.
obvious differences were observed for hydrogenation, for
which reductions of aldehydes, such as furfural, HMF, vanillin,
and coniferyl aldehyde, were larger for the pretreatment liquid DATA AVAILABILITY STATEMENT
than for the slurry. In several cases, there was a similar trend for
the other reductants, although differences were smaller. Large The original contributions presented in the study are included in
differences between treatments of slurry and liquid suggest the the article/Supplementary Material, further inquiries can be
occurrence of side reactions involving the solid phase and directed to the corresponding author.
relatively poor selectivity for targeting microbial inhibitors in
the liquid phase. Better selectivity can tentatively be achieved with
somewhat weaker reducing agents, as stronger reducing agents AUTHOR CONTRIBUTIONS
may react with a wider array of substances in complex media.
Such differences would be more difficult to detect in model Conceptualization, DI, BA, AC, and LJ; methodology, DI, SS, BA,
experiments in which only one inhibitor is present at the time, and AC; validation, DI and SS; formal analysis, DI and SS;
indicating the need for comparative experiments with investigation, DI and SS; resources, BA, AC, and LJ;
hydrolysates and slurries, as in this work. writing—original draft preparation, DI; writing—review and
editing, LJ; visualization, DI and LJ; supervision, BA and LJ;
project administration, LJ; funding acquisition, BA, AC, and
CONCLUSION LJ. All authors read and approved the manuscript.
The comparison of different conditioning methods for pretreated
softwood, including four different industrial reducing agents, FUNDING
resulted in several new findings. Previous results had suggested
that equimolar dosage of dithionite was superior to sulfite with This work was supported by Swedish Energy Agency (P41285-1,
regard to alleviation of microbial inhibition, but results with P47516-1), Kempe Foundations, and the strategic research
slurry indicated the opposite both with regard to effects and environment Bio4Energy (www.bio4energy.se).
treatment costs. Chemical and biochemical analyses revealed that
the sulfur oxyanions, and particularly dithionite, caused
sulfonation of the solid phase of the pretreated biomass even ACKNOWLEDGMENTS
when using low concentrations and very mild reaction
conditions, something that had a positive effect on enzymatic We thank SEKAB E-Technology for supplying the pretreated
saccharification. The sulfur oxyanions were found to efficiently Norway spruce. We are grateful to Jonna Almqvist and David
reduce the concentration of formaldehyde in pretreated biomass, Blomberg Saitton at RISE Processum for their help with the
a phenomenon that has not been reported previously. That hydrogenation experiment.
Cavka, A., Alriksson, B., Ahnlund, M., and Jönsson, L. J. (2011). Effect of Sulfur
REFERENCES Oxyanions on Lignocellulose-Derived Fermentation Inhibitors. Biotechnol.
Bioeng. 108, 2592–2599. doi:10.1002/bit.23244
Abdel-Akher, M., Hamilton, J. K., and Smith, F. (1951). The Reduction of Sugars Cavka, A., and Jönsson, L. J. (2013). Detoxification of Lignocellulosic Hydrolysates
With Sodium Borohydride. J. Am. Chem. Soc. 73, 4691–4692. doi:10.1021/ Using Sodium Borohydride. Bioresour. Technology. 136, 368–376. doi:10.1016/
ja01156a501 j.biortech.2013.03.014
Alriksson, B., Cavka, A., and Jönsson, L. J. (2011). Improving the Fermentability of Cavka, A., Martín, C., Alriksson, B., Mörtsell, M., and Jönsson, L. J. (2015a).
Enzymatic Hydrolysates of Lignocellulose Through Chemical In-Situ Techno-Economic Evaluation of Conditioning With Sodium Sulfite for
Detoxification With Reducing Agents. Bioresour. Technology. 102, Bioethanol Production From Softwood. Bioresour. Technology. 196, 129–135.
1254–1263. doi:10.1016/j.biortech.2010.08.037 doi:10.1016/j.biortech.2015.07.051
Alriksson, B., Sjöde, A., Nilvebrant, N.-O., and Jönsson, L. J. (2006). Optimal Conditions Cavka, A., Stagge, S., and Jönsson, L. J. (2015b). Identification of Small Aliphatic
for Alkaline Detoxification of Dilute-Acid Lignocellulose Hydrolysates. Appl. Aldehydes in Pretreated Lignocellulosic Feedstocks and Evaluation of Their
Biochem. Biotechnol. 130, 599–611. doi:10.1385/abab:130:1:599 Inhibitory Effects on Yeast. J. Agric. Food Chem. 63, 9747–9754. doi:10.1021/
Cantarella, M., Cantarella, L., Gallifuoco, A., Spera, A., and Alfani, F. (2004). acs.jafc.5b04803
Comparison of Different Detoxification Methods for Steam-Exploded Poplar Chum, H. L., Johnson, D. K., Black, S. K., and Overend, R. P. (1990). Pretreatment-
Wood as a Substrate for the Bioproduction of Ethanol in SHF and SSF. Process Catalyst Effects and the Combined Severity Parameter. Appl. Biochem.
Biochem. 39, 1533–1542. doi:10.1016/s0032-9592(03)00285-1 Biotechnol. 24-25, 1–14. doi:10.1007/bf02920229
Frontiers in Energy Research | www.frontiersin.org 10 August 2021 | Volume 9 | Article 701980Ilanidis et al. Comparison of Conditioning Methods Du, B., Sharma, L. N., Becker, C., Chen, S.-F., Mowery, R. A., van Walsum, G. P., Ragauskas, A. J., Williams, C. K., Davison, B. H., Britovsek, G., Cairney, J., Eckert, et al. (2010). Effect of Varying Feedstock-Pretreatment Chemistry C. A., et al. (2006). The Path Forward for Biofuels and Biomaterials. Science. Combinations on the Formation and Accumulation of Potentially Inhibitory 311, 484–489. doi:10.1126/science.1114736 Degradation Products in Biomass Hydrolysates. Biotechnol. Bioeng. 107, Rapson, W. H. (1969). Mechanisms of Groundwood Bleaching. Appita J. 23, 102–114. 430–440. doi:10.1002/bit.22829 Rasmussen, H., Sørensen, H. R., and Meyer, A. S. (2014). Formation of Degradation Fernandes-Klajn, F., Romero-García, J. M., Díaz, M. J., and Castro, E. (2018). Compounds from Lignocellulosic Biomass in the Biorefinery: Sugar Reaction Comparison of Fermentation Strategies for Ethanol Production from Olive Mechanisms. Carbohydr. Res. 385, 45–57. doi:10.1016/j.carres.2013.08.029 Tree Pruning Biomass. Ind. Crops Prod. 122, 98–106. doi:10.1016/ Singleton, V. L., Orthofer, R., and Lamuela-Raventós, R. M. (1999). Analysis of j.indcrop.2018.05.063 Total Phenols and Other Oxidation Substrates and Antioxidants by Means of Galbe, M., and Wallberg, O. (2019). Pretreatment for Biorefineries: a Review of Folin-Ciocalteu Reagent. Methods Enzymol. 299, 152–178. doi:10.1016/s0076- Common Methods for Efficient Utilisation of Lignocellulosic Materials. 6879(99)99017-1 Biotechnol. Biofuels. 12, 294. doi:10.1186/s13068-019-1634-1 Stagge, S., Cavka, A., and Jönsson, L. J. (2015). Identification of Benzoquinones in Gandla, M., Martín, C., and Jönsson, L. J. (2018). Analytical Enzymatic Pretreated Lignocellulosic Feedstocks and Inhibitory Effects on Yeast. AMB Saccharification of Lignocellulosic Biomass for Conversion to Biofuels and Express. 5, 62. doi:10.1186/s13568-015-0149-9 Bio-Based Chemicals. Energies. 11, 2936. doi:10.3390/en11112936 Wang, L.-Q., Cai, L.-Y., and Ma, Y.-L. (2020). Study on Inhibitors from Acid Guo, X., Cavka, A., Jönsson, L. J., and Hong, F. (2013). Comparison of Methods for Pretreatment of Corn Stalk on Ethanol Fermentation by Alcohol Yeast. RSC Detoxification of Spruce Hydrolysate for Bacterial Cellulose Production. Adv. 10, 38409–38415. doi:10.1039/d0ra04965d Microb. Cel Fact. 12, 93. doi:10.1186/1475-2859-12-93 Wang, Z., Wu, G., and Jönsson, L. J. (2018). Effects of Impregnation of Softwood Hoyer, K., Galbe, M., and Zacchi, G. (2009). Production of Fuel Ethanol From Softwood With Sulfuric Acid and Sulfur Dioxide on Chemical and Physical by Simultaneous Saccharification and Fermentation at High Dry Matter Content. Characteristics, Enzymatic Digestibility, and Fermentability. Bioresour. J. Chem. Technol. Biotechnol. 84, 570–577. doi:10.1002/jctb.2082 Technology. 247, 200–208. doi:10.1016/j.biortech.2017.09.081 Isoaho, J. P., Soininen, J. K., and Alén, R. J. (2019). Chemistry of Dithionite Ximenes, E., Kim, Y., Mosier, N., Dien, B., and Ladisch, M. (2010). Inhibition of Bleaching. Part 1. Effect of Bleaching Variables. Appita J. 72, 197–210. Cellulases by Phenols. Enzyme Microb. Technology. 46, 170–176. doi:10.1016/ Jönsson, L. J., Alriksson, B., and Nilvebrant, N.-O. (2013). Bioconversion of j.enzmictec.2009.11.001 Lignocellulose: Inhibitors and Detoxification. Biotechnol. Biofuels. 6, 16. Zhai, R., Hu, J., and Saddler, J. N. (2016). What Are the Major Components in doi:10.1186/1754-6834-6-16 Steam Pretreated Lignocellulosic Biomass that Inhibit the Efficacy of Cellulase Jönsson, L. J., and Martín, C. (2016). Pretreatment of Lignocellulose: Formation of Enzyme Mixtures?. ACS Sustainable Chem. Eng. 4, 3429–3436. doi:10.1021/ Inhibitory By-Products and Strategies for Minimizing Their Effects. Bioresour. acssuschemeng.6b00481 Technology. 199, 103–112. doi:10.1016/j.biortech.2015.10.009 Zhong, N., Chandra, R., and Saddler, J. N. (2019). Sulfite Post-Treatment to Koppram, R., Tomás-Pejó, E., Xiros, C., and Olsson, L. (2014). Lignocellulosic Simultaneously Detoxify and Improve the Enzymatic Hydrolysis and Ethanol Production at High-Gravity: Challenges and Perspectives. Trends Fermentation of a Steam-Pretreated Softwood lodgepole Pine Whole Slurry. Biotechnol. 32, 46–53. doi:10.1016/j.tibtech.2013.10.003 ACS Sustainable Chem. Eng. 7, 5192–5199. doi:10.1021/acssuschemeng.8b06092 Kristensen, J. B., Felby, C., and Jørgensen, H. (2009). Yield-Determining Factors in Zhou, H., Gleisner, R., Zhu, J. Y., Tian, Y., and Qiao, Y. (2018). SPORL High-Solids Enzymatic Hydrolysis of Lignocellulose. Biotechnol. Biofuels. 2, 11. Pretreatment Spent Liquors Enhance the Enzymatic Hydrolysis of Cellulose doi:10.1186/1754-6834-2-11 and Ethanol Production From Glucose. Energy Fuels. 32, 7636–7642. Larsson, S., Reimann, A., Nilvebrant, N.-O., and Jönsson, L. J. (1999a). Comparison of doi:10.1021/acs.energyfuels.8b00864 Different Methods for the Detoxification of Lignocellulose Hydrolyzates of Spruce. Appl. Biochem. Biotechnol. 77-79, 91–103. doi:10.1007/978-1-4612-1604-9_9 Conflict of Interest: Four of the authors (DI, BA, AC, and LJ) are co-inventors of Larsson, S., Palmqvist, E., Hahn-Hägerdal, B., Tengborg, C., Stenberg, K., Zacchi, patents/patent applications in the area biochemical conversion of biomass. One of G., et al. (1999b). The Generation of Fermentation Inhibitors during Dilute the authors (AC) is an employee at SEKAB E-Technology AB, a company that is a Acid Hydrolysis of Softwood. Enzyme Microb. Technology. 24, 151–159. technology provider in the biomass conversion area. doi:10.1016/s0141-0229(98)00101-x Larsson, S., Quintana-Sáinz, A., Reimann, A., Nilvebrant, N.-O., and Jönsson, L. J. The remaining author declares that the research was conducted in the absence of (2000). Influence of Lignocellulose-Derived Aromatic Compounds on Oxygen- any commercial or financial relationships that could be construed as a potential Limited Growth and Ethanolic Fermentation by Saccharomyces cerevisiae. Appl. conflict of interest. Biochem. Biotechnol. 84-86, 617–632. doi:10.1385/abab:84-86:1-9:617 Mboowa, D. (2021). A Review of the Traditional Pulping Methods and the Recent Publisher’s Note: All claims expressed in this article are solely those of the authors Improvements in the Pulping Processes. Biomass Conv. Bioref. doi:10.1007/ and do not necessarily represent those of their affiliated organizations, or those of s13399-020-01243-6 the publisher, the editors and the reviewers. Any product that may be evaluated in Öhgren, K., Bura, R., Lesnicki, G., Saddler, J., and Zacchi, G. (2007). A Comparison this article, or claim that may be made by its manufacturer, is not guaranteed or Between Simultaneous Saccharification and Fermentation and Separate endorsed by the publisher. Hydrolysis and Fermentation Using Steam-Pretreated Corn Stover. Process Biochem. 42, 834–839. doi:10.1016/j.procbio.2007.02.003 Copyright © 2021 Ilanidis, Stagge, Alriksson, Cavka and Jönsson. This is an open- Overend, R. P., and Chornet, E. (1987). Fractionation of Lignocellulosics by Steam- access article distributed under the terms of the Creative Commons Attribution Aqueous Pretreatments. Phil. Trans. R. Soc. Lond. A321, 523–536. doi:10.1098/ License (CC BY). The use, distribution or reproduction in other forums is permitted, rsta.1987.0029 provided the original author(s) and the copyright owner(s) are credited and that the Parajó, J. C., Domínguez, H., and Domínguez, J. M. (1997). Xylitol Production original publication in this journal is cited, in accordance with accepted academic from Eucalyptus wood Hydrolysates Extracted With Organic Solvents. Process practice. No use, distribution or reproduction is permitted which does not comply Biochem. 32, 599–604. doi:10.1016/s0032-9592(97)00016-2 with these terms. Frontiers in Energy Research | www.frontiersin.org 11 August 2021 | Volume 9 | Article 701980
You can also read