Comparing infrared spectroscopic methods for the characterization of Plasmodium falciparum-infected human erythrocytes - Nature
←
→
Page content transcription
If your browser does not render page correctly, please read the page content below
ARTICLE
                  https://doi.org/10.1038/s42004-021-00567-2                 OPEN

                  Comparing infrared spectroscopic methods for the
                  characterization of Plasmodium falciparum-infected
                  human erythrocytes
                  Agnieszka M. Banas 1 ✉, Krzysztof Banas 1, Trang T. T. Chu 2, Renugah Naidu2,
                  Paul Edward Hutchinson 3, Rupesh Agrawal 4, Michael K. F. Lo 5, Mustafa Kansiz5, Anirban Roy6,
                  Rajesh Chandramohanadas 2,7 ✉ & Mark B. H. Breese1

                  Malaria, caused by parasites of the species Plasmodium, is among the major life-threatening
1234567890():,;

                  diseases to afflict humanity. The infectious cycle of Plasmodium is very complex involving
                  distinct life stages and transitions characterized by cellular and molecular alterations.
                  Therefore, novel single-cell technologies are warranted to extract details pertinent to Plas-
                  modium-host cell interactions and underpinning biological transformations. Herein, we tested
                  two emerging spectroscopic approaches: (a) Optical Photothermal Infrared spectroscopy and
                  (b) Atomic Force Microscopy combined with infrared spectroscopy in contrast to (c) Fourier
                  Transform InfraRed microspectroscopy, to investigate Plasmodium-infected erythrocytes.
                  Chemical spatial distributions of selected bands and spectra captured using the three
                  modalities for major macromolecules together with advantages and limitations of each
                  method is presented here. These results indicate that O-PTIR and AFM-IR techniques can be
                  explored for extracting sub-micron resolution molecular signatures within heterogeneous and
                  dynamic samples such as Plasmodium-infected human RBCs.

                  1 Singapore Synchrotron Light Source, 5 Research Link, Singapore, Singapore. 2 Pillar of Engineering Product Development, Singapore University of Technology

                  and Design, Singapore, Singapore. 3 Flow Cytometry Lab, Life Sciences Institute, National University of Singapore, Singapore, Singapore. 4 National Healthcare
                  Group Eye Institute, Tan Tock Seng Hospital, Singapore, Singapore. 5 Photothermal Spectroscopy Corp, Santa Barbara, CA, USA. 6 Bruker Nano Surfaces &
                  Metrology, Goleta, CA, USA. 7 Department of Microbiology & Immunology, Yong Loo Lin. School of Medicine, National University of Singapore,
                  Singapore, Singapore. ✉email: slsba@nus.edu.sg; micrc@nus.edu.sg

                  COMMUNICATIONS CHEMISTRY | (2021)4:129 | https://doi.org/10.1038/s42004-021-00567-2 | www.nature.com/commschem                                              1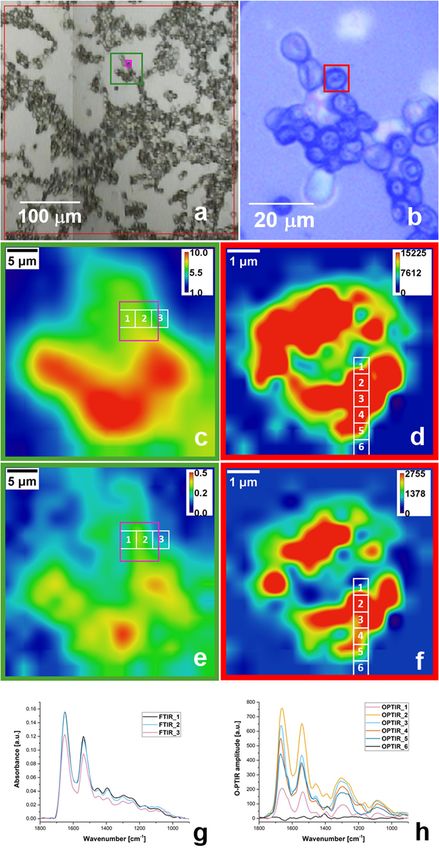
ARTICLE                                                           COMMUNICATIONS CHEMISTRY | https://doi.org/10.1038/s42004-021-00567-2

M
            alaria is one of the most common and life-threatening              Another commonly used method for analysis of Plasmodium-
            diseases that continues to affect mankind. Every year,          infected RBCs is FTIR (Fourier Transform InfraRed) micro-
            an estimated 400,000 deaths1 occur because of this              spectroscopy, a method known since the middle of the 20th
mosquito-borne infectious disease. Since 2000, the rate of new              century and broadly applied in biomedical research. FTIR
malaria vaccine trials registered at ClinialTrials.gov has remained         microspectroscopy probes intrinsic molecular vibrational fre-
steady at about 10 trials each year2. So far, only one of them, the         quencies of bonds between molecules present in a sample. It is
pre-erythrocytic vaccine (PEV) product RTS,S/AS01E has proven               worth emphasizing that IR light used for the experiments is too
its safety and effectiveness in reduction of clinical malaria cases in      weak to cause any cell damage. Typical values of the power of IR
African children. Up to now, the world is still waiting for opti-           emitted from a conventional (Globar) source or synchrotron
mally developed medications to fight the scourge of malaria. One             based source are of ~80 µW over the whole spectral range.
of the hypotheses claims that malaria vaccine development is                   Since vibrational frequencies depend on the parameters’
slowed down by the complexity of the parasite’s life cycle and its          characteristic of the molecular structures, they can provide
vast repertoire of polymorphic proteins.                                    valuable information on cellular biochemical changes through
   Early diagnosis is still the key to start immediate treatment and        relative quantification of lipids, proteins, carbohydrate etc, as
through this, to reduce malaria-associated deaths. Currently,               reflected by published literature discussing analysis of cells by
methods such as microscopic examination of infected blood                   means of FTIR spectroscopy17–19.
smears3,4, gene amplification techniques5,6 or serological detec-               However, it is worth emphasizing that there are shortcomings
tion tests7 are relied upon in clinical diagnosis of malaria. Some of       associated with FTIR, which may prevent its use in single cell-
these techniques require sophisticated instruments, expensive               based studies. Theoretically, single cells can be analyzed either
reagents or trained personnel, whereas microscopic methods are              when apertures are used in the IR microscope or when the IR
easy to perform and cost-effective, but are prone to human errors.          microscope is equipped with a 2D Focal Plane Array (FPA)
   Amongst the various species of malaria parasites, Plasmodium             detector. Aperture-based systems considerably limit the light
falciparum is responsible for most malaria-associated deaths. The           throughput, and hence significantly degrade spectral signal-to-
sporozoite stage of the parasite enters the human body through              noise (sensitivity), as the aperture masks throw away most of the
the bite of an infected mosquito and proliferates asymptomati-              incoming infrared light. More advanced FTIR microscopes with
cally into merozoites upon reaching the liver (the pre-erythrocytic         FPA detectors remove the need for apertures, with the FPA pixels
hepatic stage). Later, the merozoites invade the red blood cells            themselves defining measured area. A FPA detector is composed
(RBC) to start a ~48h-long intraerythrocytic developmental cycle            of many basic detector units recording a full FTIR spectrum
(IDC). The very first stage of this process is constrained to the            within the interval 4000–900 cm−1 from a defined spot (few µm2)
parasitophorous vacuole (PV), a structure allowing a parasite to            on the sample. However, the amount of light absorbed in the IR
grow within cell and at the same time being protected from the              region entering the single detector unit is small, leading to noisy
cell defense mechanisms8. The young parasites, also known as the            spectra. Widely-used FPA detectors composed of 128 horizontal
“ring” stages, have low metabolic activity. To facilitate its devel-        pixels and 128 vertical pixels working with 15x objective lens
opment, erythrocyte cytoplasm containing human hemoglobin is                (Bruker 0.4 NA) have an effective pixel size of 2.7 by 2.7 µm2.
ingested into an acidic digestive vacuole (DV). Hemoglobin is               However, it does not mean that during experiments chemistry
digested in these compartments; this process leaves insoluble               from that spot is recorded—it is only a “pixel size.” Pixel size
reactive products due to the release of heme, which is neutralized          must not be confused with spatial resolution, as it is one of the
by the formation of β-hematin that biocrystallizes to the chemi-            most      critical     measurement      parameters       in    FTIR
cally inert hemozoin, also known as the malaria pigment9,10. DV             microspectroscopy20. The spatial resolution is restricted by the
plays a crucial role in parasite development, it is also a place for        so-called diffraction limit and can be calculated using the Ray-
amino acid transportation, oxygen radical detoxification and drug            leigh criterion, which depends on the wavelength. For 15x
accumulation11,12. Along with parasite development, a single                objective lens mentioned earlier, simple calculations show that for
large DV is formed at the late ring stage and increases its size            selected wavenumbers much larger values than 2.7 µm have been
during development into trophozoites when maximum hemo-                     obtained: 15 µm (at 1000 cm−1), 9.2 µm (at 1650 cm−1), and
globin digestion is observed. In the next IDC stage, known as               5.4 µm (at 2800 cm−1). It means that the response from the
schizonts, the DV shrinks in size and hemozoin is released into             system comes from an area much bigger than the pixel size,
the blood circulation.                                                      leading to spatial averaging of biochemical heterogeneities across
   Parasites have unique biochemical signatures representing their          areas of up to ~15 µm within the single cell, thus severely limiting
cellular composition (nucleic acids, lipids, proteins) which can            intra-cellular imaging.
undergo dynamic changes during the course of IDC. Given the                    With new and evolving parasitic forms, drug resistance and
relatively simple composition and structural features of terminally         lack of a commercial vaccine, there is a pressing need for
differentiated host RBCs, significant chemical differences between           understanding the interactions of the Plasmodium parasites with
infected and uninfected RBCs, spectroscopic methods could be                its host cells during the complex multistage life cycle, towards
used to analyze the parasite’s developmental process.                       novel therapeutic interventions. Studying changes that the cell
   Label-free techniques such as Raman imaging microscopy has               undergoes also has the potential to identify key biological and
been tested as a potential method to diagnose Plasmodium                    physiological processes that could lead to new and improved
infections of human RBCs on the basis of strong scattering from             antimalarial treatments. If vibrational spectroscopy is being
the hemozoin pigment13. However, a rather low signal to noise               considered as a potential method of examining infected RBCs,
ratio, high autofluorescence and potential photodamage limits its            according to the authors of this paper, it is necessary to remember
effectiveness in revealing molecular structures of infected                 that detailed analysis of parasite-host interactions should be
single RBCs.                                                                performed at the microscale or even the nanoscale. Multiple small
   Other label-free methods such as tomographic phase micro-                DVs which are characteristic of the early and mid-stage rings
scopy (TPM) were also previously explored to study Plasmodium-              have a diameter of 150–300 nm21, at the trophozoite stage, when
infected RBCs as it allows visualization of intracellular organelles,       hemoglobin degradation is noticeable, DV has a diameter of up to
membranous structures and life stage transitions from 3D                    2.2 µm, and later in schizogony, it decreases in size to
refractive index tomograms14–16.                                            0.8–1.2 µm22,23.

2                     COMMUNICATIONS CHEMISTRY | (2021)4:129 | https://doi.org/10.1038/s42004-021-00567-2 | www.nature.com/commschem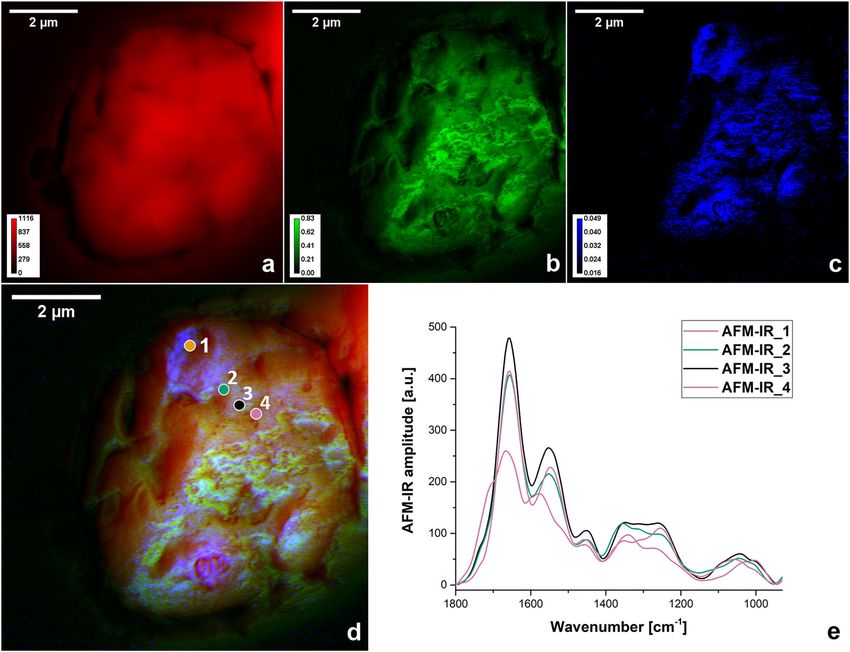
COMMUNICATIONS CHEMISTRY | https://doi.org/10.1038/s42004-021-00567-2 ARTICLE
The last decade has seen impressive progress in the develop-
ment of new techniques based on the interpretation of vibrational
frequencies of bonds present in molecules. One of them is AFM-
IR (Atomic Force Microscopy - Infrared) spectroscopy. This
technique combines the power of infrared absorption spectro-
scopy for non-destructive, label-free chemical identification with
the nanoscale resolution obtained by atomic force microscopy
and can be successfully applied to study the composition of cells
at the nanoscale24,25. AFM-IR has been already used to analyse
malaria infected RBCs26. Another novel and highly versatile
technique, Optical Photothermal Infrared (O-PTIR) spectro-
scopy, has captured recent attentions for its versatility and offers
submicron resolution for IR imaging and spectroscopy27. This
method is also label-free, requires no special sample preparation
steps, operates in an easy-to-use far-field mode (non-contact) and
offers submicron resolution for IR imaging and spectroscopy.
In this paper, we determine the relevance of sub-micron resolution
towards the analysis of Plasmodium falciparum-infected human
erythrocytes by means of vibrational spectroscopy. Comparison of
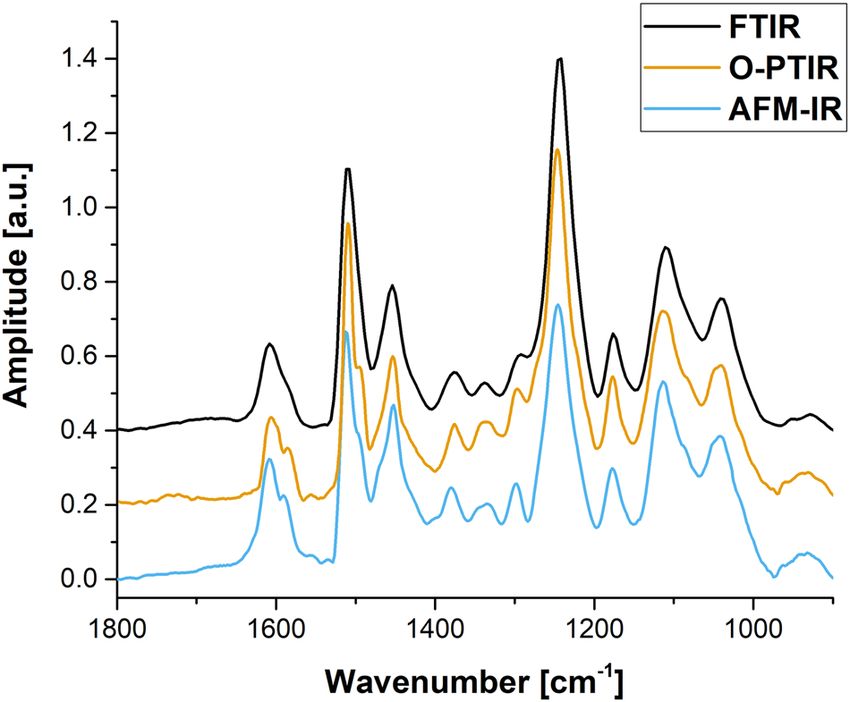
two evolving techniques (O-PTIR and AFM-IR) against the more Fig. 1 Validation of spectral quality between FTIR, O-PTIR and AFM-IR
traditional FTIR microspectroscopy based on results obtained for spectroscopy. FTIR (black), O-PTIR (orange) and AFM-IR (sky blue)
infected RBCs will be presented along with the advantages and spectra collected for a microtomed section of a cured epoxy adhesive
limitations of each method. Infected RBCs (iRBCs) were selected as a (~800 nm) placed on CaF2 window. Raw spectra have been offset for better
subject of our analysis due to their heterogeneity arising from the clarity.
parasite infection. Our work is mainly focused on illustrating all the
benefits (if any) of analyzing iRBCs content with sub-micron reso- Despite being collected in various modes: reflection (for O-
lution. For our case study about 20 iRBCs and 20 control (healthy, PTIR) or contact (for AFM-IR), spectra presented in Fig. 1, very
un-infected) RBCs were taken into account. Conclusions presented in closely match with the FTIR absorption spectrum measured in
the paper are a cumulative sum of our consistent observations across transmission mode. It needs to be emphasized that all major
all cells tested. absorbance peaks were detected; with their ratios and positions
To our knowledge, this is the first comprehensive investigation directly comparable.
to classify, compare and identify potential methods which could This finding confirms that since O-PTIR and AFM-IR provide
be used for the spectroscopic characterization of single cells in interpretable IR absorption spectra comparable to conventional
mid-IR region in follow-up studies. IR spectroscopy techniques such as FTIR, a discussion about
advantages and disadvantages of FTIR microspectroscopy,
O-PTIR and AFM-IR has potential interest for scientists dealing
Results with the analysis of single cells.
Preliminary validation of spectral quality between the three
modalities: FTIR microspectroscopy, O-PTIR and AFM-IR Analysis of single, healthy RBC (control) by FTIR micro-
spectroscopy. All three methods discussed in this paper probe spectroscopy and O-PTIR spectroscopy. Typical (vibrational)
intrinsic molecular vibrational frequencies of chemical bonds spectrum of a biological sample contains several absorbance
present in a sample; these absorption bands are displayed as a bands associated with the main macromolecules, namely amide
function of wavenumber [cm−1]. However, as was mentioned in bands from proteins, membrane lipids (CHx stretching and
Materials and methods, the process of signal generation for each deformation), nucleic acids (phosphate stretches), carbohydrates
method varies immensely. (CO stretching) and phospholipids. The total biochemical com-
In FTIR spectroscopy, IR light passing through a molecular position (and therefore molecular signatures that are extracted by
material can be absorbed. Absorbance is given by the Beer-Lambert- spectroscopic techniques) of P. falciparum-infected RBCs (iRBCs)
Bouguer Law and is directly proportional to the molar concentration are bound to be different as a result of parasite development (for
of chemical species, molar absorptivity and path length. AFM-IR example, synthesis of Plasmodium specific proteins, hemoglobin
relies on rapid thermal expansion effect caused by laser pulses, which degradation, peptide and/or amino acid transportation, heme
have to be tuned to the absorption bands present in the sample. The biocrystalization, etc.12) and/or arising from metabolism (such as
signal measured for this method include not only information about iron deficiency, inflammation28). Hence, some spectral differ-
the concentration of chemical species, but also about thermal and ences are expected between infected RBCs and the healthy control
mechanical sample properties. The working principle of O-PTIR is cells. These differences can be manifested in shape changes, such
based on detecting the localized photothermal effects elicited by the as the occurrence of shoulder features in existing bands and/or
sample upon absorbing of infrared light. For O-PTIR and AFM-IR, peak shifts of the main absorbance bands in the collected spectra.
as long as the photothermal responses are linear at each sampling FTIR microspectroscopy was carried out using a FPA detector
location, the resulting spectra could be effectively normalized where (128 pixel × 128 pixel); a single pixel element defines a spot size of
the relative contributions of in thicknesses, thermal and mechanical 2.7 µm2, though the actual achievable spatial resolution is limited
properties are canceled out over the spectroscopic range. by the wavelength dependent Rayleigh criterion. With the
To prove the equivalence of these three methods for IR spectra microscope transmission mode configuration for the main lipids
collection, prior to comparison of the results obtained for individual peaks this is ~5 microns and up to ~15 microns in spatial
RBCs, the similarity of resultant spectra collected by means of FTIR resolution for the saccharide bands at around 1000 cm−1. A full
microspectroscopy, O-PTIR and AFM-IR was checked. For this field of view (345 × 345 µm2) is analyzed in one measurement, as
purpose, the microtomed section of a cured epoxy adhesive its dimension is related to the 15x magnification objective lens
(thickness of ~800 nm) placed on CaF2 was used as the reference. attached to the microscope, it cannot be changed.
COMMUNICATIONS CHEMISTRY | (2021)4:129 | https://doi.org/10.1038/s42004-021-00567-2 | www.nature.com/commschem 3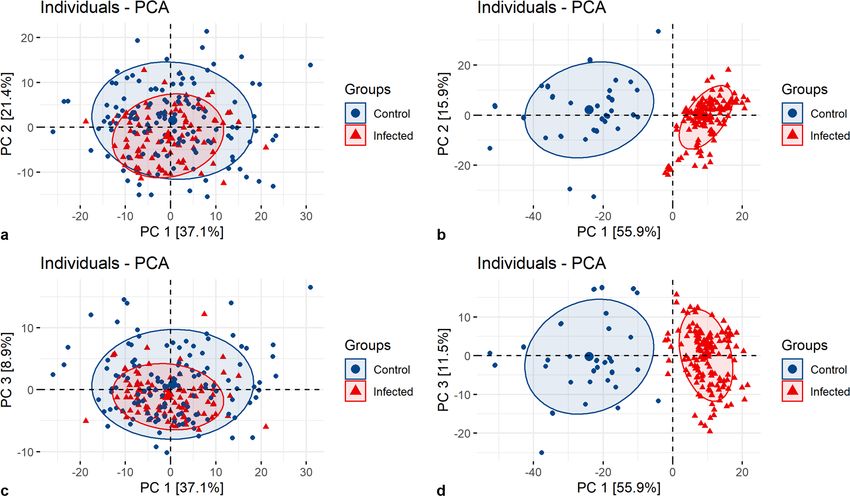
ARTICLE COMMUNICATIONS CHEMISTRY | https://doi.org/10.1038/s42004-021-00567-2
A single experiment using a FPA detector generates a would be providing an averaged biochemical information of the
hyperspectral object with 16,384 spectra. Each spectrum contains whole cell, lacking resolution to resolve domains smaller than the
information about all absorbance bands present in the sample. By diffraction-limited spatial resolution.
calculating the area under selected bands in the spectra, an image As a comparison, Fig. 2h shows six spectra taken with the step
of the spatial distribution for particular infrared absorption is 0.5 µm by means of O-PTIR spectroscopy from the region
created. This methodology is quite convenient, taking into marked in Fig. 2d, f. As can be seen five of the six spectra reveal
account that one experiment (taken within 32 min) can generate the biochemistry of the area smaller than the size of single
a complete range of spectra, which can be later used to obtain detector of FPA, but some obvious variations in the positions of
spectroscopic images for any selected wavenumber (simply by amide I and the intensities of other bands related to other cell
performing mathematical calculations). Many scientists rely on constituents are observed. Spectrum 6 was recorded 0.5 µm away
this label-free imaging capability, as it does not require the usage from the cell perimeter showing baseline spectral response from
of additional dyes; different chemical components are visualized the substrate. This is a remarkable photothermal infrared
based on inherent molecular vibrations arising from them. response providing direct evidence of the submicron spatial
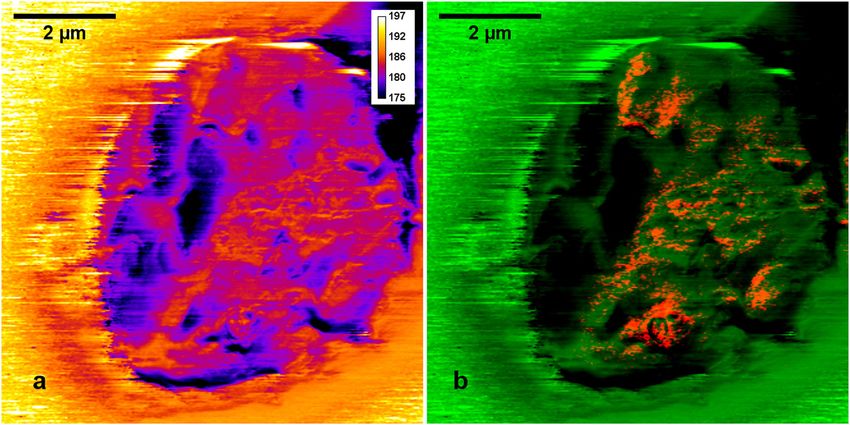
Figure 2a shows a screenshot from the OPUS software (provided resolution capability with O-PTIR spectroscopy.
with the Bruker instrument); as can be seen, the area selected for
experiment (red square) contains not only RBCs, but also
substrate material. In order to analyse only one selected RBC, Comparison of results collected for infected and control RBCs
digital zooming is needed. by means of FTIR microspectroscopy and O-PTIR spectro-
Amide I (C = O and C–N) at ~1650 cm−1 (Fig. 2c) and scopy. It is difficult to conclude whether lack or presence of
proteins/lipids (νCOO2 of fatty acids and amino acid side chains) visible differences among spectra collected for the same single cell
at ~1391 cm−1 (Fig. 2e) distributions are presented only for the (control RBC) can be treated as a general trend for all analyzed
zoomed area marked in Fig. 2a by a green square (additionally cells. Wider perspective is needed to determine an objective
single cell of interest is marked by a pink square).Values for conclusion about the generally observed similarities and differ-
amide I and proteins/lipids bands were obtained during post- ences among a larger set of infected and control sets of RBCs.
processing (integrals calculation under selected bands) of the Therefore, the following analysis was performed: 124 spectra
collected array of the spectra. collected from control and 97 spectra from infected RBCs (iRBCs
It is known that FTIR microspectroscopy provides an excellent —the trophozoite phase) for FTIR microspectroscopy, for
way to visualize the spatial distribution of cellular constituents O-PTIR spectroscopy, on the other hand, 64 spectra for control
(lipids, phospholipids, DNA, etc.)15,16,23. However, looking at the and 164 spectra for iRBCs were taken into account.
distribution of amide I and proteins/lipids (presented in Fig. 2c, e), Principal component analysis (PCA) was applied to reduce the
it is clear that the image lacks definition and little to no significant dimensionality of original variables space (wavenumbers) and
spectroscopic change is observed where the selected cell is present transform the source of variability in the data into the first few
(marked in Fig. 2a by pink square). variables (PCs). This analysis was done to recognize any
Figure 2d, f show results obtained during analysis of the same cell clustering pattern among studied spectra. All spectra were area-
using O-PTIR spectroscopy (Fig. 2b). To better compare FTIR and normalized and baseline corrected prior to PCA. Additionally,
O-PTIR results, hyperspectral data is discussed. The size of the PCA was performed on centered and scaled data.
hyperspectral object was set to 6 by 6 µm2 to completely cover the Bigger symbols in the scatterplots mark two-dimensional PCA
selected cell, 169 spectra were collected with a spacing of 0.5 µm in x centroids (or barycentres) that are mean scores for each class
and y directions. This set of parameters ensures taking full advantage (Control and Infected) for the first two principal axes.
of the wavenumber-independent sub-micron spatial resolution of the Shaded colored areas show the confidence ellipses around
O-PTIR technique. In Fig. 2d, f the distribution of amide I and group mean points (centroids). Each area represents a 95%
proteins/lipids may reveal detailed structural information within the confidence ellipse for a set of 2D normally distributed data
single cell, suggesting the biochemistry of this cell is not purely samples and allows visualizing a 2D confidence intervals.
homogenous as FTIR results points out. It is known that healthy In Fig. 3a, the PCA score plot (PC1 vs PC2) failed to separate
RBCs are devoid of a nucleus and other organelles typical of the control from the infected RBCs based on the spectra collected
eukaryotic cells. And above all, they have a bi-concave shape with by FTIR microspectroscopy. The first and the second component
thicker exterior and thinner interior parts, so protein and content (PC1, PC2) contribute to only 58.5% of data variance in total.
distribution within a healthy RBC cannot be uniform. Even if the third component (PC3), explaining 8.9% variances is
In vibrational spectroscopic measurements, spectra are the taken into account, it does not allow us to observe any grouping
most basic yet most informative component for studying or patterns (Fig. 3b). For the O-PTIR results, a clear division is
biochemical changes among samples. As previously discussed, perceived for the analyzed spectra, not only for PC1 vs PC2
the process of data collection varies significantly among FTIR and (Fig. 3b) but also for PC1 vs PC3 (Fig. 3d) plots. In Fig. 3b, d, PC1
O-PTIR spectroscopy, however their resultant spectra are (explaining 55.9% variances) is mostly responsible for this
equivalent and can be used to gain information about the outcome. It should be stressed that as PCA is one of the
biochemical constituents of the cells. unsupervised methods, different symbols and colors for control
Figure 2g depicts an example of three consecutive FTIR spectra and infected RBC subsets were chosen by us for better
taken from the points marked in Fig. 2c, e. Spectra 1 are 2 are visualization of PCA results.
quite similar, taking into account the intensity and position of the Comparison of the O-PTIR mean spectra collected for control
most prominent bands, but some subtle differences are notice- and infected RBCs with PC1 loading (Fig. 4a) suggests that the
able. For spectrum 3, the reduction in the intensities for the following regions can play an important role in observed
present bands is noticeable, probably recorded from the edge of clustering for O-PTIR measurements: 1664–1500 cm−1 (amide
the cell, as the diameter of the cell is less than 6 µm and the I and amide II), 1280–970 cm−1 (saccharides, DNA, and
nominal dimension of the single FPA detector is 2.7 µm. phospholipids), 1400–1330 cm−1 (lipids, proteins) and
Additionally, the spatial resolution of the mid-infrared is 1780–1690 cm−1 (lipids). Peaks in loading 1 studied in this work
wavenumber dependent and is typically in the range of 5 to do not resemble the actual spectra because, as was mentioned
20 µm per the Rayleigh criterion. Therefore, the said technique earlier, PCA was performed on scaled and centered data. It is
4 COMMUNICATIONS CHEMISTRY | (2021)4:129 | https://doi.org/10.1038/s42004-021-00567-2 | www.nature.com/commschem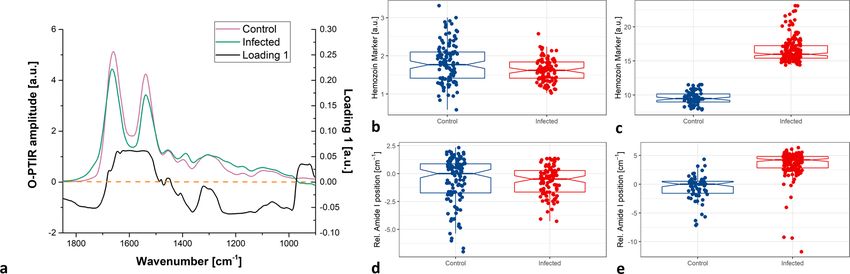
COMMUNICATIONS CHEMISTRY | https://doi.org/10.1038/s42004-021-00567-2                                                                    ARTICLE

Fig. 2 Comparison of results for single RBC (control) by FTIR microspectroscopy and O-PTIR spectroscopy. Screenshots showing the area selected for
FTIR microspectroscopy experiment (a), red square denotes the area being analyzed during one single FPA measurement (128 pixel × 128 pixel), small pink
square marks the position of a selected RBC; and O-PTIR (b), red square contains the area chosen for hyperspectral experiment (one single cell). Chemical
map reconstructed for amide I and proteins/lipids distributions by means of FTIR microspectroscopy (c, e), and O-PTIR spectroscopy (d, f). In Fig. 2c and e
only zoomed region displaying 13 × 13 of 128 × 128 single elements of FPA including cell of interest is presented (marked by pink square). Comparison of
spectra collected by means of FTIR microspectroscopy (g) and O-PTIR spectroscopy (h). Spectra were recorded from the points marked in c, e and d, f,
respectively. Distance between spectra is equal 2.7 μm for FTIR microspectroscopy and 0.5 μm for O-PTIR.

COMMUNICATIONS CHEMISTRY | (2021)4:129 | https://doi.org/10.1038/s42004-021-00567-2 | www.nature.com/commschem                                           5
ARTICLE                                                             COMMUNICATIONS CHEMISTRY | https://doi.org/10.1038/s42004-021-00567-2

Fig. 3 PCA on spectra collected for control and infected RBCs by FTIR microspectroscopy and O-PTIR spectroscopy. PCA score plot along PC1 & PC2
and PC1 & PC3 calculated for spectra collected for control and infected RBCs by means of FTIR microspectroscopy (a, c) and O-PTIR spectroscopy (b, d).

Fig. 4 Detailed analysis of spectra collected for control and infected RBCs by FTIR microspectroscopy and O-PTIR spectroscopy. Comparison of the
O-PTIR mean spectra collected for control and infected RBCs with PC1 loading (a). Boxplots of area calculated under the spectrum line within the region
1720–1708 cm−1 for each spectrum collected for control and infected RBCs by means of FTIR microspectroscopy (b) and O-PTIR (c). Boxplots of the
relative positions of the amide I bands in single spectra collected for control and infected RBCs by means of FTIR microspectroscopy (d) and O-PTIR (e).
The lower and upper hinges of the boxplots correspond to the first and third quartiles, middle line to the median value. The whiskers extend from the hinge
to the 1.5 * IQR (the distance between the first and third quartiles). The notches extend 1.58 * IQR / sqrt(n), this gives a roughly 95% confidence interval
for comparing medians.

critical to standardize the variables prior to PCA because it gives           studies28 revealed that hemozoin is similar to its synthetic analog
more weightage to those variables that have higher variances. In              β-hematin possessing bands at ~1720–1708 (strong), 1664
our case we want to ensure that the highest in the amplitude and              (strong), and 1220–1209 cm−1 (weak) related to H-bonded
in the variance amide I and amide II bands will not dominate the              carboxylate group, C = O, and C–O stretching vibration of
results of the analysis (PCA done on not-centered and not-scaled              propionate linkage, respectively.
data shows that 98.7% of variability is included in the first PC).                Searching for direct proof of hemozoin presence in the
   In our study, all iRBCs chosen for measurements were at the                collected spectroscopic spectra should not be focused only on
trophozoite stage. Based on literature12, this is the most                    the most prominent hemozoin band (C = O stretching), as its
biochemically and metabolically active stage where the large                  position at ~1664 cm−1 is overlapped with the strong amide I
amount of hemoglobin is digested by the parasite within DVs and               band and its presence is manifested only as a hump in the PC1
hemozoin known as a malaria pigment is produced. Spectroscopic                loading (Fig. 4a).

6                      COMMUNICATIONS CHEMISTRY | (2021)4:129 | https://doi.org/10.1038/s42004-021-00567-2 | www.nature.com/commschem
COMMUNICATIONS CHEMISTRY | https://doi.org/10.1038/s42004-021-00567-2                                                                  ARTICLE

   Another prominent band (H-bonded carboxylate group at                      parasite development undergo constant transformation, their size
1720–1708 cm−1) can be taken into account in that analysis (as is             varies from nanoscale (150–300 nm for mid-stage rings) through
also suggested by PC1 loading). Figure 4 shows values of the                  micron scale (2.2 µm for trophozoite) to submicron/micron scale
integrals calculated for every analyzed spectrum within the region            (0.8–1.2 µm for schizogony stage). So, if nanoscale resolution
1720–1708 cm−1 for FTIR microspectroscopy (Fig. 4b) and                       analysis is needed, AFM-IR spectroscopy could also be taken into
O-PTIR measurements (Fig. 4c). This value can help in                         account as a method to analyze individual iRBCs.
differentiating between spectra collected for control and infected
RBCs by means of only the O-PTIR technique (Fig. 4c).
   Strong negative band in PC1 loading within 1780–1690 cm−1                  Analysis of individual infected RBC by AFM-IR spectroscopy.
range, may point not only to a band directly related to hemozoin              To obtain chemical imaging in AFM-IR spectroscopy, the QCL
(1720–1708 cm−1), but also at stretching vibrations of C = O in               wavenumber was fixed at a value corresponding to the selected major
lipids (1750–1735 cm−1), which can contribute to its formation.               absorbance bands and the AFM-IR tip was scanned over the sample
   Analysis of amide I bands can also shed some light on                      (with the same step in x and y direction set to 25 nm, at 0.5 Hz scan
modifications in the secondary structure composition in the                    rate). Simultaneously, sample topography (Fig. 5a) and viscoelastic
iRBCs. This modification can be manifested by changes in band                  properties were also collected, giving a unique set of topographical,
amplitudes and shifts of its peak position. Looking at the                    chemical and mechanical sample details. Figure 5 depicts an example
individual positions of the amide I bands for both discussed                  of two selected iRBC band distributions: amide I (at ~1660 cm−1)
methods, again it can be concluded that a blueshift is mostly                 and stretching vibrations of C = O in lipids (at 1740 cm−1), which
visible in spectra collected by O-PTIR spectroscopy (Fig. 4e). The            can contribute to hemozoin formation. 1740 cm−1 was selected as a
shift can be a result of hemozoin presence (as its strong band is             way of detecting the presence of hemozoin traces; as in O-PTIR
observed at 1664 cm−1).                                                       experiments, in the average spectrum collected for iRBCs a hump
   Based on the presented results, we can conclude that sub-                  around 1740 cm−1 was evident.
micron resolution achieved by O-PTIR spectroscopy made it                        In Fig. 5b, c the IR intensity distributions are not homogeneous
possible to see the differences among control and infected RBCs.              and to some extent they correlate with the sample topography
   However, in our work only the cells at the trophozite stage                (collected as the height channel: Fig. 5a). This is understandable,
were studied. As mentioned earlier, DVs strongly related to                   due to the fact that the photothermal IR signal collected for every

Fig. 5 Analysis of individual infected RBC by AFM-IR spectroscopy. Contact mode AFM height image (a), distribution of amide I band (b) and stretching
vibrations of C = O in lipids (c) for selected iRBC. RGB-composite image (d), showing the AFM height (red) with distribution of amide I band (green) and
stretching vibrations of C = O in lipids (blue). AFM-IR spectra (e) collected at points 1-4 marked in the RGB- composite image (d).

COMMUNICATIONS CHEMISTRY | (2021)4:129 | https://doi.org/10.1038/s42004-021-00567-2 | www.nature.com/commschem                                        7
ARTICLE                                                            COMMUNICATIONS CHEMISTRY | https://doi.org/10.1038/s42004-021-00567-2

point should show contribution from the area beneath the AFM                    In the AFM-IR method, a sample’s thermal expansion due to
tip, or more precisely, from the tip-sample interaction volume.              IR absorption excites the cantilever oscillation of a certain
   We are aware that presenting only a single distribution of                amplitude and frequency. The eigenmodes of the cantilever are
selected bands is not very meaningful especially for a complex               related to the contact resonances24, where the peak frequencies of
sample; to collect AFM-IR chemical image only one wavenumber                 the cantilever oscillation depend on the elastic properties of the
is chosen, information about changes in its shape, shifts in                 sample: the stiffer the sample, the higher the contact resonance
position are neglected. However, these images can be very useful             frequency30.
in finding potentially interesting area to collect spectra that can be           As the probe scans across the sample surface, the contact
used for further analysis. As the spatial resolution for AFM-IR              resonance of the probe changes, due to the stiffness differences
(~40 nm) means that to cover the area 1 by 1 µm2, 625 spectra                between various sample components, differences in the contact
should be collected, knowing more precisely the region of interest           area and force interaction between the tip and the sample. To
for spectra collection is undoubtedly an advantage.                          collect meaningful data, measurements were done with PLL mode
   Figure 5d depicts the way of finding the most promising (from              (phase-locked loop) enabled. The phase signal from the lockin
the biological point of view) areas for the single spectra collection.       amplifier was fed to the PLL to track the contact resonance
Co-localization of sample topography with selected chemical                  frequency, hence all the nanomechanical information is mani-
distributions is presented as a RGB composite image (red channel             fested in the PLL frequency channel, as shown in Fig. 6a. The area
—topography, green channel—1660 cm−1 band, blue channel—                     corresponding to the iRBC appears to be softer than the
1740 cm−1 band). It is worth noticing that obtaining such kind of            surrounding substrate (CaF2 window).
composite image at this spatial resolution is impossible with other             Additionally, quite good correlation (presented in the RGB
available methodologies.                                                     image—Fig. 6b) between the distribution of the 1740 cm−1 band
   As indicated in Fig. 5c the amplitude of 1740 cm−1 band is                (in red channel) and the PLL frequency (in the green channel)
higher not only in the area surrounding the parasite (compared               was observed, pointing to the fact that the area with traces of
to a photo taken under a microscope), but also in another part               hemozoin are stiffer than the rest of the cell.
of the cell, which is in accordance with Jaramillo’s29 statement
that Plasmodium DNA and its hemozoin do not co-localize                      Conclusions
in iRBC.                                                                     In this paper, we compared three methods: FTIR microspectro-
   AFM-IR spectrum taken at point 1 (marked in the RGB                       scopy, O-PTIR, and AFM-IR spectroscopy that can be used for
image), where the distribution of 1740 cm−1 is dominant, testifies            the infrared single cell characterization—in our case—P. falci-
to a presence of hemozoin from noticeable hump at 1708 cm−1.                 parum-infected human RBCs. Potential advantages and limita-
Amide I band position is blue-shifted in comparison to amide I               tions of the mentioned methods prompted us to carry out these
position in spectra 2, 3 and 4. Amplitude of amide I is remarkably           experiments and to compare between them. Furthermore, if all
reduced, what can be related to hemoglobin digestion at point 1              three discussed techniques can deliver similar molecular infor-
[12]. For spectra 2 and 3 hump at 1740 cm−1 is still noticeable,             mation, our aim is to prioritize the most economical method in
however its amplitude is lower at point 4. Presented spectra                 terms of cost of consumables, manpower and ease of operations
(Fig. 5e) point on quite dynamic biochemistry also within the                and data processing.
regions assigned to nucleic acids (including the symmetric                      All techniques used in this work can provide quantitative
(~1080 cm−1) and antisymmetric (~1230 cm−1) phosphodiester                   distribution of bio-molecules such as DNA, carbohydrates, pro-
vibration) and amide III band (~1286 cm−1).                                  teins, lipids and in the case of P. falciparum, hemozoin. However,

Fig. 6 Co-mapping of local elastic properties with distribution of band characteristic for hematozoin presence in infected RBC. PLL frequency channel
recorded simultaneously during AFM-IR experiments (a), RGB composite image of PLL frequency (green channel) and 1740 cm−1 (red channel)
distributions (b).

8                      COMMUNICATIONS CHEMISTRY | (2021)4:129 | https://doi.org/10.1038/s42004-021-00567-2 | www.nature.com/commschem
COMMUNICATIONS CHEMISTRY | https://doi.org/10.1038/s42004-021-00567-2                                                                         ARTICLE

 Table 1 Practical advantages and disadvantages of the spectroscopic methods observed from our analysis of individual
 Plasmodium-infected RBCs.

                 FTIR microspectroscopy                       O-PTIR spectroscopy                                 AFM-IR
 Advantages    - Thousands of FTIR spectra are collected - Sub-micron resolution is suitable for analysis         - Nanometer resolution enables for very
                 in the timescale of min (16 384 spectra; 8     different area within single cell                   precise analysis of heterogenous small
                 cm−1 resolution, 1024 scans were             - 1 spectrum (20 scans) with effective spectral       object such as infected cell
                 collected in 32 min)                           resolution of 6 cm−1 was collected within         - 1 spectrum (16 scans) with effective
               - Source of IR (Globar or synchrotron            3 min                                               spectral resolution of 6 cm−1 is
                 radiation SR) emits with a power of          - Chemical visualization can be performed             collected within 3 min
                 ~80 μW over the whole spectral range           with sub-micron resolution; tiny structures       - Chemical visualization can be
                                                                within the sample can be easily presented           performed with nanometer resolution;
                                                              - Collected spectra are free from spectral            miniscule structures within the sample
                                                                artifacts (e.g., Mie Scattering)                    can be easily presented
                                                              - Depending on the size and resolution of
                                                                collected images; usually few minutes
                                                                are needed
 Disadvantages - Presence of artifacts like Mie scattering in - Setting the proper power levels of IR and         - Time-consuming adjustments and
                 collected spectra                              green (probe) light is needed prior to              optimization of the system
               - Diffraction-limited spatial resolution not     experiments (in our experiments, power of         - Setting the proper power levels of IR is
                 suitable to analyse objects smaller than       approximately 1–5 mW per spectrum was               needed prior to experiments (in our
                 5–15 µm; especially for single cell analysis   needed).                                            experiments, 0.2–1 mW per spectrum
               - Extremely large volumes of data              - Chemical visualization is done for one              was needed).
                 generated                                      wavenumber at a time during one                   - Chemical visualization is done for one
                 and associated with chemical images (in        experiment; the process could be automated          wavenumber
                 the order of gigabytes of data per hour)                                                         at a time; the process could be
               - Cryogenic cooling (liquid nitrogen) of the                                                       automated
                 detectors; must be done by trained                                                               - Depending on the size—only one cell
                 personnel                                                                                          can be analyzed in reasonable time;
                                                                                                                    usually tens of minutes are needed
                                                                                                                  - In contact mode operation, special
                                                                                                                    attention must be paid to avoid
                                                                                                                    sample damage
                                                                                                                  - Consumables: relatively expensive and
                                                                                                                    exclusive AFM-IR designed tips are
                                                                                                                    required for the experiments

there are essential factors (summarized in Table 1) which deter-              open new avenues for non-invasive monitoring of biochemical
mine the method’s suitability for the analysis of the biochemical             processes occurring within single cells.
landscape of single cells.
   Our investigation started with the analysis of single, healthy
RBCs (control) as they are well characterized in terms of mor-                Methods
                                                                              All spectroscopic/imaging experiments were performed at the branch of the
phology and composition. Measurements done by FTIR micro-                     upgraded ISMI beamline (at the Singapore Synchrotron Light Source, National
spectroscopy and O-PTIR spectroscopy show that only O-PTIR is                 University of Singapore) by means of:
able to reveal spectroscopic differences between the center vs. the              1. Hyperion 3000 (IR microscope) equipped with FPA detector (128 pixels by
periphery part of the single, healthy cell (Fig. 2). PCA performed                  128 pixels) attached to Vertex 80 v (both Bruker) spectrometer – for FTIR
on spectra collected for the control and infected RBCs presented                    microspectroscopy,
in this work, demonstrates that FTIR microspectroscopy cannot                    2. mIRage microscope produced by the Photothermal Spectroscopy Corp
                                                                                    (PSC) – for the O-PTIR sub-micron IR characterization,
separate these two groups. Clear differentiation is perceived for                3. nanoIR3 system produced by Bruker Nano – for nanoscale AFM-IR
the spectra obtained by O-PTIR. This suggests that submicron                        absorption spectroscopy.
resolution is indeed required if local biochemical variability
within single cell must be checked.
   In order to explore sub-cellular structures (especially those in           Preparation of Plasmodium-infected blood samples. 3D7 strain of P. falciparum
nanometer scale range), on the other hand, AFM-IR seems to be                 parasites grown in human blood (purchased from Interstate Blood Bank, USA)
valuable and irreplaceable tool providing deeper insight into                 were used in all experiments, in agreement with approved protocols of Singapore
                                                                              University of Technology and Design. Synchrony of the cultures was achieved by
chemical and viscoelastic properties with spatial resolution                  frequent selection of ring-stage infections using sorbitol treatment. Trophozoite
superior to any other techniques.                                             stage parasites (~30 hours post-invasion) were used in all experiments reported in
   Based on the presented results, we conclude that O-PTIR and                this work.
AFM-IR spectroscopies are preferred choices for analyzing                         Infected RBCs (around 5% parasitemia) were washed once in 1X PBS followed
                                                                              by fixation in 2% paraformaldehyde PFA for 15 min. Fixed cells were smeared on
complex samples, such as Plasmodium-infected blood cells,                     CaF2 windows (Crystran, UK) and air-dried for further use. Samples were first
offering chemical information pertinent to a heterogeneous                    examined under a 4x (NA 0.1), 10x (NA 0.25) and 40x (NA 0.65) objective lens
environment within a single cell.                                             (Leica DM750) and microscopic images were captured with a Leica ICC50W digital
   The sub-micron and nanometer-resolution offered by these                   camera. Since the smears were not stained, the infected cells were recognized based
                                                                              on the typical black hemozoin dots of trophozoite stage parasites. Infected cells
techniques make them ideal modalities for better understanding                were selected and labeled from high contrast 40x microscopic images and the
of malaria pathophysiology, where sample availability is limited              corresponding 10x and 4x images. Further scans by FTIR, O-PTIR or AFM-IR
as it is in the case of P. vivax infections. These techniques thus            were focused on selected cells.

COMMUNICATIONS CHEMISTRY | (2021)4:129 | https://doi.org/10.1038/s42004-021-00567-2 | www.nature.com/commschem                                                 9
ARTICLE COMMUNICATIONS CHEMISTRY | https://doi.org/10.1038/s42004-021-00567-2
Details of the experiments FTIR microspectroscopy. Analysis of RBCs was used for data (spectra and single wavenumber images) collection, which were saved
performed using FTIR microspectroscopy in transmission mode with a Bruker and processed in PTIR Studio 4.0 software supplied with the instrument.
Hyperion 3000 IR microscope with a FPA detector attached to the Vertex 80 v Samples (RBCs on CaF2 disks) to be analyzed were placed on the automated
spectrometer. Since cells were placed on a CaF2 window, a location adjacent to the scanning stage in the sample chamber; the entire instrument was purged with dry
sample at a clear, clean spot on that window was used for background signal nitrogen during all experiments in order to eliminate water vapor absorption.
collection. Apart from single spectra taken from chosen areas within the selected cells,
An IR objective lens with 15× magnification was used that provides a pixel size images for particular wavenumbers and hyperspectral data were also collected.
equal to 2.7 μm2 (with 128 by 128 pixels in each direction of the FPA detector). The The hyperspectral approach is very similar to chemical mapping experiments
number of co-added scans were tested in order to ensure sufficient signal-to-noise performed by a conventional IR microscope with a single-element detector, where
ratio. 1024 scans provided a balance between good quality spectra within a the aperture size and the region of interest are selected by horizontal and vertical
reasonable amount of time (32 mins). slits. Steps in the x and y axis are set and raster scanning is carried out (a single
A spectral range of 3845 to 900 cm−1 was set with a spectral resolution of 8 cm−1. spectrum is collected from one point, then the sample is moved to the next point
The zero filling factor was set to 2 and a Blackman-Harris 3-Term apodization where next spectrum is taken).
function with phase resolution of 32 and power phase correction mode was selected In O-PTIR spectroscopy, there is no aperture to be set, the size of the
for converting measured interferograms to final spectra. hyperspectral object, its spacing in the x and y direction is selected by the analyst. A
From a single experiment, 16,384 spectra were collected from an area of hyperspectral experiment is performed automatically, prior to every single
approximately 345 × 345 µm2. spectrum collection the autofocus function selects the best position in z direction
for an analyzed spot for the highest amplitude of reflection signal at a given
wavenumber, e.g., 1452 cm−1.
Sub-micron IR characterization (O-PTIR). O-PTIR sub-micron IR character-
ization was carried out using a mIRage microscope (PSC, USA). As a source of IR
radiation, a tuneable, pulsed mid–IR Quantum Cascade Laser (QCL) was used,
operating with 300 ns pulses at a repetition rate of up to 100 kHz. The selected area Nanoscale IR Characterization (AFM-IR experiments). A CaF2 window with
within the sample was illuminated, which caused small photothermal perturbations RBCs fixed on it, was mounted on a steel holder and analyzed within the
in the form of rapid conversion of photon energy into heat, lasting for a few 1800 − 900 cm−1 spectral range with a resolution of about 6 cm−1 (spectral point
microseconds31. These perturbations can be probed by a green (532 nm) laser, the density equal to 2 cm−1) by means of the nanoIR3 instrument (Bruker Nano,
position of which was co-located with the IR light. Here, the visible probe beam USA); Analysis Studio 3.16 provided with the instrument was used to collect all
detects localized reflectivity changes on the sample surface, hence O-PTIR’s sen- experimental data. The same QCL laser (described earlier) was used as the source
sitivity was applicable only to the materials’ IR absorptivity at a given wavenumber. of IR. All the measurements were performed using a gold-coated AFM tip with an
The laser power levels of the IR and probe were each set to approximately 1–5 mW apex of nominal curvature radius of sub-30 nm (Anasys Instruments, USA). The
per spectrum (wavelength dependent). O-PTIR measurements were done in a non- cantilever had a nominal spring constant of 0.07−0.4 N/m and a resonance fre-
contact reflection mode while providing FTIR transmission-like infrared spectra quency of 13 ± 4 kHz, while in a “free-state.” Rapid laser pulses (QCL) tuned to a
that were artifact-free (without Mie scattering and other effects). Available at the corresponding absorption bands occurring in the samples, caused rapid thermal
ISMI beamline, QCL comprises 4 chips and enables spectra collection within the expansions thereby resulting in an oscillation of the AFM tip placed in contact with
mid-IR fingerprint region of 1800–900 cm−1. The number of co-added scans per the material. The obtained spectrum was the amplitude of the cantilever oscillation,
spectrum was 20 to maintain a good signal to noise ratio. The effective spectral which is proportional to the absorption coefficient of the sample at different
resolution was approximately 6 cm−1 (with 2 cm−1 data point spacing). wavenumber values after normalizing against the background24.
The spatial resolution in the O-PTIR method is dependent on the spot size of Prior to experiments, the nanoIR3 system was calibrated and optimized using
the short wavelength green laser. During experiments, its size was maintained a test sample (the same as for O-PTIR technique) provided by the manufacturer.
below 1 µm to achieve submicron spatial resolution. The background was collected to compensate the input from the atmospheric
The background signal, by means of measuring photothermal perturbations gases and to take into account the power distribution of the IR laser delivered on
returned from a reflective surface, was recorded to take into account the influence the sample.
of the IR laser power distribution on the final spectrum. Before collecting O-PTIR For nanoscale IR data collection, the instrument is operated in resonance
spectra from all samples, the system was wavenumber-calibrated using a enhanced AFM-IR mode where the laser pulse repetition rate is synced to the 2nd
manufacturer-supplied test sample composed of a cross-section of PMMA and PS eigenmode of the cantilever contact resonance. This cantilever oscillation signal is
beads for the 1732 cm−1 and 1601 cm−1 bands. detected in the position sensitive photodetector (PSPD) of the AFM and fed to an
Prior to sample analysis, microscopic images of cells were collected with internal lock-in amplifier to extract the demodulated amplitude signal proportional
different objectives: low magnification visible (refractive objective lens) 10x, 0.3NA to IR absorption. For each spectrum, 16 scans were co-averaged. For chemical
(working distance of about 15 mm) and high magnification (reflective Cassegrain imaging, the scanning was performed with 400 points in the x and 400 points in the
objective lens) 40x, 0.78NA (working distance of about 8 mm). The latter was also y direction at 0.5 Hz scan rate.
Table 2 Summary of all spectroscopic experiments performed on Plasmodium-infected RBC samples.
Method FTIR microspectroscopy (Hyperion 3000) O-PTIR (mIRage) AFM – IR (nanoIR3)
Spectral range 3845 to 900 cm−1 1800−900 cm−1 1800−900 cm−1
Spatial resolution IR wavelength dependent; theoretical limit canCOMMUNICATIONS CHEMISTRY | https://doi.org/10.1038/s42004-021-00567-2 ARTICLE
With all IR absorption images (for selected wavenumbers), not only AFM 21. Bannister, L. H., Hopkins, J. M., Margos, G., Dluzewski, A. R. & Mitchell, G. H.
images (height signal) were simultaneously recorded for the same regions of Three-dimensional ultrastructure of the ring stage of Plasmodium falciparum:
interest in order to gain information regarding the topography of the sample, but Evidence for export pathways. Microsc. Microanal. 10, 551–562 (2004).
also the contact resonance frequency of the cantilever using the Phase Locked Loop 22. Dluzewski, A. R. et al. Formation of the food vacuole in Plasmodium
(PLL) functionality to gain insight into the nanomechanical sample properties. falciparunrss: a potential role for the 19 kDa fragment of merozoite surface
As described earlier, these methods provide the unique opportunity to analyse protein 1 (MSP119). PLoS ONE 3, e3085. https://doi.org/10.1371/
exactly the same sample as all these methods can be treated as non-destructive; journal.pone.0003085 (2008).
after every experiment the specimen was left in pristine condition. 23. Jackson, K. E. et al. Food vacuole-associated lipid bodies and heterogeneous
Table 2 presents the summary of experiments carried out on single RBC by lipid environments in the malaria parasite, Plasmodium falciparum. Mol.
means of three modalities discussed earlier. Microbiol. 54, 109–122 (2004).
24. Dazzi, A. & Prater, C. B. AFM-IR: Technology and applications in nanoscale
Reporting summary. Further information on research design is available in the Nature infrared spectroscopy and chemical imaging. Chem. Rev. 117, 5146–5173
Research Reporting Summary linked to this article. (2017).
25. Ruggeri, F. S. et al. Identification of oxidative stress in red blood cells with
nanoscale chemical resolution by infrared nanospectroscopy. Int. J. Mol. Sci.
Data availability 19, 1–15 (2018).
The datasets generated during the current study are available from the corresponding 26. Perez-Guaita, D. et al. Multispectral atomic force microscopy-infrared nano-
author on reasonable request. imaging of malaria infected red blood cells. Anal. Chem. 90, 3140–3148
(2018).
Received: 3 March 2021; Accepted: 11 August 2021; 27. Kansiz, M. et al. Optical photothermal infrared microspectroscopy with
simultaneous Raman – a new non-contact failure analysis technique for
identification ofARTICLE COMMUNICATIONS CHEMISTRY | https://doi.org/10.1038/s42004-021-00567-2
Open Access This article is licensed under a Creative Commons
Attribution 4.0 International License, which permits use, sharing,
adaptation, distribution and reproduction in any medium or format, as long as you give
appropriate credit to the original author(s) and the source, provide a link to the Creative
Commons license, and indicate if changes were made. The images or other third party
material in this article are included in the article’s Creative Commons license, unless
indicated otherwise in a credit line to the material. If material is not included in the
article’s Creative Commons license and your intended use is not permitted by statutory
regulation or exceeds the permitted use, you will need to obtain permission directly from
the copyright holder. To view a copy of this license, visit http://creativecommons.org/
licenses/by/4.0/.
© The Author(s) 2021
12 COMMUNICATIONS CHEMISTRY | (2021)4:129 | https://doi.org/10.1038/s42004-021-00567-2 | www.nature.com/commschemYou can also read