CNN for User Activity Detection Using Encrypted In-App Mobile Data
←
→
Page content transcription
If your browser does not render page correctly, please read the page content below
future internet

Review
CNN for User Activity Detection Using Encrypted In-App
Mobile Data
Madushi H. Pathmaperuma, Yogachandran Rahulamathavan, Safak Dogan *                                   and Ahmet Kondoz

                                          Institute for Digital Technologies, Loughborough University London, London E20 3BS, UK;
                                          o.m.h.pathmaperuma@lboro.ac.uk (M.H.P.); y.rahulamathavan@lboro.ac.uk (Y.R.); a.kondoz@lboro.ac.uk (A.K.)
                                          * Correspondence: s.dogan@lboro.ac.uk

                                          Abstract: In this study, a simple yet effective framework is proposed to characterize fine-grained
                                          in-app user activities performed on mobile applications using a convolutional neural network (CNN).
                                          The proposed framework uses a time window-based approach to split the activity’s encrypted traffic
                                          flow into segments, so that in-app activities can be identified just by observing only a part of the
                                          activity-related encrypted traffic. In this study, matrices were constructed for each encrypted traffic
                                          flow segment. These matrices acted as input into the CNN model, allowing it to learn to differentiate
                                          previously trained (known) and previously untrained (unknown) in-app activities as well as the
                                          known in-app activity type. The proposed method extracts and selects salient features for encrypted
                                          traffic classification. This is the first-known approach proposing to filter unknown traffic with an
                                          average accuracy of 88%. Once the unknown traffic is filtered, the classification accuracy of our model
                                          would be 92%.

                                          Keywords: encrypted traffic classification; network analysis; mobile data; network traffic to image


Citation: Pathmaperuma, M.H.;             1. Introduction
Rahulamathavan, Y.; Dogan, S.;
                                                In recent years, traffic classification has attracted increasing attention, as it is used in
Kondoz, A. CNN for User Activity
                                          network management, security, advertising, network design, and engineering. Network
Detection Using Encrypted In-App
                                          traffic classification involves analyzing traffic flows and identifying the type of content
Mobile Data. Future Internet 2022, 14,
                                          within these flows. In network traffic analysis, a network trace of a device or a group of
67. https://doi.org/10.3390/
                                          devices is taken as input and, as output, information about those devices, their users, their
fi14020067
                                          apps, or in-app activities is given. Network traffic classification has many possibilities to
Academic Editor: Christoph Stach          solve personal, business, internet service provider, and government network problems
Received: 17 December 2021
                                          such as anomaly detection, quality of service control, application performance, capacity
Accepted: 15 February 2022
                                          planning, traffic engineering, trend analysis, interception, and intrusion detection. To
Published: 21 February 2022
                                          date, several traffic classifications approaches have been proposed and developed. These
                                          methods have evolved significantly over time from port-based, deep packet inspection (DPI)
Publisher’s Note: MDPI stays neutral
                                          to machine learning (ML) methods [1]. The use of dynamic port-negotiation mechanisms
with regard to jurisdictional claims in
                                          by applications has made port-based methods no longer suitable. An increase in the use
published maps and institutional affil-
                                          of encrypted internet traffic and privacy policies that prevent access to packet content
iations.
                                          have rendered relying on a packet’s payload or DPI no longer effective. Most research
                                          activities that perform encrypted traffic classification rely on extracting statistical features
                                          from traffic flows, which is followed by performing feature selection to eliminate irrelevant
Copyright: © 2022 by the authors.
                                          and redundant features. They then use classical machine learning algorithms, such as
Licensee MDPI, Basel, Switzerland.        random forest (RF) [2,3], Bayes net [4], K-nearest neighbors (KNNs), and support vector
This article is an open access article    machine (SVM) [5] to perform the classification. These methods can handle both encrypted
distributed under the terms and           and unencrypted traffic. However, the performance of these methods greatly relies on
conditions of the Creative Commons        human-engineered features, which limit their generalizability [1].
Attribution (CC BY) license (https://           CNNs, an important model of deep learning (DL), were initially applied in the field of
creativecommons.org/licenses/by/          image recognition [6] and achieved remarkable results. With the advances in DL, the use of
4.0/).                                    CNNs has become prevalent in many fields such as speech recognition, audio processing,

Future Internet 2022, 14, 67. https://doi.org/10.3390/fi14020067                                     https://www.mdpi.com/journal/futureinternet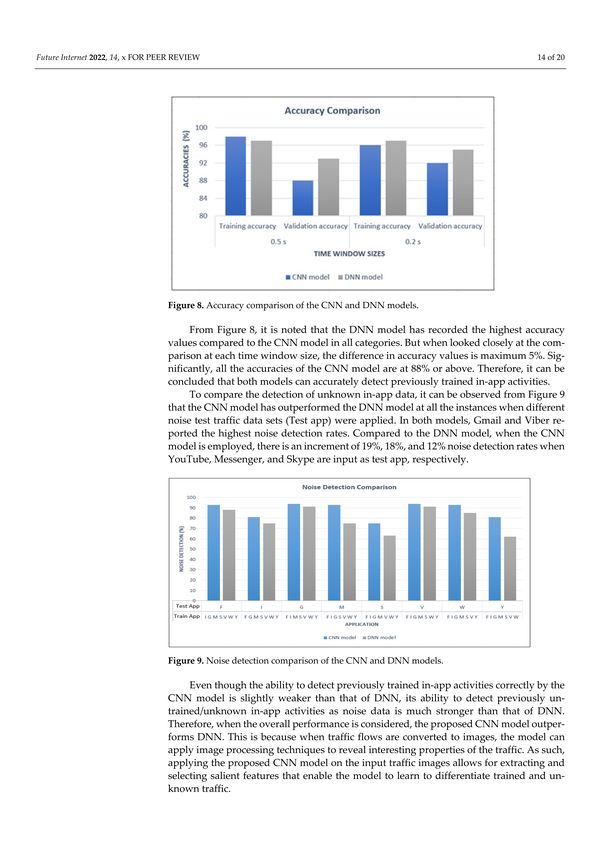
Future Internet 2022, 14, 67                                                                                               2 of 18

                               visual document analysis, genomics, and in medical use [7]. Yet, it has not been sufficiently
                               utilized in network traffic classification [6]. This paper proposes an image-based method
                               that represents network traffic as images and utilizes DL architecture based on CNNs to
                               learn the traffic features in these images and perform traffic classification. This research
                               focused on conducting network traffic classification to identify user activities performed
                               on mobile applications (known as in-app activities) from a sniffed encrypted internet traffic
                               stream. Figure 1 shows the generated images using encrypted in-app activity data for three
                               different in-app activities. The main advantage of using a CNN in image classification is
                               that there is no need to extract features beforehand, because the CNN model can learn
                               features by itself.

                               Figure 1. Grayscale images generated from the encrypted in-app activity data.

                                    In this research, sensitive information related to online users, such as the activities
                               performed with their mobile apps, are inferred by passively sniffing encrypted wireless
                               network traffic. Even though encryption protocols are used to encrypt data, it protects only
                               the packet’s payload, but it does not hide side channel data such as frame length, data length,
                               inter arrival time, and direction (incoming/outgoing). Therefore, in this research, the side
                               channel data were used to reveal private information related to the user’s online behavior.
                               Users perform different activities using the apps installed on their mobile devices. Each
                               in-app activity has a distinct network behavior [8] and, thus, generates different traffic
                               flows. Traffic flow data are converted into images and image classification deep learning
                               techniques are used to detect in-app activities.
                                    The contributions of this paper are summarized as follows:
                               (a)   Unknown app data detection: A wide range of apps are available in app stores. It is
                                     not practical to train a machine learning model for such a wide variety of apps and
                                     for every in-app activity that can be performed using those apps. When deploying an
                                     in-app activity detection model in a real network, the model needs to correctly detect
                                     applications and in-app activities while earmarking previously untrained activities
                                     as unknown traffic. Most existing works in the literature involve model training and
                                     testing on the same set of apps, which renders them unfit for detecting previously
                                     unknown traffic. The proposed model in our work was designed to conduct network
                                     traffic analyses effectively, even in the presence of noise generated by unknown traffic;
                               (b)   Activity detection using minimal data: When network traffic is captured to detect
                                     in-app activities, there can be instances when an eavesdropper captures only part of
                                     the activity-related traffic instead of the entire transaction, as the target user’s activity
                                     may have been underway already. The proposed model was designed to identify
                                     in-app activities even by observing a subset of an activity’s traffic;
                               (c)   Fine-grain in-app activity detection: Works in the literature have considered coarse-
                                     grained activities such as uploading, chatting, downloading, or generic activities,
                                     including sending an email, messaging on Messenger, and posting on Instagram.
                                     Our work advances this existing body of work by designing the model to identify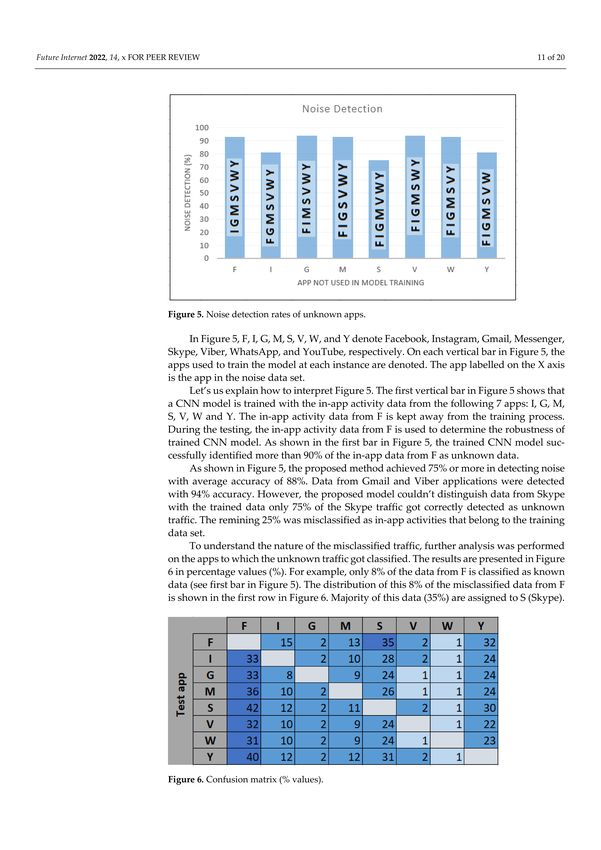
Future Internet 2022, 14, 67                                                                                              3 of 18

                                     fine-grained in-app activities. For example, when a generic Facebook activity “posting
                                     on wall” is considered, the model can determine whether the post is an image, a
                                     long text, a short text, a video, or a check-in. This level of fine-grained analysis is
                                     challenging, as classification is performed in an encrypted domain using only side
                                     channel data;
                               (d)   Novel data set for future research: A comprehensive data set was created by perform-
                                     ing a series of actions on eight apps, namely, Facebook, Instagram, WhatsApp, Viber,
                                     Messenger, Gmail, Skype, and YouTube. This data set will be shared openly with
                                     the research community to foster new studies and allow reproduction of the results
                                     presented. (https://www.dropbox.com/s/9tihcj9wx2sia1t/Dataset.7z?dl=0 (accessed
                                     on 4 October 2021))
                                    The rest of this paper is organized as follows: In Section 2, the related work is reviewed.
                               Section 3 describes the methodology of the proposed classification system. Section 4
                               presents the experimental results and discussions. Section 5 provides concluding remarks.

                               2. Related Work
                                     In the literature, two types of research methods have dominated traffic classification:
                               statistical methods and neural networks.
                                     Statistical classification is a technique that exploits the statistical characteristics of
                               network traffic flow to perform traffic classification. Features, such as packet length, packet
                               duration, packet inter-arrival time, and traffic flow idle time, are used in this method. To
                               perform an actual classification based on statistical features, classifiers, specifically ML algo-
                               rithms, are used. Conti et al. [9] performed mobile user actions classification based on packet
                               sizes and their order. Saltaformaggio et al. [5] developed NetScope to detect user activities
                               based on inspecting statistical features obtained from internet protocol (IP) headers. Taylor
                               et al. [2,10] used features, such as packet lengths and statistical properties of flows, to train
                               support vector classifier (SVCs) and random forest classifiers to perform mobile app classi-
                               fication. Pathmaperuma et al. [4] identified user activities performed on mobile apps using
                               statistical features generated from frame length, inter-arrival time, and direction leaked
                               from encrypted traffic. Wang et al. [3] computed 20 statistical features from frame size and
                               inter-arrival time to train an RF classifier to perform app identification. Zhang et al. [11]
                               proposed a scheme by combining supervised and unsupervised machine learning tech-
                               niques to classify apps. Twenty unidirectional flow statistical features related to packet size,
                               packets, inter-packet time, and bytes were extracted and used to train the proposed classi-
                               fier. A classification method was proposed by Draper-Gil et al. [12] with only time-related
                               flow features on both regular encrypted traffic and protocol encapsulated traffic.
                                     Many works have applied neural networks in network traffic analysis such as malware
                               classification [13], anomaly detection [14], DDoS attacks detection [15], and intrusion
                               detection [16,17]. In [18], Wang et al. proposed an end-to-end encrypted traffic classification
                               approach with 1D CNN to detect traffic types such as streaming, VoIP, and file transfer.
                               Lopez-Martin et al. [19] proposed using a recurrent neural network (RNN) combined with
                               a CNN for IoT traffic classification. In [20], Aceto et al. performed traffic classification in
                               encrypted network flow using DL techniques. Wang [21] proposed a stacked auto encoder
                               (SAE)-based method to detect network protocols. The results showed that Wang’s approach
                               worked well on the applications of feature learning, protocol classification, anomalous
                               protocol detection, and unknown protocol identification. In [22], Lotfollahi et al. proposed
                               a framework to perform traffic characterization and application identification using DL,
                               embedding an SAE and CNN to classify network traffic.
                                     Recent studies have explored the use of CNNs to perform classification by converting
                               network traffic flows into images. Wang et al. [13] converted traffic to 2D images and then
                               applied 2D CNN to classify the traffic images achieving the goal of malware classification.
                               Ma et al. [8] proposed a CNN model that predicts large-scale, network-wide traffic speed.
                               In this work, spatiotemporal traffic dynamics were converted to images describing the time
                               and space relations of traffic flow via a 2D time–space matrix. Zhou et al. [6] proposed a
Future Internet 2022, 14, 67 4 of 18
classification algorithm Min–Max Normalization (MMN) CNN that processes traffic data
and maps them into gray images that are input into a CNN to detect 12 types of traffic cate-
gories such as mail, game, and multimedia. Tavakoli [23] presented the Seq2Image method
to perform human genomic sequence classification converting genome sequences to images
and then using a 2D CNN to classify the created images of sequences. Shapira et al. [7]
presented the FlowPic approach to transform flow data into an image and then used image
classification DL techniques, a CNN, to identify the flow category and application in use.
Kim et al. [24–26] presented the NetViewer approach that detects and visualizes attacks and
anomalous traffic by passively monitoring packet headers. In these works, multiple pieces
of traffic data are represented as different colors of an image. Image processing techniques
are applied to generated images to analyze the network traffic. He et al. [27] proposed an
image-based method that converts the first few non-zero payload sizes of session to gray
images and uses a 1D CNN to perform the classification.
The works in the literature primarily focus on classifying previously trained traffic,
while none has considered performing network traffic analysis accurately in the presence
of noise generated by unknown traffic, even though this would be a typical situation in a
real-world scenario. Thus, this work aimed to advance the state-of-the-art by identifying
previously trained fine-grained in-app activities accurately as well as by detecting and
classifying previously untrained in-app activities as unknown data.
To detect unknown in-app activities, the function needs to reject the classification
label for those inputs belonging to classes never exposed during training. An output-
based rejection technique is proposed in this work that leverages additional information
from the deep learning model output such as the SoftMax probabilities of each class.
Usually in classification tasks, the neuron with the highest probability will be chosen and
the corresponding class label is assigned. In this work, a two-stage approach was used
to check if the neuron with the highest probability satisfied a pre-set threshold value.
Based on this, the known and unknown instances were classified. However, setting this
threshold is challenging, as setting it too high increases false negatives, whereas setting it
too low increases false positives. To test the impact of the threshold value on the model’s
performance, a range of threshold values were selected, and tests were performed.
3. Proposed Methodology
This paper proposes a CNN-based method that transfers network traffic flows into
images to identify in-app activities while detecting unknown data. The method contains
two main procedures. The first is to convert network traffic into images that represent side
channel data of a network flow as a 2D image. The second is to apply image classification
DL techniques to the generated images and perform traffic classification of previously
trained and untrained apps’ traffic flows.
3.1. Data Collection
For this research, a data set was created that consisted of network traffic from in-app
activities of eight popular mobile apps, namely, Facebook, Instagram, YouTube, Viber,
WhatsApp, Gmail, Skype, and Messenger. To obtain the ground truth, network traffic
generated after executing each activity was collected separately, and the network trace
was labeled with the name of the activity performed. Each app was run separately, thus
limiting the presence of background traffic. To generate a sufficient number of traffic flows
for inference, each activity was repeated four times and captured traffic was saved as
.pcap files. The number of in-app activities considered in each app and number of samples
obtained after segmenting the traffic into 1, 0.5, 0.2, and 0.1 s time intervals are presented
in Table 1. The 92 in-app activities considered in this research are given in Appendix A.
We monitored the network passively and traffic was captured without connecting to
the wireless network to which the target user’s mobile device was connected. The traffic
transmitting within the wireless network was sniffed using Airmon-ng and Airodump-ng
sniffing tools from the Aircrack-ng suite [28]. Default setting of network adapters allowFuture Internet 2022, 14, 67 5 of 18
only to capture packets that are sent to them. To capture all traffic, we set the network
adapter to its monitor mode. The experimental testbed used to sniff traffic is shown in
Figure 2. The internet access to the smartphone was provided over a wireless connection
via a router. The smartphone was connected to the wireless network exclusively to avoid
interference from other sources. The network adapter (Alfa AWUS036NHA) was plugged
to the laptop (Toshiba PORTEGE Z30-C), which was used to capture the network traffic.
Table 1. Features of the collected data set.
No. of in-App Number of Samples
App Category
Activities 1s 0.5 s 0.2 s 0.1 s
Social net-
Facebook 22 9477 19,944 55,283 110,588
working
Photo and
Instagram 20 2907 6818 25,529 81,505
video
Gmail Productivity 5 561 1036 2361 5514
Social net-
Messenger 10 2199 6061 18,514 43,113
working
Social net-
Skype 8 5436 15,703 69,884 211,981
working
Social net-
Viber 9 434 690 1207 1875
working
Social net-
WhatsApp 9 273 436 873 1458
working
Photo and
YouTube 9 5161 14,501 58,173 207,013
video
Total 8 apps 92 26,448 65,189 231,824 663,047
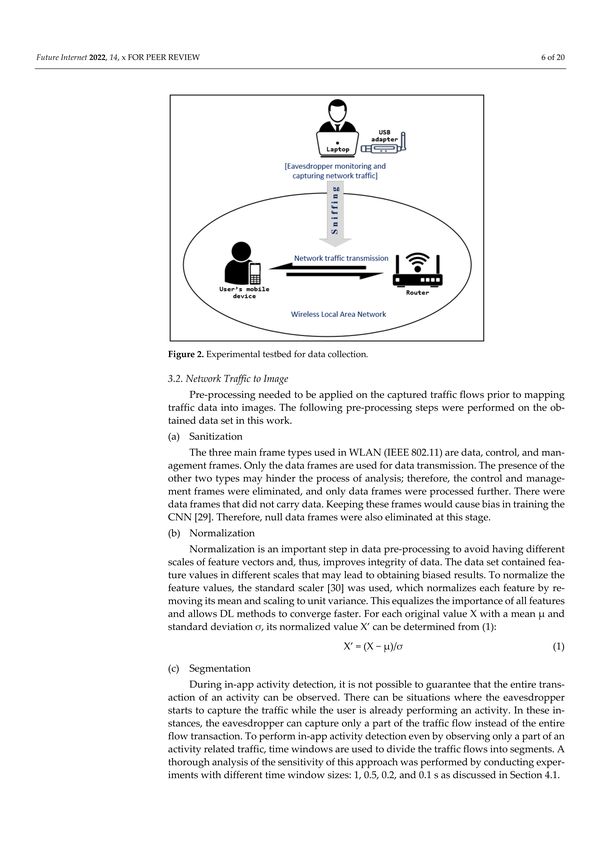
Figure 2. Experimental testbed for data collection.Future Internet 2022, 14, 67 6 of 18
3.2. Network Traffic to Image
Pre-processing needed to be applied on the captured traffic flows prior to mapping
traffic data into images. The following pre-processing steps were performed on the obtained
data set in this work.
(a) Sanitization
The three main frame types used in WLAN (IEEE 802.11) are data, control, and
management frames. Only the data frames are used for data transmission. The presence
of the other two types may hinder the process of analysis; therefore, the control and
management frames were eliminated, and only data frames were processed further. There
were data frames that did not carry data. Keeping these frames would cause bias in training
the CNN [29]. Therefore, null data frames were also eliminated at this stage.
(b) Normalization
Normalization is an important step in data pre-processing to avoid having different
scales of feature vectors and, thus, improves integrity of data. The data set contained feature
values in different scales that may lead to obtaining biased results. To normalize the feature
values, the standard scaler [30] was used, which normalizes each feature by removing its
mean and scaling to unit variance. This equalizes the importance of all features and allows
DL methods to converge faster. For each original value X with a mean µ and standard
deviation σ, its normalized value X’ can be determined from (1):
X’ = (X − µ)/σ (1)
(c) Segmentation
During in-app activity detection, it is not possible to guarantee that the entire transac-
tion of an activity can be observed. There can be situations where the eavesdropper starts
to capture the traffic while the user is already performing an activity. In these instances,
the eavesdropper can capture only a part of the traffic flow instead of the entire flow trans-
action. To perform in-app activity detection even by observing only a part of an activity
related traffic, time windows are used to divide the traffic flows into segments. A thorough
analysis of the sensitivity of this approach was performed by conducting experiments with
different time window sizes: 1, 0.5, 0.2, and 0.1 s as discussed in Section 4.1.
Following network traffic pre-processing, each segmented traffic sample was con-
verted into an image, where features and corresponding feature values were represented
by pixels and pixel intensities, respectively. In this work two sets of data images were
generated that used different color schemes. These were grayscale and red, green, and blue
(RGB). If the segmented traffic sample, S, has n number of frames and m number of data
values, then the value of mth data at nth frame can be represented as Anm . The segment S is
represented as matrix (2):
· · · A1m
A11
S = ... .. .. (2)
. .
An1 ··· Anm
The three main side channel data considered in this work were frame length, data
length, and inter arrival time. Segment S comprised values of these side channel data.
Based on these data, individual vectors were created. The division can be expressed as
matrix (3):
Xi = [A1i , A2i , . . . Ani ] (3)
where n is the number of frames and Xi represents all data values of the ith side channel
data. The number of vectors that are created depends on the number of side channel data.
In this research, three side channel data were considered; thus, three vectors were created.
When employing a grayscale model, these three vectors combined to form one vector.
Whereas in the RGB model, these were passed together as three separate vectors.Future Internet 2022, 14, 67 7 of 18
If the image size is very small, then it cannot be sent through the required number of
convolutional layers, because after each layer, the size is reduced. Therefore, resizing was
applied to match with the respective pre-defined input image size.
Each element in the matrix is treated as a pixel with the grayscale value of the pixel,
where the color intensity is proportional to the matrix value. Figure 1 shows three in-app
activities’ traffic flows in grayscale format. The input image dimensions were h × w × c,
where h × w were the dimensions of the image, and c was the number of channels. The
image dimension wass constructed according to the number of features in the data set.
The dimensions of the images were set to 28 × 28 following empirical tests. Grayscale
images had one channel. Hence, the input image size of grayscale images was resized to
28 × 28 × 1 (784). Data fed into CNN must be uniform. The data that were less than these
pre-defined image sizes were zero-padded, and data that were more than the pre-defined
image sizes were truncated to match the respective pre-defined size.
3.3. Image Classification Using CNN
The CNN architecture proposed to identify in-app activities was composed of four
main parts: model input, traffic feature extraction, prediction, and model output as shown
in Figure 3.
Figure 3. Proposed CNN architecture to identify in-app activities. The traffic flow data transferred
into pixelized images are used as the input to the CNN model with input dimension of 28 × 28.
The input layer was then connected to a combination of convolution and pooling
layers to learn image features. In this proposed architecture, three convolutional layers
were used, where each convolution layer was followed by a pooling layer that selects the
most important features from its receptive region and reduces the number of parameters
required to train the model. Pooling layers reduce the size of the output through the
convolutional process and cancel noise. In our model, the max-pooling function was used,
which outputs the maximum value in a rectangular neighborhood of the previous layer.
The fully connected layers at the end of CNN concatenated the output of the convolu-
tion layer into a dense vector. This was passed to the model prediction phase.
The dense vector was then transformed into model outputs through a fully connected
layer, which had 92 outputs indicating the number of classes (in-app activities) used to
classify the input images. This output layer was a SoftMax layer, which output a K-
dimensional probability distribution vector of values in the range of 0–1, where K is the
number of classes (K = 92). Each node value represents a class score. The class with the
highest score was selected and the corresponding class label was assigned.
The hyperparameters, such as the number of convolutional layers, number of fully
connected layers, number of filters for each hidden layer, filter and stride size, and activation
functions, were selected through comprehensive tests involving numerous parameter
combinations. The depth of the CNN should be neither too large nor too small [31], and
thus it is able to learn complex relations while maintaining model’s convergence. To
determine the suitable value for the model’s depth, different values from small to large
were assigned to test the CNN model until the best model was found. The rationale behindFuture Internet 2022, 14, 67 8 of 18
using this architecture was based on the experiments we conducted in which we discovered
that this architecture was the best fit model for our problem.
3.4. Unknown In-App Data Detection
In a real-world setting, data traffic captured contains both previously known and
unknown traffic flows. Previously known traffic is related to the in-app activities consid-
ered during model training whereas unknown traffic relates to the in-app activities not
considered during model training. A major challenge to the robustness of the classifier’s
performance comes from previously unknown/unseen traffic. Identifying previously un-
trained in-app activities using the proposed method is one of the key contributions of
this work.
When the traffic flows are converted into images and input to the CNN model, they
pass through hidden layers and reach the output layer. A SoftMax layer is added to the
end of the CNN, which converts the output values into a probability distribution. Model’s
output layer has nodes that is equal to the number of classes. The SoftMax layer provides
probabilities for each class label in the interval (0, 1). Usually for a given input sample,
one of the classes will have a higher probability value than the rest of the classes. In
normal traffic classification tasks, a class is assigned to a data point based on the highest
probability. However, in this work instead of making the class with the highest probability
be the final classification, a threshold approach is used to determine if the test sample is a
known or unknown instance. Figure 4 shows the technique used to detect noise (unknown
in-app data) generated by previously unknown traffic. Pmax denotes the node with the
highest predicted class probability. The decision for converting the predicted probability
into a class label is dominated by a parameter known as the threshold. If Pmax < threshold,
then the test sample is labeled as an unknown instance. Threshold set on a positive class
determines whether the test sample belongs to one of the trained classes, which translates
into a pre-trained in-app activity or not.
Figure 4. Framework to detect unknown in-app activity data.
To examine the impact of the threshold on model’s performance, a range of threshold
values were selected and tested. Setting a threshold too high results in an increase in false
negatives, while setting it too low leads to an increase in false positive. Therefore, setting a
balanced threshold value is challenging. In this work, a threshold value that contributes to
achieving the highest classification accuracy was utilized, which was obtained empirically
as 0.97.
4. Experimental Results and Discussion
The performance evaluation of the proposed model is presented in this section. When
evaluating the proposed model, the following two factors are considered to measure
the performance.
• Ability to detect previously trained in-app activities correctly;
• Ability to detect previously untrained/unknown in-app activities as noise data.Future Internet 2022, 14, 67 9 of 18
The CNN models were constructed, trained, and tested by Keras 2.5.0 with TensorFlow
2.5.0 running at the back end. Experiments were conducted using 92 in-app activities from
the Facebook, Instagram, YouTube, Viber, WhatsApp, Gmail, Skype and Messenger apps
(see Table 1). Eighty percent of the total samples were dedicated for training, and remaining
20% for validation.
Accuracy was used to evaluate the model performance, which is computed as follows:
True Positives + True Negatives
Accuracy of known data = (4)
Total no. of known instances
True Negatives
Accuracy of unknown data = (5)
Total no. of unknown instances
4.1. Model Analysis
The proposed CNN architecture comprises of seven layers excluding the input and
output layers (as depicted in Figure 3). The three convolutional layers had 256, 128,
and 64 numbers of filters in each layer, respectively. The fully connected layer had 128
nodes. Tanh activation function is applied to the output of every convolutional and fully
connected layer. To reduce overfitting, the dropout technique is used to prevent complex
co-adaptations on the training data [7]. In this architecture, the Adam optimizer and
categorical cross entropy loss function were used.
The model performance varied with different image sizes as inputs according to our
tests. When the image size was too small, there was a sign of learning degradation. When
the image size was too large, then the extraction phase took much longer time. Thus,
we selected 28 × 28 pixel image size, which helped to reduce the run-time and memory
consumption while improving detection rate in all our experiments.
In addition to grayscale images, RGB images were also created from the collected
network traffic data set. This was done to observe the performance of in-app activity
classification when in-app data is converted to 3D images. Instead of considering the entire
flow of an activity, we used the segment-based approach to perform the classification. Four
different time windows were used to divide the traffic flows into segments: 1 s, 0.5 s, 0.2 s,
and 0.1 s. Table 2 presents the training and validation accuracies, and time needed to train
and test the models.
Table 2. Classification performance of grayscale and RGB models.
Window Sizes
1s 0.5 s 0.2 s 0.1 s
Gray RGB Gray RGB Gray RGB Gray RGB
Training accuracy (%) 97 84 98 84 96 83 95 81
Validation accuracy (%) 83 71 88 76 92 80 86 74
1h 1h 2h 2h
Training and testing time 8 min 15 min 19 min 27 min
9 min 20 min 30 min 48 min
From the experimental results, it can be observed that the accuracy values obtained
for the grayscale models are higher than those recorded for the RGB models for all time
windows tested. This is because RGB models suffer from overfitting due to the presence
of large number of features resulting from the three color channels. Therefore, grayscale
images are selected as inputs to avoid false classification and complexities for the rest of
the experiments.
Validation accuracy was highest when the time window size was 0.2 s. The reason
is when traffic traces are segmented into a smaller window size, we were able to obtain
plenty of samples. Training the model with large of samples contributed positively towards
the classification accuracy. However, this was not true when the window size was further
reduced. Even though the sample size increased when traffic traces were segmentedFuture Internet 2022, 14, 67 10 of 18
into a smaller window size such as 0.1 s, the classification accuracy decreased. This was
because the number of frames contained in such smaller window segments is less. When
frames were considered individually or when the number of frames was insignificant, they
contained very little information to perform the classification.
With the decrease in window size, leading to an increase in the number of samples,
the results present that long times are needed to pre-process, train, and test the models.
From the Table 2 data, it can be observed that all grayscale models achieved an average
accuracy of 87%. This shows that the proposed model can identify fine-grained in-app
activities even by observing only a small subset of an activity’s traffic.
4.2. Unknown In-App Data (Noise) Detection
In noise detection tests we use leave-one-out approach where two data sets were
created, namely training and noise data sets. From the eight apps considered in the
experiments, each time an app was singled out and used to create the noise data set. The
remaining seven apps were used to create the train data set. While the training data set was
used to train the model, the noise data set (with in-app activities unknown to the trained
model) was input to the trained model to determine its ability to detect unknown data. The
result of this experiment is shown in Figure 5.
Figure 5. Noise detection rates of unknown apps.
In Figure 5, F, I, G, M, S, V, W, and Y denote Facebook, Instagram, Gmail, Messenger,
Skype, Viber, WhatsApp, and YouTube, respectively. On each vertical bar in Figure 5, the
apps used to train the model at each instance are denoted. The app labelled on the X axis is
the app in the noise data set.
Let’s us explain how to interpret Figure 5. The first vertical bar in Figure 5 shows that
a CNN model is trained with the in-app activity data from the following 7 apps: I, G, M, S,
V, W and Y. The in-app activity data from F is kept away from the training process. During
the testing, the in-app activity data from F is used to determine the robustness of trained
CNN model. As shown in the first bar in Figure 5, the trained CNN model successfully
identified more than 90% of the in-app data from F as unknown data.
As shown in Figure 5, the proposed method achieved 75% or more in detecting noise
with average accuracy of 88%. Data from Gmail and Viber applications were detected with
94% accuracy. However, the proposed model couldn’t distinguish data from Skype with
the trained data only 75% of the Skype traffic got correctly detected as unknown traffic.
The remining 25% was misclassified as in-app activities that belong to the training data set.
To understand the nature of the misclassified traffic, further analysis was performed on
the apps to which the unknown traffic got classified. The results are presented in Figure 6Future Internet 2022, 14, 67 11 of 18
in percentage values (%). For example, only 8% of the data from F is classified as known
data (see first bar in Figure 5). The distribution of this 8% of the misclassified data from F is
shown in the first row in Figure 6. Majority of this data (35%) are assigned to S (Skype).
Figure 6. Confusion matrix (% values).
Looking at Figure 6, the majority of the misclassified data was assigned to Facebook.
We observed that there was a high correlation among all the considered apps with Facebook,
which contributed to the misclassification. For Instagram, Gmail, Messenger, Viber, and
WhatsApp, the second and third highest misclassifications came from Skype and YouTube,
respectively. This can also be seen by plotting the correlation between these apps (see
Figure 7).
Figure 7. Correlations among different apps. (a) correlation of Facebook with Instagram, Messenger,
Skype and YouTube. (b) correlation of Skype vs YouTube and Instagram with YouTube and Skype.
(c) correlation of WhatsApp with Viber and Gmail.
Figure 7a shows the correlation plots of Facebook with four different apps. Figure 7b
shows the correlation plots of Skype and YouTube with two different apps. In Figure 7a,b theFuture Internet 2022, 14, 67 12 of 18
points are closely packed, which means the strength of the correlation was high. Apps that
are highly correlated with each other have similar in-app activities with similar behavior.
Looking at the W column in Figure 5, the least amount of misclassification resulted
from WhatsApp, which was 1% for all the test apps. This was due to the least correlation
between W and other apps as shown in Figure 7c. It can be observed that the points are
distributed loosely which means the considered apps are only slightly correlated to each
other. The behavior of Facebook, Instagram, Gmail, Messenger, Skype, Viber, and YouTube
in-app activities was not similar to WhatsApp’s in-app activities, which makes them less
correlated to each other.
To obtain a better insight into the misclassifications occurred, further analysis of the
in-app activities to which the test apps got misclassified was conducted. Table 3 lists the six
in-app activities with the highest misclassification percentage against each of the test apps,
where the in-app activities were coded as follows:
Utuv—uploading a video on YouTube;
Skvc—having a video call on Skype;
Msgac—having an audio call on Messenger;
Skv—sending a video on Skype;
Indvc—having a video chat on Instagram Direct;
Fblive—uploading a live video on Facebook;
Skac—having an audio call on Skype;
Fbpv—posting a video on Facebook wall
Utwv—watching a video on YouTube.
Table 3. Misclassified in-app activities with misclassification percentage (%) values.
F I G M S V W Y
Utuv—27 Utuv—21 Utuv—21 Utuv—21 Utuv—26 Utuv—19 Utuv—19 Fblive—20
Skvc—13 Fblive—15 Fblive—16 Fblive—17 Fblive—22 Fblive—15 Fblive—14 Skvc—11
Msgac—9 Skvc—9 Skvc—8 Skac—9 Msgac—8 Skvc—7 Skvc—8 Msgac—8
Skv—9 Skac—8 Skac—7 Skvc—7 Fbpv—6 Skac—7 Skac—7 Skac—8
Skac—8 Msgac—7 Msgac—6 Fbpv—6 Indvc—6 Msgac—6 Msgac—6 Skv—8
Indvc—6 Skv—7 Fbpv—6 Skv—5 Utwv—4 Skv—6 Skv—5 Fbpv—7
The highest percentage of misclassification was recorded from Utuv on Facebook and
Skype. When Facebook was input to the model as the unknown/noise app, 27% of its
traffic was misclassified as Utuv. When creating the Facebook data set, activities such as
posting a video on wall, uploading a live video were considered, which are very similar
to Utuv on YouTube. Therefore, having such similarity in the in-app activities caused the
misclassification. When Skype was considered as the unknown app, 26% of its traffic was
also misclassified as Utuv. Similarly, when creating the Skype data set activities such as
sending a video message, engaging in a video call were considered. Again, having such
similar in-app activities to Utuv has caused the reported misclassification.
While most of the Facebook traffic was misclassified as Utuv, which is in fact an
activity from YouTube; most of the YouTube traffic got misclassified as Fblive, an activity
from Facebook. Both Utuv and Fblive activities are related to video uploading and thus
have a high correlation between each other due to their similarity in behaviour, resulting in
the misclassification.
4.3. Performance Comparison
Even though in this work a CNN model was used to perform the traffic classifications,
other types of neural networks could also be employed for this purpose, such as a Deep
Neural Network (DNN). This section reports on the performance comparison between the
DNN and CNN models when they are used in our tests.Future Internet 2022, 14, 67 13 of 18
In both models, the output types were in-app activities. But the format of the input was
different: in CNN, images were provided as the input whereas in DNN, statistical features
related to the traffic flows constituted the input. Although the same data set was used
for both DNN and CNN models to perform tests, we employed the network architecture
that resulted in the highest accuracy for each model instead of using the same network
architecture across the board for a fair comparison. This was needed as the input format
was different in both cases, which had a direct influence on accuracy performance. For
CNN, the network architecture proposed in Section 4.1 was used. For the DNN model, four
hidden layers were used with 1024, 512, 256 and 128 nodes in each layer. Tanh activation
function was used for all layers expect for the output layer which used the SoftMax layer.
The 48 statistical features used in [4] were utilized as the input of DNN. Figure 8 shows the
training and validation accuracies obtained at 0.5 s and 0.2 s time window sizes when both
models were used to perform in-app activity classification.
Figure 8. Accuracy comparison of the CNN and DNN models.
From Figure 8, it is noted that the DNN model has recorded the highest accuracy
values compared to the CNN model in all categories. But when looked closely at the
comparison at each time window size, the difference in accuracy values is maximum 5%.
Significantly, all the accuracies of the CNN model are at 88% or above. Therefore, it can be
concluded that both models can accurately detect previously trained in-app activities.
To compare the detection of unknown in-app data, it can be observed from Figure 9
that the CNN model has outperformed the DNN model at all the instances when different
noise test traffic data sets (Test app) were applied. In both models, Gmail and Viber reported
the highest noise detection rates. Compared to the DNN model, when the CNN model is
employed, there is an increment of 19%, 18%, and 12% noise detection rates when YouTube,
Messenger, and Skype are input as test app, respectively.
Even though the ability to detect previously trained in-app activities correctly by
the CNN model is slightly weaker than that of DNN, its ability to detect previously un-
trained/unknown in-app activities as noise data is much stronger than that of DNN.
Therefore, when the overall performance is considered, the proposed CNN model out-
performs DNN. This is because when traffic flows are converted to images, the model
can apply image processing techniques to reveal interesting properties of the traffic. As
such, applying the proposed CNN model on the input traffic images allows for extracting
and selecting salient features that enable the model to learn to differentiate trained and
unknown traffic.Future Internet 2022, 14, 67 14 of 18
Figure 9. Noise detection comparison of the CNN and DNN models.
5. Conclusions
In this paper, a novel approach was introduced for encrypted Internet traffic classifica-
tion, both for identifying known and unknown traffic and categorizing in-app activity type,
based only on frame’s size and time related information. User actions identified through
analysing network traffic can be used in forensic investigations and security incident analy-
sis, to improve correlation of events. Profiling users based on their in-app activities is also
useful for marketing or intelligence purposes. Deep Learning obviates the need to select
features by a domain expert as it automatically selects features through training, making
it a desirable approach when new classes constantly emerge, and patterns of old classes
evolve. Performance of the proposed CNN based method that learns traffic as images
was compared with DNN that uses statistical features. The results demonstrate that the
proposed CNN model has outperformed DNN when overall performance is considered.
Moreover, a windowing approach was used to perform classification by observing a short
time window of a flow instead of the entire session. Even though this is significantly a
harder task as there is less information in partial encrypted traffic flow compared to the
entire flow, our model was able to identify in-app activities with an accuracy of 92% even
by observing the traffic only for 0.2 s. The novel approach of using a threshold on the
confidence values exploits the model’s output layer to identify in-app activities while
removing noise traffic generated by untrained in-app activities with an average accuracy
of 88%.
Author Contributions: Conceptualization, M.H.P., Y.R., S.D. and A.K.; methodology, M.H.P., Y.R.
and S.D.; software, M.H.P.; validation, M.H.P.; formal analysis, M.H.P.; investigation, M.H.P., Y.R. and
S.D.; data curation M.H.P.; writing—original draft preparation M.H.P.; writing—review and editing,
Y.R. and S.D.; visualization, M.H.P.; supervision, Y.R., S.D. and A.K. All authors have read and agreed
to the published version of the manuscript.
Funding: This research received no external funding.
Data Availability Statement: This data set is shared openly with the research community to foster
new studies and allow reproduction of the results presented. (https://www.dropbox.com/s/9tihcj9
wx2sia1t/Dataset.7z?dl=0 (accessed on 10 December 2021)).
Acknowledgments: Madushi H. Pathmaperuma would like to express her thanks to the Lough-
borough University, UK, for supporting her research. Safak Dogan would like to acknowledge the
Engineering and Physical Sciences Research Council (EPSRC), UK, for their support of his work
(EP/W00366X/1).
Conflicts of Interest: The authors declare no conflict of interest.Future Internet 2022, 14, 67 15 of 18
Appendix A
Table A1. The 92 in-app activities considered in this research.
Application Category Fine Grained Activity
Post an image on wall
Post a video on wall
Post a long text on wall
Post a short text on wall
Post a feeling on wall
Post a check in on wall
Post a live video on wall
Comment a short text on a post
Comment a long text on a post
Facebook Social networking
Comment a post with a sticker
Comment a post with an image
Add an image to a story
Add a video to a story
Add a text to a story
Share an image to the wall
Share a video to the wall
Share a text to the wall
Like an image
Like a video
Like a comment
Send a friend request
Watch Facebook video
Add an image to a story
Add a video to a story
Add a text to a story
Like an image
Like a video
Like a comment
Comment a short text on a post
Instagram Comment a long text on a post
Photo and Video
Instagram- Direct Post an image on feed
Post a video on feed
Follow a friend
Follow back a friend
Send a message to a story
Watch Instagram video
Send a long text message
Send a short text message
Send a voice recording message
Send an image
Like a message
Video chat
Watch a video
YouTube Photo and Video Like a video
Dislike a videoFuture Internet 2022, 14, 67 16 of 18
Table A1. Cont.
Application Category Fine Grained Activity
Comment a long text on a video
Comment a short text on a video
YouTube Photo and Video Like a comment
Dislike a comment
Upload a video
Subscribe a channel
Video call
Audio call
Send a long text message
Skype Social networking Send a short text message
Send voice recording
Send an image
Send a video
Send a file
Send short text email
Send long text email
Gmail Productivity
Send an image
Send a video
Send a file attachment
Video call
Audio call
Send a ling text message
Send a short text message
Messenger Social networking Send a voice recording
Send an image
Send a video
Add an image to a story
Add a video to a story
Add a text to a story
Send long text message
Send short text message
Video call
Audio call
WhatsApp Social networking
Send voice recording
Send an image
Send a video
Send location
Send contact
Send long text message
Send short text message
Video call
Audio call
Viber Social networking
Send voice recording
Send an image
Send a video
Send location
Send contactFuture Internet 2022, 14, 67 17 of 18
References
1. Rezaei, S.; Liu, X. Deep learning for encrypted traffic classification: An overview. IEEE Commun. Mag. 2019, 57, 76–81. [CrossRef]
2. Taylor, V.F.; Spolaor, R.; Conti, M.; Martinovic, I. Appscanner: Automatic fingerprinting of smartphone apps from encrypted
network traffic. In Proceedings of the 2016 IEEE European Symposium on Security and Privacy (EuroS&P), Saarbruecken,
Germany, 21–24 March 2016; IEEE: Manhattan, NY, USA, 2016; pp. 439–454.
3. Wang, Q.; Yahyavi, A.; Kemme, B.; He, W. I know what you did on your smartphone: Inferring app usage over encrypted
data traffic. In Proceedings of the 2015 IEEE Conference on Communications and Network Security (CNS), Florence, Italy,
28–30 September 2015; IEEE: Manhattan, NY, USA, 2015; pp. 433–441.
4. Pathmaperuma, M.H.; Rahulamathavan, Y.; Dogan, S.; Kondoz, A.M. In-app activity recognition from Wi-Fi encrypted traffic. In
Science and Information Conference; Springer: Cham, Swizerland, 2020; pp. 685–697.
5. Saltaformaggio, B.; Choi, H.; Johnson, K.; Kwon, Y.; Zhang, Q.; Zhang, X.; Xu, D.; Qian, J. Eavesdropping on fine-grained user
activities within smartphone apps over encrypted network traffic. In Proceedings of the 10th USENIX Workshop on Offensive
Technologies (WOOT 16), Austin, TX, USA, 8–9 August 2016.
6. Zhou, H.; Wang, Y.; Lei, X.; Liu, Y. A method of improved CNN traffic classification. In Proceedings of the 2017 13th International
Conference on Computational Intelligence and Security (CIS), Hong Kong, China, 15–18 December 2017; IEEE: Manhattan, NY,
USA, 2017; pp. 177–181.
7. Shapira, T.; Shavitt, Y. Flowpic: Encrypted internet traffic classification is as easy as image recognition. In Proceedings of
the IEEE INFOCOM 2019-IEEE Conference on Computer Communications Workshops (INFOCOM WKSHPS), Paris, France,
29 April–2 May 2019; IEEE: Manhattan, NY, USA, 2019; pp. 680–687.
8. Ma, X.; Dai, Z.; He, Z.; Ma, J.; Wang, Y.; Wang, Y. Learning traffic as images: A deep convolutional neural network for large-scale
transportation network speed prediction. Sensors 2017, 17, 818. [CrossRef]
9. Conti, M.; Mancini, L.V.; Spolaor, R.; Verde, N.V. Analyzing android encrypted network traffic to identify user actions. IEEE Trans.
Inf. Forensics Secur. 2015, 11, 114–125. [CrossRef]
10. Taylor, V.F.; Spolaor, R.; Conti, M.; Martinovic, I. Robust smartphone app identification via encrypted network traffic analysis.
IEEE Trans. Inf. Forensics Secur. 2017, 13, 63–78. [CrossRef]
11. Zhang, J.; Chen, X.; Xiang, Y.; Zhou, W.; Wu, J. Robust network traffic classification. IEEE/ACM Trans. Netw. 2014, 23, 1257–1270.
[CrossRef]
12. Draper-Gil, G.; Lashkari, A.H.; Mamun, M.S.I.; Ghorbani, A.A. Characterization of encrypted and vpn traffic using time-related.
In Proceedings of the 2nd International Conference on Information Systems Security and Privacy (ICISSP), Fredericton, NB,
Canada, 19 February 2016; pp. 407–414.
13. Wang, W.; Zhu, M.; Zeng, X.; Ye, X.; Sheng, Y. Malware traffic classification using convolutional neural network for represen-
tation learning. In Proceedings of the 2017 International Conference on Information Networking (ICOIN), Da Nang, Vietnam,
11–13 January 2017; IEEE: Manhattan, NY, USA, 2017; pp. 712–717.
14. Tang, T.A.; Mhamdi, L.; McLernon, D.; Zaidi, S.A.R.; Ghogho, M. Deep learning approach for network intrusion detection
in software defined networking. In Proceedings of the 2016 International Conference on Wireless Networks and Mobile
Communications (WINCOM), Fez, Morocco, 26–29 October 2016; IEEE: Manhattan, NY, USA, 2016; pp. 258–263.
15. Niyaz, Q.; Sun, W.; Javaid, A.Y. A deep learning based DDoS detection system in software-defined networking (SDN). arXiv 2016,
arXiv:1611.07400. [CrossRef]
16. Mirsky, Y.; Doitshman, T.; Elovici, Y.; Shabtai, A. Kitsune: An ensemble of autoencoders for online network intrusion detection.
arXiv 2018, arXiv:1802.09089.
17. Shone, N.; Ngoc, T.N.; Phai, V.D.; Shi, Q. A deep learning approach to network intrusion detection. IEEE Trans. Emerg. Top.
Comput. Intell. 2018, 2, 41–50. [CrossRef]
18. Wang, W.; Zhu, M.; Wang, J.; Zeng, X.; Yang, Z. End-to-end encrypted traffic classification with one-dimensional convolution
neural networks. In Proceedings of the 2017 IEEE International Conference on Intelligence and Security Informatics (ISI), Beijing,
China, 22–24 July 2017; IEEE: Manhattan, NY, USA, 2017; pp. 43–48.
19. Lopez-Martin, M.; Carro, B.; Sanchez-Esguevillas, A.; Lloret, J. Network traffic classifier with convolutional and recurrent neural
networks for Internet of Things. IEEE Access 2017, 5, 18042–18050. [CrossRef]
20. Aceto, G.; Ciuonzo, D.; Montieri, A.; Pescapè, A. MIMETIC: Mobile encrypted traffic classification using multimodal deep
learning. Comput. Netw. 2019, 165, 106944. [CrossRef]
21. Wang, Z. The applications of deep learning on traffic identification. BlackHat USA 2015, 24, 1–10.
22. Lotfollahi, M.; Siavoshani, M.J.; Zade, R.S.H.; Saberian, M. Deep packet: A novel approach for encrypted traffic classification
using deep learning. Soft Comput. 2020, 24, 1999–2012. [CrossRef]
23. Tavakoli, N. Seq2image: Sequence analysis using visualization and deep convolutional neural network. In Proceedings of the
2020 IEEE 44th Annual Computers, Software, and Applications Conference (COMPSAC), Madrid, Spain, 13–17 July 2020; IEEE:
Manhattan, NY, USA, 2020; pp. 1332–1337.
24. Kim, S.S.; Reddy, A.N. A study of analyzing network traffic as images in real-time. In Proceedings of the IEEE 24th Annual Joint
Conference of the IEEE Computer and Communications Societies, Miami, FL, USA, 13–17 March 2005; IEEE: Manhattan, NY,
USA, 2005; Volome 3, pp. 2056–2067.Future Internet 2022, 14, 67 18 of 18
25. Kim, S.S.; Reddy, A.N. Image-based anomaly detection technique: Algorithm, implementation and effectiveness. IEEE J. Sel.
Areas Commun. 2006, 24, 1942–1954. [CrossRef]
26. Kim, S.S.; Reddy, A.N. Modeling network traffic as images. In Proceedings of the IEEE International Conference on Communica-
tions, 2005, ICC 2005, Seoul, Korea, 16–20 May 2005; IEEE: Manhattan, NY, USA, 2005; Volume 1, pp. 168–172.
27. He, Y.; Li, W. Image-based encrypted traffic classification with convolution neural networks. In Proceedings of the 2020 IEEE
Fifth International Conference on Data Science in Cyberspace (DSC), Hong Kong, China, 27–30 July 2020; IEEE: Manhattan, NY,
USA, 2020; pp. 271–278.
28. Aircrack-ng. Available online: https://www.aircrack-ng.org/ (accessed on 11 July 2021).
29. Taheri, S.; Salem, M.; Yuan, J.S. Leveraging image representation of network traffic data and transfer learning in botnet detection.
Big Data Cogn. Comput. 2018, 2, 37. [CrossRef]
30. Sklearn.preprocessing. StandardScaler. 2021. Available online: https://scikit-learn.org/stable/modules/generated/sklearn.
preprocessing.StandardScaler.html?highlight=standardscaler#sklearn.preprocessing.StandardScaler (accessed on 15 July 2021).
31. Lv, Y.; Duan, Y.; Kang, W.; Li, Z.; Wang, F.Y. Traffic flow prediction with big data: A deep learning approach. IEEE Trans. Intell.
Transp. Syst. 2014, 16, 865–873. [CrossRef]You can also read