Clinical Neurophysiology - Brainvolts
←
→
Page content transcription
If your browser does not render page correctly, please read the page content below
Clinical Neurophysiology 132 (2021) 2110–2122

                                                             Contents lists available at ScienceDirect

                                                          Clinical Neurophysiology
                                              journal homepage: www.elsevier.com/locate/clinph

Auditory neurophysiological development in early childhood: A growth
curve modeling approach
Elaine C. Thompson a,b,1, Ryne Estabrook c, Jennifer Krizman a,b, Spencer Smith a,b,2, Stephanie Huang a,
Travis White-Schwoch a,b, Trent Nicol a,b, Nina Kraus a,b,d,e,f,⇑
a
  Auditory Neuroscience Laboratory, Northwestern University, Evanston, IL, USA
b
  Department of Communication Sciences, Northwestern University, Evanston, IL, USA
c
  Department of Psychology, University of Illinois at Chicago, Chicago, IL, USA
d
  Institute for Neuroscience, Northwestern University, Evanston, IL, USA
e
  Department of Neurobiology, Northwestern University, Evanston, IL, USA
f
  Department of Otolaryngology, Northwestern University, Chicago, IL, USA

a r t i c l e        i n f o                          h i g h l i g h t s

Article history:
                                                        Auditory neurophysiological processing of sound matures from ages 3–8 years.
Accepted 24 May 2021
                                                        The frequency following response, a subcortical index of sound processing, becomes faster, more
Available online 20 June 2021
                                                          robust, and more consistent with age.
                                                        Growth curve modeling reveals individual differences in auditory maturation are evident overall and
Keywords:
Development                                               over time throughout early childhood.
Childhood
Auditory processing
Neurophysiology                                       a b s t r a c t
Longitudinal
Growth curve modeling                                 Objective: During early childhood, the development of communication skills, such as language and
                                                      speech perception, relies in part on auditory system maturation. Because auditory behavioral tests
                                                      engage cognition, mapping auditory maturation in the absence of cognitive influence remains a chal-
                                                      lenge. Furthermore, longitudinal investigations that capture auditory maturation within and between
                                                      individuals in this age group are scarce. The goal of this study is to longitudinally measure auditory sys-
                                                      tem maturation in early childhood using an objective approach.
                                                      Methods: We collected frequency-following responses (FFR) to speech in 175 children, ages 3–8 years,
                                                      annually for up to five years. The FFR is an objective measure of sound encoding that predominantly
                                                      reflects auditory midbrain activity. Eliciting FFRs to speech provides rich details of various aspects of
                                                      sound processing, namely, neural timing, spectral coding, and response stability. We used growth curve
                                                      modeling to answer three questions: 1) does sound encoding change across childhood? 2) are there indi-
                                                      vidual differences in sound encoding? and 3) are there individual differences in the development of
                                                      sound encoding?
                                                      Results: Subcortical auditory maturation develops linearly from 3-8 years. With age, FFRs became faster,
                                                      more robust, and more consistent. Individual differences were evident in each aspect of sound processing,
                                                      while individual differences in rates of change were observed for spectral coding alone.
                                                      Conclusions: By using an objective measure and a longitudinal approach, these results suggest subcortical
                                                      auditory development continues throughout childhood, and that different facets of auditory processing
                                                      follow distinct developmental trajectories.

    Abbreviations: CFI, Comparative Fit Index; FFT, fast Fourier transform; FFR, frequency following response; F0, fundamental frequency; GLM, Generalized Linear Model; ICC,
Intraclass Correlation Coefficient; M1, Model 1; M2, Model 2; M3, Model 3; RMS, root-mean-square; RMSEA, Root Mean Square Error of Approximation; SPL, sound pressure
level; TLI, Tucker-Lewis index..
  ⇑ Corresponding author at: 2240 Campus Drive, Evanston, IL 60208, USA.
    E-mail address: nkraus@northwestern.edu (N. Kraus).
  1
    Now at Emory University School of Medicine, Atlanta, GA, USA.
  2
    Now at University of Texas at Austin, Austin, TX, USA.

https://doi.org/10.1016/j.clinph.2021.05.025
1388-2457/Ó 2021 International Federation of Clinical Neurophysiology. Published by Elsevier B.V. All rights reserved.
E.C. Thompson, R. Estabrook, J. Krizman et al.                                                                   Clinical Neurophysiology 132 (2021) 2110–2122

                                                 Significance: The present findings improve our understanding of auditory system development in
                                                 typically-developing children, opening the door for future investigations of disordered sound processing
                                                 in clinical populations.
                                                         Ó 2021 International Federation of Clinical Neurophysiology. Published by Elsevier B.V. All rights
                                                                                                                                                 reserved.

1. Introduction                                                                   the auditory pathway (Bidelman, 2015; Chandrasekaran and
                                                                                  Kraus, 2010; White-Schwoch et al., 2017), serves as an objective
    During childhood, growth is pervasive, both physically and                    index of auditory processing because it does not depend on
physiologically. Communication skills, such as language and                       attention or volition (Krizman and Kraus, 2019; Skoe and Kraus,
speech perception, expand rapidly. By age 2, most children can                    2010). Because it does not actively engage cognition, the FFR can
combine words into 2-word phrases and up to age 4, sentence                       investigate auditory maturation without the confounds of cogni-
length grows an average of one word per year. Then, from 3 to                     tive processing. Moreover, eliciting the FFR to complex sounds,
8 years of age, a child’s lexicon grows exponentially, from ~150                  such as speech, provides rich insights into distinct aspects of audi-
words to ~23,000 words (Macias and Twyman, 2011; Templin,                         tory system function, including the fidelity with which acoustic
1957). Concurrently, sentences become more complex, with the                      features are processed and the health of the auditory system irre-
addition of prepositions, adjectives, and adverbs by age 5 (Macias                spective of sound engagement (Krizman et al., 2020). These aspects
and Twyman, 2011). The development of these skills relies in part                 of auditory function are indexed through measures derived from
on the development of the auditory system. Anatomically, periph-                  the FFR, including neural timing, spectral coding, response stabil-
eral structures (e.g., cochlea) reach maturity in infancy (Abdala and             ity, and nonstimulus activity (Krizman and Kraus, 2019; Skoe and
Keefe, 2006; Eggermont and Moore, 2012; Lavigne-Rebillard and                     Kraus, 2010). Examining these aspects simultaneously and objec-
Pujol, 1987), while central auditory pathways (e.g., brainstem to                 tively would enable a more complete investigation of sound pro-
cortex) follow a more protracted trajectory through late childhood                cessing, as each offers a perspective into the many ways the
and even adolescence (Moore and Linthicum, 2007). How the audi-                   nervous system engages with sound.
tory system develops functionally, however, is an open question.                      For example, two aspects of auditory function, neural timing
Quantifying this maturation is important for understanding differ-                and spectral coding, reflect the auditory system’s representation
ences in speech and language mastery, and ultimately, for identify-               of temporal and frequency information, respectively, both of which
ing disorders of language development.                                            are relevant for communication (Krizman and Kraus, 2019; Skoe
    One line of research suggests that functional maturation is teth-             and Kraus, 2010). Fluctuations in the temporal and spectral compo-
ered to structural maturation of the auditory system. That is, mat-               nents of speech inform a listener of what was said, where the
uration of distinct auditory perceptual skills follows trajectories               sound originated, and who spoke the message (Carré et al.,
roughly corresponding to development of the auditory structures                   2017). The shape and speed of these fluctuations can also signal
presumed to support these skills (Moore, 2002; Sanes and                          emotion—such as a speaker’s tone or intonation—and comprise
Woolley, 2011). For example, frequency resolution becomes                         the building blocks of speech, like phonemes or syllables (Frick,
adult-like by the first year of life (Spetner and Olsho, 1990;                    1985).
Werner, 1996), which is also around the time the cochlea is struc-                    In contrast, response stability reflects the auditory system’s
turally mature (Eggermont et al., 1996; Ponton et al., 1992). In con-             ability to reliably encode a message. During a recording session,
trast, perception of temporal cues (e.g., temporal integration) does              thousands of stimulus trials are presented to a participant to gen-
not reach adult-like levels until ages 6–10 years (Hartley et al.,                erate an averaged response waveform. By correlating subsets of
2000; Jensen and Neff, 1993; Litovsky, 1997; Wightman et al.,                     these trials, response stability captures how much the response
1989), possibly due to prolonged neuronal development within                      does or does not change across trials, and is therefore thought to
the central auditory system (Moore and Linthicum, 2007).                          reflect the reliability of the auditory system in encoding stimulus
    An alternative hypothesis as to why there are multiple trajecto-              features (Hornickel and Kraus, 2013; Krizman and Kraus, 2019).
ries of functional maturation is that some auditory behavioral tasks              Stable auditory processing is believed to facilitate the sound-to-
call upon fundamental mechanisms of ‘‘hearing” (i.e., cochlear                    meaning connections associated with language learning and learn-
function) that reach maturity earlier on, while other tasks recruit               ing to read; unstable auditory processing is a hallmark of children
additional cognitive processes that continue to develop through                   with language disorders (Hornickel and Kraus, 2013; Otto-Meyer
adolescence. Indeed, auditory perceptual tasks range in their                     et al., 2018).
auditory-system demands and the extent to which cognitive pro-                        Finally, nonstimulus activity, captured during the period of
cesses are recruited. For example, many auditory behavioral tests                 silence between stimulus presentations, provides an index of base-
require sustained attention (Moore et al., 2010), raising the possi-              line neural activity when not evoked (Krizman and Kraus, 2019);
bility that the different tests are not indexing differential develop-            that is, it measures nonstimulus activity thought to reflect back-
ment of auditory processes, but rather the extent to which these                  ground neural and non-neural noise. Background activity levels
processes engage attention. Further complicating the picture is                   are influenced by experience: they are higher in children from
the fact that cognitive processes undergo their own development                   socioeconomically impoverished backgrounds (Skoe et al., 2013)
in early childhood, so it is also possible these behavioral measures              and they are lower in expert athletes, even when controlling for
are in fact measuring maturation of cognitive function. To examine                myogenic artifact (Krizman et al., 2020). Higher levels of nonstim-
auditory development in childhood without the confound of cogni-                  ulus activity may hinder communication skills, such as the ability
tive factors, an objective approach is needed (Sanes and Woolley,                 to perceive speech in noisy environments (Anderson et al., 2012).
2011).                                                                                It is currently unknown how these properties of sound encoding
    The frequency following response (FFR), a neurophysiological                  develop in childhood. Mapping the maturational course of these
measure of electrical events generated within and throughout                      various neurophysiological measures would provide insight into

                                                                           2111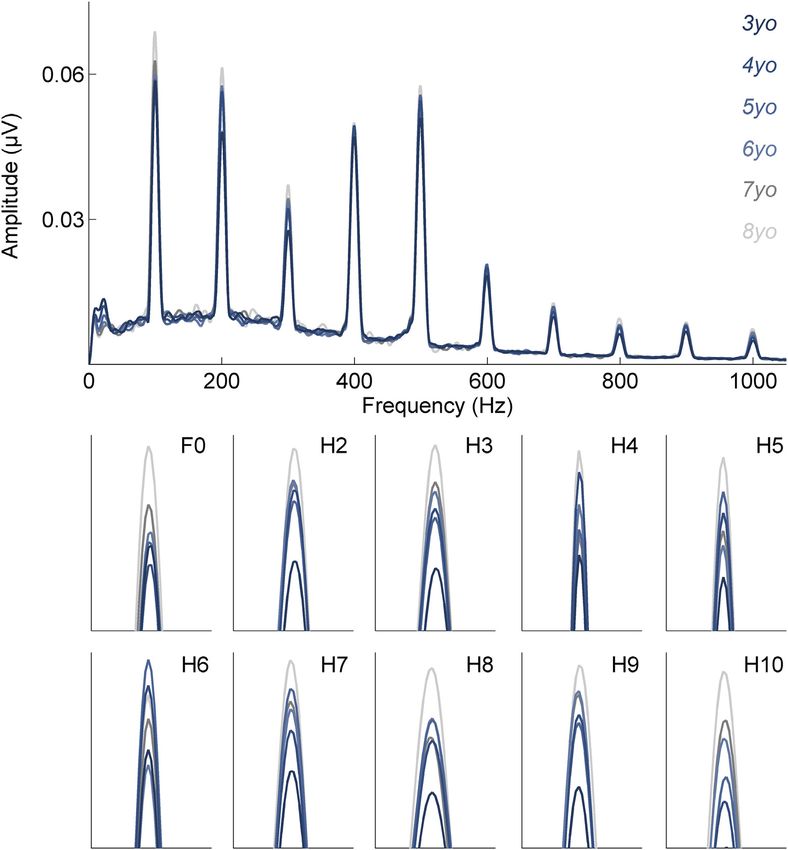
E.C. Thompson, R. Estabrook, J. Krizman et al.                                                                    Clinical Neurophysiology 132 (2021) 2110–2122

the multifaceted development of auditory function, and therefore                    children returned to the lab every 12 months for up to 5 years
could inform clinical diagnostics and interventions, and ultimately                 (Table 1). To achieve greater specificity in the growth curve model,
guide clinical decision-making.                                                     data were analyzed longitudinally with respect to age at test rather
    Moreover, most of what is known about auditory system develop-                  than year of study. Thus, although all analyses considered age as a
ment has been identified using a cross-sectional approach. Age-                     continuous variable, for illustrative purposes, FFR data have been
related differences in characteristic response components (N1 and                   split into age groups in the figures.
P1) of cortical auditory evoked potentials are evident in childhood
(Wunderlich and Cone-Wesson, 2006) and adolescence (Ponton                          2.3. Electrophysiology
et al., 2000; Sharma et al., 1997). Subcortical responses, measured
using the FFR to speech, also differ between age groups and have                        FFRs evoked by the speech syllable [da], (Skoe and Kraus, 2010),
been observed in comparisons of infants (Anderson et al., 2015;                     were collected using a BioSEMI Active2 recording system and audi-
Jeng et al., 2010), young (3–5 yo) and school-age children (8–12                    tory brainstem response module. Recordings were performed in an
yo) (Johnson et al., 2008), and across the lifespan (Skoe et al.,                   electrically-shielded and sound-attenuated booth (IAC Acoustics,
2015). However, one assumption of cross-sectional research is that                  Bronx, NY, USA), and lasted ~30 min. The [da], presented in isola-
between-individual differences also reflect within-individual changes               tion, was played in alternating polarities to the right ear at 80 dB
over time. Tracking within-individual changes requires a longitudinal               SPL through electromagnetically-shielded insert earphones (ER-
design, yet few have employed this approach to examine auditory                     3A, Etymotic Research, Elk Grove Village, IL, USA).
neurophysiological development, especially in childhood.                                The speech syllable [da] is a 170 ms voiced, six-formant stop
    Here, we map auditory neurophysiological maturation during                      consonant with a fundamental frequency (F0) of 100 Hz that was
childhood using an objective index of auditory processing and a lon-                constructed using a Klatt-based synthesizer at 20 kHz (Fig. 1A).
gitudinal approach. The following research questions were asked:                    During the consonant-vowel transition (i.e., the/d/to/a/), the lower
                                                                                    three formants linearly change (F1: 400–720 Hz, F2: 1700–
   (1) Does auditory encoding of speech change across childhood                     1240 Hz, F3: 2580–2500 Hz), while the F0 and upper three for-
       development?                                                                 mants remain steady (F0: 100 Hz, F4: 3300 Hz, F5: 3750 Hz, F6:
   (2) Are there individual differences in speech-sound encoding?                   4900 Hz). During the vowel portion of the stimulus (i.e., the/a/),
   (3) Are there individual differences in the development of                       the F0 and six formants remain steady.
       speech-sound encoding over time?                                                 During the recording session, children sat in a recliner chair and
                                                                                    watched a movie of their choice. To encourage compliance, the left
    To answer these questions, we measured FFRs to speech in a                      ear was unoccluded so the child could hear the soundtrack of the
cohort of children (n = 175) beginning at age 3 or 4 years and contin-              movie (
E.C. Thompson, R. Estabrook, J. Krizman et al.                                                                                   Clinical Neurophysiology 132 (2021) 2110–2122

Table 1
A) Participant descriptive statistics broken down by age at test and year of test of the longitudinal study. B) Descriptive statistics for test-retest duration for each year of
longitudinal study. C) Number of outliers for each neurophysiological measure that were excluded from growth curve analyses. Please see Methods for more information.

  A) Participant descriptive statistics
  Age at test                                    3yo            4yo                5yo               6yo                7yo             8+
  Count (n)                                      82             141                95                70                 48              27
  Average age (years)                            3.47           4.49               5.51              6.52               7.49            8.54
  SD (years)                                     0.27           0.29               0.29              0.30               0.29            0.40
  Min age (years)                                3.01           4.01               5.02              6.01               7.01            8.01
  Max age (years)                                3.94           4.97               6.00              6.96               7.95            9.29
  Females (n)                                    42             63                 40                30                 22              11
  Males (n)                                      40             78                 55                40                 26              16
  Year of test                                   Year 1         Year 2             Year 3            Year 4             Year 5
  Count                                          175            115                85                62                 26
  Females                                        81             51                 36                28                 12
  Males                                          94             64                 49                34                 14
  Average age (years)                            4.02           5.12               6.21              7.32               8.36
  SD                                             0.62           0.63               0.65              0.65               0.54
  B) Test-retest duration (months)               Year 1–2       Year 2–3           Year 3–4          Year 4–5
  Average                                        12.90          12.77              12.45             11.39
  SD                                             2.00           1.78               1.24              1.66
  Min                                            7.79           10.64              11.04             6.67
  Max                                            20.99          22.14              18.33             13.50
  Median                                         12.25          12.29              12.12             11.86
  C) Outlier count (n)                           Year 1         Year 2             Year 3            Year 4             Year 5          All years         % of total sample
  Neural timing                                  2              2                  3                 3                  0               10                2.16
  Spectral coding                                4              1                  4                 3                  4               16                3.46
  Response stability                             7              0                  1                 2                  0               10                2.16
  Nonstimulus activity                           8              4                  3                 2                  2               19                4.10

Fig. 1. The speech syllable [da] (A), a 170 milisecond (ms) consonant-vowel stimulus, was presented to the right ear. The frequency following response (FFR) to the [da] (B)
reflects various aspects of sound processing, including neural timing (C), spectral coding (D), response stability (E), and nonstimulus activity (F).

tical analyses, a composite timing measure was calculated by aver-                          et al., 2006). To determine the frequency representation within
aging the peak and trough latencies within the 20–160 ms                                    the FFR, a fast Fourier transform (FFT) was applied to extract
response region.                                                                            the spectral amplitudes of the fundamental frequency (F0) and
                                                                                            its integer harmonics up to 1000 Hz within the 5–170 ms por-
2.4.2. Spectral coding                                                                      tion of the response. A 16,384 point FFT was computed with an
   The scalp-recorded FFR robustly represents the fundamental                               82.5 ms ramp, and amplitudes were calculated over 40 Hz bins
frequency (F0) and harmonics of speech (Greenberg et al.,                                   centered at the F0 and integer harmonics. For statistical pur-
1987; Krishnan et al., 2004, 2005; Russo et al., 2004; Xu                                   poses, a composite measure was created by averaging all spec-
                                                                                     2113
E.C. Thompson, R. Estabrook, J. Krizman et al.                                                                  Clinical Neurophysiology 132 (2021) 2110–2122

tral amplitudes from the fundamental frequency (F0) through                     also account for variance in time between an individual’s test
the tenth harmonic (H10).                                                       points (e.g., 12 months to 20 months, etc). Included in the models
                                                                                were estimates of intercept (I) and slope (S) means and variances.
2.4.3. Response stability                                                       Constraining intercept values to 1 allowed us to determine the
   To measure response stability over the course of the recording               neural measure’s initial status (i.e. at age 3), while constraining
session, first, two sub-averages of the FFR response were calcu-                slope values to age of test allowed us to determine linear changes
lated. Each sub-average comprised 2000 sweeps, 1000 of each                     in growth over time. Model comparisons were performed using
stimulus polarity, so that the odd epochs of each polarity were                 Chi-Square Difference Tests based on log likelihood values and
used to create one sub-average and the even epochs of each polar-               scaling correction factors obtained within the MLR estimator
ity were used to create the other sub-average (Hornickel and                    (Satorra and Bentler, 2010). All analyses were run in Mplus
Kraus, 2013). The sub-averages were then correlated to compute                  (Muthén and Muthén, 2017). P values less than 0.05 were consid-
a Pearson product-moment correlation coefficient (r). For statisti-             ered significant.
cal purposes, data were Fisher (z) transformed.                                     The series of growth curve models were implemented as fol-
                                                                                lows. First, we ran a full growth curve model to examine individual
2.4.4. Nonstimulus activity                                                     differences within our dataset, as well as individual differences
   To quantify the non-evoked neural activity of the FFR, the root-             with respect to development (i.e., rates of change). In this model
mean-square (RMS) amplitude of the 40-ms interval preceding the                 (Model 1), all parameters were freely estimated: intercept mean,
stimulus-evoked response was calculated.                                        slope mean, intercept variance, intercept slope, intercept and slope
                                                                                mean covariance, and residual variances. Next, we ran a simplifica-
2.5. Data monitoring and outlier checking                                       tion of Model 1 to estimate the overall change in the respective
                                                                                neurophysiological measure over time. In this model (i.e., Model
   Prior to statistical analyses, data were examined for outliers.              2), fixing slope variance to zero allowed us to test the null hypoth-
Particular care was taken to remove as few outliers as possible.                esis that all individuals develop at the same rate. Finally, we ran an
Data points were only excluded if 1) there was a technical error                even simpler model, Model 3, by fixing slope mean and slope vari-
in collection, or 2) if >3 standard deviations (SD) above/below                 ance to zero to test the null hypothesis that there are no changes in
mean. Because these neurophysiological measures are distinct, an                neurophysiological development over time.
outlier for one neurophysiological measure was not necessarily                      To answer our research questions we systematically excluded
an outlier for the other neurophysiological measures within that                growth curve parameters in the series of models (M1, M2, M3)
year. In addition, if a participant’s data was excluded at one time             and then performed model comparisons (M1 vs M2, M2 vs. M3).
point (e.g., at age 3), but had data from other time points within              Comparing models M2 vs M3 allowed us to determine whether
3 SD (e.g., at ages 4 and 5), these values were included. In all, 10            or not improvement in fit was attributable to overall change over
out of 463 (2.16%) data points were removed for neural timing                   time (i.e., growth curve parameter: slope mean), while comparing
analyses, 16 out of 463 (3.46%) for spectral coding, 10 out of 463              M2 vs M1 allowed us to determine whether the improvement in fit
(2.16%) for response stability, and 19 out of 463 (4.10%) for non-              is attributable to individual differences in rates of change (i.e.,
stimulus activity. Across all measures and all years (n = 463 test              growth curve parameter: slope variance).
points), 26 subjects had one outlier datapoint, 4 subjects had two
outlier datapoints, 2 subjects had three outlier datapoints, and 4              2.7. Measures of model fit
subjects had four outlier datapoints. 139 subjects had zero outlier
datapoints. Please see Table 1C for more information regarding                      To determine standardized measures of model fit, the series of
outlier exclusion by year of study.                                             growth models were run a second time through a traditional struc-
   For both spectral coding and nonstimulus activity, values were               tural equation model where fixed ages were used (e.g., Age3 = 3.0,
converted to nanovolts instead of microvolts due to small variance              for all individuals) as the basis coefficients for estimating change
estimates. Structural equation models, like all methods derived                 over time. These indices included the Root Mean Square Error of
from Generalized Linear Model (GLM), are invariant to linear trans-             Approximation (RMSEA), the Comparative Fit Index (CFI), and the
formations; results are the same regardless of metric unit (i.e., if            Tucker-Lewis index (TLI). For a description of these indices please
analyzed in nanovolts, microvolts, etc.). Thus, results for these               see (Hooper et al., 2008). For RMSEA, values less than 0.04 are con-
measures are reported in nanovolts instead of microvolts; to con-               sidered to be an ‘‘excellent” fit, less than 0.07 a ‘‘good” fit, and less
vert the growth curve model estimate values from nanovolts to                   than 0.1 a ‘‘fair” fit (Steiger, 2007); for CFI and TLI, models with an
microvolts, means can be divided by 1  103 and variance terms                  ‘‘excellent” fit are greater than 0.95 (Hu and Bentler, 1999).
by 1  106.                                                                         By running the growth curves through the multi-level struc-
                                                                                tural equation model (with age at test as the basis coefficient)
2.6. Statistical analyses – growth curve modeling                               and traditional structural equation model (with fixed age as the
                                                                                basis coefficient) we can 1) determine the fit of the models with
   For each neurophysiological measure (i.e., neural timing, spec-              greater age specificity to determine precise estimates, and 2) com-
tral coding, response stability, and nonstimulus activity), a series            pare the models using standardized and widely-used ‘‘goodness of
of growth curve models were run to identify the functional form                 fit” indices.
that best represented within- and between-individual changes
(Please see Fig. 2 for path diagram reflecting the structure of                 2.8. Statistical analyses – other
growth curve modeling). The series of growth curve models were
run through a multi-level structural equation model where each                      For each neurophysiological measure, we examined the Intra-
individual’s age at test (e.g., Age3 = 3.57 years) was used as the              class Correlation Coefficient (ICC), q, which reflects the proportion
basis coefficient for estimating change over time. In other words,              of variance in the outcome variable explained by each model’s total
each participant’s precise age at test (e.g., 3.47) is loaded into the          variance. In other words, the ICC allows us to calculate the amount
model as their ‘‘age” for the year they visited the lab, and predic-            of variation unexplained by model predictors and how that relates
tions in the neural measure are made for that exact age. In addition            to overall unexplained variance. In addition, to evaluate the
to accounting for this variance in age, the growth curve models                 collinearity of the neurophysiological measures, we performed a
                                                                         2114
E.C. Thompson, R. Estabrook, J. Krizman et al. Clinical Neurophysiology 132 (2021) 2110–2122
Fig. 2. Path diagram reflecting the structure of the growth curve model used to estimate auditory neurophysiological development over time. Four series of growth curve
models were run; each corresponded to one neural measure of sound processing: neural timing, spectral coding, response stability, and nonstimulus activity. Included in the
models were estimates of intercept (I) and slope (S) means and variances. Constraining intercept values to 1 allowed us to determine the neural measure’s initial status (i.e. at
age 3). Constraining slope values to age of test (Age 3, Age 4, etc.) allowed us to determine linear changes in growth over time.
series of Pearson Correlations controlling for age. Finally, to inves- values, q, for neural timing (q = 0.731) and spectral coding
tigate the influence of sex on auditory neurophysiological develop- (q = 0.670), a moderately-sized ICC value for response stability
ment, growth curve analyses were run including sex as a time- (q = 0.426), and a relatively low ICC value for nonstimulus activity
invariant factor. Because sex was not a significant predictor of (q = 0.294). Given high ICC values indicate high similarity between
growth for the four neurophysiological measures, these results values from the same measure, and low ICC values reflect little to
are excluded from the main text and reported in the Supplemen- no similarity between values from the same measure, these results
tary Appendix. Of note, including sex as a factor revealed overall suggest that neural timing, spectral coding, and response stability
sex differences in each of the four neurophysiological measures, are reliable indices of their respective facet of sound processing,
in that females had FFRs that were faster, more robust in repre- and therefore, how sound processing changes over time.
senting spectral information, more consistent, and less noisy com-
pared to their male peers. As sex differences are not the main focus 3.2. Neural timing development
of this paper, results are provided in the Supplementary Appendix
as well. For a recent report of developmental sex differences in Model comparisons of the latency growth curves show M2 had
subcortical auditory processing, please see (Krizman et al., 2019). the best fit (Table 2). By testing whether or not the addition of the
mean slope parameter significantly improved the growth curve
(M2 vs M3), we found the overall model fit improved (Chi square
3. Results difference test: M2 vs M3, p < 0.01) and had an overall ‘‘fair” fit
based on traditional ‘‘goodness of fit” indices (M2: RMSEA = 0.103,
3.1. Summary CFI = 0.847, TLI = 0.903). In contrast, the addition of the slope vari-
ance parameter (M1) did not significantly improve the model (Chi
Fit statistics and parameter estimates for the series of growth square difference test: M1 vs M2, p = 0.285).
curve models are provided in Table 2 and Table 3, respectively. The model comparisons for Model 2 affirms two of our three
Estimates for the best fitting growth curve model are reported; hypotheses with respect to neural timing: 1) auditory encoding
for all growth curve parameter estimates, please see Supplemen- of neural timing changes across childhood (Mean slope:
tary Appendix Table A.1. Fit statistics for neural timing, spectral Estimate = -0.018, SE = 0.005, p < 0.001) and 2) individual differ-
coding, and response stability growth curve models reflected ences exist in neural timing (Intercept variance: Estimate = 0.037,
appropriately fitting models. For neural timing and response stabil- SE = 0.005, p < 0.001). Because freely estimating slope variance did
ity, the second model (M2) fit best, suggesting these neurophysio- not improve the model (M1 vs M2), our dataset does not support
logical measures improved over time: as children aged, neural the notion that there are individual differences in rates of change
responses became earlier and more consistent. For spectral coding, in neural timing.
the first model (M1) fit best, suggesting frequency representation Model 20 s parameter estimates (Table 3) indicate the average
also improves over time (spectral coding became stronger with latency value of the neural response was 90.744 milliseconds at
age), and that there were individual differences in rates of change. age 3 (Mean intercept: Estimate = 90.744, SE = 0.030, p < 0.001)
We observed relatively high Intraclass Correlation Coefficient (ICC) and became significantly earlier each year by 0.018 milliseconds.
2115E.C. Thompson, R. Estabrook, J. Krizman et al. Clinical Neurophysiology 132 (2021) 2110–2122
Table 2 parameter (Chi square difference test: M1 vs M2, p = 0.006). Model
Fit statistics for the series of growth models for each neurophysiological measure. 1 had an ‘‘excellent” fit based on traditional ‘‘goodness of fit”
Shaded cells reflect fit statistics from the traditional structural equation model where
the basis coefficients for estimating change over time were fixed (e.g., 3.0 for all 3-
indices (M1: RMSEA = 0.04, CFI = 0.970, TLI = 0.979).
year-olds). Measures of model fit included Root Mean Square Error of Approximation The model comparisons affirms our three hypotheses with
(RMSEA), Comparative Fit Index (CFI), and Tucker-Lewis index (TLI). Unshaded cells respect to spectral coding: 1) auditory spectral coding changes
represent model comparisons from the multi-level structural equation model where across childhood (Mean slope: Estimate = 0.318, SE = 0.151,
the basis coefficients for estimating change over time corresponded to age at test (e.g.,
p = 0.035), 2) individual differences in spectral coding exist (Inter-
3.15 years, 3.87, etc.). The multi-level structural equation model comparisons (M1 vs
M2 and M2 vs M3) were performed using Chi-Square Difference Tests based on log cept variance: Estimate = 44.414, SE = 11.633, p < 0.001), and 3)
likelihood values (H0) and scaling correction factors obtained within the MLR individual differences in the development of spectral coding exist
estimator (SCFMLR), and were computed based on the difference test scaling (Slope variance: Estimate = 0.691, SE = 11.633, p < 0.001). Each
correction (cd) and the Chi-Square difference test (TRd) values. Please see Methods individual’s spectral coding starting level is related to developmen-
for more information.
tal changes over time (latent variable covariances of intercept &
M1 M2 M3 slope: Estimate = -4.167, SE = 1.796, p = 0.020), such that lower
NEURAL TIMING spectral coding values at age 3 are associated with greater change
Parameters 6 4 3 in spectral coding over time each year.
RMSEA 0.109 0.103 0.116 Model 10 s parameter estimates indicate the average level of
CFI 0.844 0.847 0.796
spectral coding was 0.017 microvolts at age 3 (Mean intercept:
TLI 0.891 0.903 0.876
–2LL 154.367 153.759 146.458 Estimate = 17.463, SE = 0.848, p < 0.001) and became significantly
H0 154.298 152.649 146.093 larger each year by 0.003 microvolts. Please see Fig. 4 for graphical
SCFMLR 1.332 1.340 1.545 representation of spectral coding development.
M1 vs M2 M2 vs M3
cd 1.316 0.726
TRd 2.507 18.071 3.4. Response stability development
pvalue 0.285 0.000
SPECTRAL CODING Model comparisons of the response stability growth curves
Parameters 6.000 4.000 3.000 show M2 had the best fit. By testing whether or not the addition
RMSEA 0.040 0.054 0.061
of the mean slope parameter significantly improved the growth
CFI 0.970 0.941 0.922
TLI 0.979 0.962 0.953 curve (M2 vs M3), we found the overall model fit improved (Chi
–2LL 1286.537 1290.387 1292.667 square difference test: M2 vs M3, p = 0.03) and was ‘‘excellent”
H0 1286.508 1290.124 1292.666 based on traditional ‘‘goodness of fit” indices (M2: RMSEA = 0.00,
SCFMLR 1.071 1.250 1.232 CFI = 1.00, TLI = 1.055). In contrast, the addition of the slope vari-
M1 vs M2 M2 vs M3
cd 0.715 1.301
ance parameter (M1) did not significantly improve the model (Chi
TRd 10.112 3.907 square difference test: M1 vs M2, p = 0.178).
pvalue 0.006 0.048 Similar to neural timing, the model comparison affirms two of
RESPONSE STABILITY our three hypotheses with respect to response stability: 1) audi-
Parameters 6.000 4.000 3.000 tory response stability changes across childhood development
RMSEA 0.000 0.000 0.000 (Mean slope: Estimate = 0.016, SE = 0.008, p = 0.043) and 2) there
CFI 1.000 1.000 1.000
are individual differences in response stability overall (Intercept
TLI 1.079 1.055 1.020
–2LL 26.454 24.537 22.170 variance: Estimate = 0.025, SE = 0.004, p < 0.001). Because freely
H0 26.218 24.705 22.213 estimating slope variance did not improve the model (M1 vs
SCFMLR 1.049 1.135 1.154 M2), our dataset does not support the notion that there are individ-
M1 vs M2 M2 vs M3 ual differences in response stability rates of change.
Cd 0.878 1.079
TRd 3.446 4.619
Model 20 s parameter estimates indicate the average response
Pvalue 0.178 0.032 stability value was 0.597 at age 3 (Mean intercept: Estimate = 0.597,
NONSTIMULUS ACTIVITY
SE = 0.045, p < 0.001) and became significantly larger each year by
Parameters 6.000 4.000 3.000 0.016 units. Please see Fig. 5 for graphical representation of
RMSEA 0.066 0.067 0.067 response stability development.
CFI 0.576 0.520 0.506
TLI 0.703 0.694 0.699
–2LL 2021.322 2023.341 2024.091 3.5. Nonstimulus activity
H0 2021.440 2023.332 2024.093
SCFMLR 0.690 0.950 0.936 Model comparisons of the nonstimulus activity growth curves
M1 vs M2 M2 vs M3
Cd 0.171 0.993
show M1 had the best fit, despite being a poorly fitting model over-
TRd 22.194 1.533 all (M1: RMSEA = 0.066, CFI = 0.576, TLI = 0.703).
Pvalue 0.000 0.216
3.6. Relationships between neural measures
To determine collinearity between neural measures, we ran a
Please see Fig. 3 for graphical representation of neural timing
series of Pearson’s correlations (Table 4). Controlling for age, weak
development.
relationships were found between nonstimulus activity and neural
timing (r = -0.086), neural timing and response stability (r = -
3.3. Spectral coding development 0.217), and nonstimulus activity and spectral coding (r = 0.158).
Moderate relationships were observed between neural timing
Model comparisons of the spectral coding growth curves show and spectral coding (r = -0.400), spectral coding and response sta-
M1 had the best fit. The addition of the mean slope parameter sig- bility (r = 0.656), and nonstimulus activity and response stability
nificantly improved the growth curve (Chi square difference test: (r = -0.446). No strong correlations (r > 0.7) were evident among
M2 vs M3, p < 0.04), as did the addition of the slope variance the neural measures.
2116E.C. Thompson, R. Estabrook, J. Krizman et al. Clinical Neurophysiology 132 (2021) 2110–2122
Table 3
Parameter estimates of the best fitting growth model for each neurophysiological measure include mean estimate values (Est.), standard errors of the mean (SE), and p-values.
Intercepts reflect estimates at age 3. For example, at age 3, the average latency value was 90.744 ms (±0.3 ms) and decreased by 0.018 (±0.005) per year of age. Please note, for
both spectral coding and nonstimulus activity, results were analyzed in nanovolts instead of microvolts due to small variance estimates. Structural equation models, like all
methods derived from Generalized Linear Model (GLM), are invariant to linear transformations; results are the same if analyzed in nanovolts, microvolts, etc. To convert the
estimate values from nanovolts to microvolts, means are divided by 1 103 and variance terms are divided by 1 106.
NEURAL TIMING SPECTRAL CODING RESPONSE STABILITY NONSTIMULUS ACTIVITY
Model with best fit M2 M1 M2 –
Sample size 175 175 173 175
Slope with Intercept – Est. = 4.167 – Est. = 36.932
SE = 1.796 SE = 12.058
p-value = 0.02 p-value = 0.002
Intercept Mean Est. = 90.744 Est. = 17.463 Est. = 0.597 Est. = 100.942
SE = 0.03 SE = 0.848 SE = 0.045 SE = 3.803
p-value < 0.001 p-value < 0.001 p-value < 0.001 p-value < 0.001
Slope Mean Est. = 0.018 Est. = 0.318 Est. = 0.016 Est. = 0.765
SE = 0.005 SE = 0.151 SE = 0.008 SE = 0.648
p-value < 0.001 p-value = 0.035 p-value = 0.043 p-value = 0.238
Intercept Variance Est. = 0.037 Est. = 44.414 Est. = 0.025 Est. = 441.382
SE = 0.005 SE = 11.633 SE = 0.004 SE = 118.489
p-value < 0.001 p-value < 0.001 p-value < 0.001 p-value < 0.001
Slope Variance – Est. = 0.691 – Est. = 3.351
SE = 0.308 SE = 1.229
p-value = 0.025 p-value = 0.006
Residual Variance Est. = 0.014 Est. = 8.392 Est. = 0.035 Est. = 328.371
SE = 0.002 SE = 1.026 SE = 0.004 SE = 25.262
p-value < 0.001 p-value < 0.001 p-value < 0.001 p-value < 0.001
Fig. 3. Neural timing becomes faster over time within childhood. Plotted are the frequency following responses (FFRs) to speech in the time domain for all children at age 3
(darkest blue, top left) through age 8 (lightest grey, bottom left). Waveforms for the six age points are overlaid on the right.
2117E.C. Thompson, R. Estabrook, J. Krizman et al. Clinical Neurophysiology 132 (2021) 2110–2122
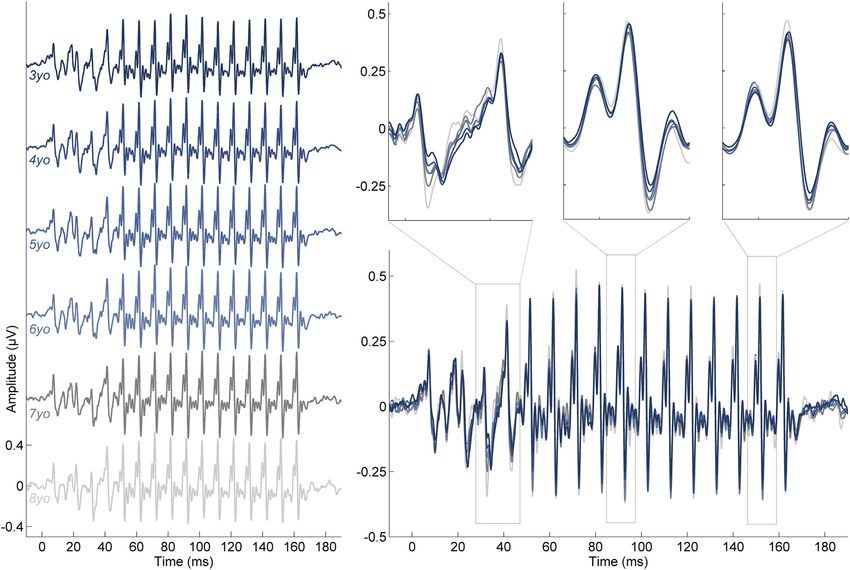
Fig. 4. Spectral coding becomes stronger over time in childhood. Top panel: frequency following responses (FFRs) to speech are plotted in the frequency domain for all
children at age 3 (darkest blue) through age 8 (lightest grey). Bottom panel: spectral amplitudes at each frequency. Please note, the bottom panel’s x-axes are scaled with 40
hertz (Hz) bins centered around each frequency/harmonic of interest [e.g., fundamental frequency (F0) x-axis: 80 Hz to 120 Hz]. Y-axis values are scaled to best illustrate
effects of age.
Fig. 5. Response stability improves over time in childhood. Plotted are two sub-averages (rep 1 and rep 2; 2000 sweeps each) of frequency following responses (FFRs) to
speech. Response stability is calculated by taking the Pearson product-moment correlation coefficient (r) of these two sub-averages.
2118E.C. Thompson, R. Estabrook, J. Krizman et al. Clinical Neurophysiology 132 (2021) 2110–2122
Table 4
Pearson’s correlations between neural measures, controlling for age. Provided are the Pearson correlation coefficients (r) and p-values (p) for each correlation.
Neural timing Spectral coding Response stability Nonstimulus activity
Neural timing – – – –
Spectral coding r = 0.400 – – –
p < 0.001
Response stability r = 0.217 r = 0.656 – –
p < 0.001 p < 0.001
Nonstimulus activity r = 0.086 r = 0.158 r = 0.446 –
p = 0.75 p = 0.001 p = 0.001
4. Discussion Also in line with the psychophysical literature is our finding
that spectral coding changes over the course of early childhood.
4.1. Auditory neurophysiological development evident in childhood In terms of auditory perceptual indices of spectral processing, fre-
quency resolution matures early on, reaching adult-like levels by
Using the novel application of growth curve modeling, we show 6 months of age (Spetner and Olsho, 1990). In contrast, more com-
that the neural processing of speech continues to mature within plex spectral processing matures later in childhood. For example,
individuals over the course of childhood: neurophysiological frequency discrimination, a task that requires one to detect differ-
responses become earlier, more robust, and more stable. In addi- ences in frequency presented successively, matures around age 10
tion to providing longitudinal evidence of central auditory system for low frequency tones (Maxon and Hochberg, 1982). Tasks
development throughout this age range, these results demonstrate requiring detection of frequency and amplitude modulations, cues
there are individual differences in neural processing of various that are important for speech perception, follow a relatively pro-
sound ingredients, and that for some of these ingredients (i.e., longed timeline, such that maturation continues beyond age 12
spectral coding), there are individual differences in how neural (Banai et al., 2011). Task-related differences in maturational trajec-
development unfolds over time. tories illustrate how some perceptual tests draw on fundamental
These findings align with cross-sectional evidence showing cochlear mechanisms (i.e., ‘‘hearing”) that matures early in life,
neurophysiological development of the auditory system. Using while others involve auditory and non-auditory centers that follow
the FFR, age-related differences in neural processing of timing a longer developmental course. Our finding that spectral coding
and frequency information have been observed in infants, 1 to develops throughout childhood suggests that this measure could
3 months of age (Jeng et al., 2010) and 3 to 10 months of age be an index of complex sound processing that offers objectivity
(Anderson et al., 2015), as well as children, ages 3–5 and 8–12 years into the maturation of frequency representation.
(Johnson et al., 2008). In addition, changes in timing and spectral While neural timing and spectral coding have perceptual ana-
coding, as well as response stability and nonstimulus activity occur logs, response stability does not. Response stability is thought to
across the lifespan (Krizman et al., 2019; Skoe et al., 2015). These be an index of how replicable the nervous system represents a
studies show evidence of multiple maturational timelines for mea- stimulus over time (Hornickel and Kraus, 2013; Krizman and
sures of subcortical processing, and that development of these Kraus, 2019), reflecting both the brain’s endurance and reliability
measures continues through late childhood (ages 3–8). Through within a testing session. Although no behavioral indices exist to
our use of a different speech stimulus and a large longitudinal sam- draw a direct comparison, theoretically, response stability might
ple, the present findings reinforce these cross-sectional observa- inform our knowledge of ‘‘internal noise”, or within-individual
tions, yet for the first time show developmental changes are variability. In Signal Detection Theory, one assumption is that ‘‘in-
evident between- and within-individuals. ternal noise” can increase variance in perceptual indices
(MacMillan, 2002). For example, infants are considered ‘‘broad-
band listeners” with more internal noise; over time, internal noise
4.2. Auditory neurophysiological changes parallel perceptual decreases and infants tune in to specific sound features rather than
development rely on a Gestalt representation (Saffran et al., 2007; Werner, 1996;
Werner et al., 2012). After infancy, internal noise in the auditory
These findings also align with psychophysical evidence showing system continues to decrease from childhood to adulthood across
gradual auditory perceptual development over the first decade of a range of tasks, including intensity discrimination (Buss et al.,
life (Sanes and Woolley, 2011). For example, temporal integration, 2006, 2009) and detections of tones in noise (Allen and
one aspect of temporal processing and the process in which infor- Wightman, 1994). In the present study, we see responses become
mation is summed over time, develops through age 6 when tested more consistent over time. This finding could reflect 1) the gradual
with experimental paradigms of duration discrimination (Jensen dissipation of internal noise within childhood, 2) that neural
and Neff, 1993), gap detection (Wightman et al., 1989), and the encoding of stimulus features is more equivalent across trials, or
precedence effect (Litovsky, 1997). Here, we examined temporal 3) both. Future research is needed to further understand this neu-
processing through a measure of neural timing, and found that as rophysiological parameter, and how developmental changes in
children age, processing of sound becomes faster (i.e., earlier laten- response stability may be tied to changes in behavior (e.g., reading
cies). Nervous system timing (latency) is inversely related to white disorders (Hornickel and Kraus, 2013)). Furthermore, while
matter density (Eggermont and Moore, 2012), and latency changes response stability may grossly reflect ‘‘internal noise”, the possibil-
are likely to reflect a rapid increase of axonal myelination through- ity of other noise sources influencing this measure remains. Future
out the auditory system (Moore and Linthicum, 2007). Given the research is necessary to disentangle the contribution of neural
parallel between these two lines of research, and the objectivity from non-neural noise of this parameter specifically, as well as
of the FFR approach, our results corroborate the psychophysical the other measures examined in this study.
evidence. Importantly, we show that sensory processing develops The growth curve model examining the development of non-
without relying on behavioral tests whose interpretation can be stimulus activity fit poorly, perhaps due to a few reasons. First, a
complicated by cognitive influences, such as attention. ‘‘poor fit” of a growth curve might be driven by noisy data, where
2119E.C. Thompson, R. Estabrook, J. Krizman et al. Clinical Neurophysiology 132 (2021) 2110–2122
between- and within-individual changes are too variable to be our longitudinal data was linear, rather than cubic or quadratic.
modeled statistically. Such a result could arise because the mea- In other words, developmental changes occurred steadily and
sure of interest reflects both internal and external noise. Indeed, gradually over time. This result is novel, especially considering
the ICC for nonstimulus activity was relatively weak (q = 0.294), the non-linear developmental path of many skills and behaviors
suggesting this neurophysiological measure reflects more variabil- (e.g., language acquisition) (Bates et al., 1995). Though we do not
ity and/or noise in any given observation relative to the other neu- suspect linear changes to continue throughout the lifespan (cf.
rophysiological measures. One other possible contributor to a Skoe et al. 2015) it is interesting to think of this age range as a lin-
poorly fitting model is multiphasic growth (i.e., more than one ear developmental period.
growth phase). Unfortunately, to determine whether or not a sam- A third and final advantage of growth curve modeling is the sta-
ple follows a multiphasic growth pattern requires a large number tistical determination of individual differences and individual dif-
of subjects, one which exceeds the present sample size. Future ferences in rates of change. Here, we see that there are individual
research should examine how nonstimulus activity relates to gen- differences across the parameters, suggesting auditory processing
eral indices of neural and non-neural noise and should extend the of neural timing, spectral coding, and response stability are likely
sample size to a number sufficient to determine if nonstimulus explained by differences in genetics, environmental factors, etc.
activity development follows a multiphasic—rather than linear– Moreover, individual differences with respect to change were evi-
growth trajectory. dent in spectral coding development, meaning there is more than
one maturational path in this age range. In contrast, we did not
4.3. Investigating neurophysiological development using growth curve see individual differences in rates of change for neural timing or
modeling response stability measures. This is not to say that individual dif-
ferences do not exist; rather, our dataset does not support this
For many years, neurophysiologic development of the auditory result. Future studies are needed to investigate differential rates
system was assessed using the auditory brainstem response, which of change with respect to neural timing and response stability in
is believed to be adult-like by about 18 months (Jerger and Hall, childhood auditory development.
1980). This led to the assumption that the auditory system was One drawback of growth curve modeling is the necessity of a
stable by the second year of life. However, many investigations large sample, which for developmental investigations might prove
in the past few decades have revisited the notion of auditory sys- unrealistic. While we provide results that were sufficiently pow-
tem development, revealing maturation through at least young ered, a greater number of individuals would be needed to investi-
adulthood (Krizman et al., 2019; Ponton et al., 2000; Skoe et al., gate how, and why children develop at distinct rates. To address
2015). While these studies made considerable headway in redefin- the question of whether or not the neural measures reflect distinct
ing the notion of auditory system development, they did so using a processes in our data, Pearson correlations were run to determine
cross-sectional approach, leaving the possibility that between- collinearity. No strong correlations (r > 0.9) were observed
individual changes differ from within-individual changes. Few between the neurophysiological measures at any age group, sug-
examinations have adopted a longitudinal approach to understand gesting these indices reflect distinct features of auditory nervous
within-individual changes in the auditory system, and whether or system function.
not there are individual differences in rates of change. In the pre-
sent study, we use a large sample to provide evidence that rein- 4.4. Links between auditory development & communication skills
forces these cross-sectional examinations, yet shows for the first
time that auditory changes are evident within individuals. Throughout childhood, the auditory system plays a large role in
Neurophysiological data were analyzed using growth curve the acquisition of many communication skills. For example, read-
modeling, a statistical approach that is burgeoning in the fields ing involves mapping sounds to meaning, while speech perception
of social, psychological, and behavioral sciences due to advance- requires parsing relevant from irrelevant information within an
ments in technology and computing. Although the benefits of incoming auditory stream. Strength of auditory-
growth curve modeling are many, the number of neurophysiolog- neurophysiological sound processing is linked to a number of these
ical investigations employing this approach are few. Our novel communication skills. For example, enhancements in temporal and
application of this statistical approach merits a discussion of its spectral coding are related to school-aged children’s ability to hear
advantages and limitations. in noisy environments (Anderson et al., 2010b, 2010a). For
One advantage of growth curve modeling is that it permits the preschool-aged children, development of the fundamental fre-
inclusion of all data points collected on an individual. This is in quency of speech (one frequency included in our spectral coding
contrast to traditional statistical approaches, such as repeated measure) tracks with improvements in hearing in noise
measures analysis of variance, which require a complete dataset (Thompson et al., 2017). Literacy and reading competencies are
for included individuals and therefore excludes those that do not linked to neural stability (Centanni et al., 2014; Hornickel and
meet this requirement. In growth curve modeling, each data point Kraus, 2013), auditory system timing (Ahissar et al., 2000; Banai
adds value to a model, even if data was collected at only one time et al., 2009) and processing of detailed acoustic features such as
point (i.e., cross-sectional) or a subset of those time points (such as consonants (Kraus et al., 1996; Tallal, 1980).
years 1, 2, and 3 in a 4-year study). Though technically not longi- To understand the relationship between neural processing of
tudinal data, individuals with one time point of data add value to sound and clinical disorders, a critical first step is to determine
the growth curve model by informing the distribution of that indi- how these auditory neurophysiological measures mature in a typ-
vidual’s age range that would otherwise not be known. However, ically developing population, with the ultimate goal to improve
while these ‘‘cross-sectional” data points add value to a growth clinical diagnostics and interventions. Given the links between
curve, it is important to note that the relative value is small in com- auditory function and communication, an objective approach like
parison to individuals with multiple time points of data collected; the FFR, could provide a more reliable method for identification
in our case, those with five years’ worth of data added the most and diagnosis of developmental disorders related to reading and
value to the model. language, including developmental dyslexia and specific language
A second advantage of growth curve modeling is the ability to impairment. For example, as an objective index of distinct facets
characterize the functional form of developmental changes, such of auditory maturation, the FFR could reveal aberrant patterns of
as linear or non-linear trends. Here, we see that the growth in development that suggest delays earlier. Future studies should
2120E.C. Thompson, R. Estabrook, J. Krizman et al. Clinical Neurophysiology 132 (2021) 2110–2122
examine deviations in auditory development in clinical popula- Allen P, Wightman F. Psychometric Functions for Children’s Detection of Tones in
Noise. J Speech Lang Hear Res 1994;37:205.
tions, and/or how abnormal auditory system development could
Anderson S, Skoe E, Chandrasekaran B, Kraus N. Neural Timing Is Linked to Speech
contribute to disordered sound processing. Perception in Noise. J Neurosci 2010a;30:4922–6.
Anderson S, Skoe E, Chandrasekaran B, Zecker S, Kraus N. Brainstem correlates of
speech-in-noise perception in children. Hear Res 2010b;270:151–7.
4.5. Future directions Anderson S, Parbery-Clark A, White-Schwoch T, Kraus N. Aging Affects Neural
Precision of Speech Encoding. J Neurosci 2012;32:14156–64.
Participants in this study were monolingual English speakers Anderson S, Parbery-Clark A, White-Schwoch T, Kraus N. Development of
subcortical speech representation in human infants. J Acoust Soc Am
from similar socioeconomic backgrounds, and therefore reflect a 2015;137:3346–55.
small subset of the broader population. Future research should Banai K, Hornickel J, Skoe E, Nicol T, Zecker S, Kraus N. Reading and Subcortical
investigate the influence of second language experience and Auditory Function. Cereb Cortex 2009;19:2699–707.
Banai K, Sabin AT, Wright BA. Separable developmental trajectories for the abilities
socioeconomic standing on the neurophysiological development to detect auditory amplitude and frequency modulation. Hear Res
of the auditory system. This is especially important as previous 2011;280:219–27.
research shows spectral coding, response stability, and nonstimu- Bates E, Dale PS, Thal D. Individual differences and their implications for theories of
language development. In: Fletcher P, MacWhinney B, editors. Handbook of
lus activity vary along socioeconomic dimensions in adolescents Child Language. Oxford: Basil Blackwell; 1995.
(Skoe et al., 2013) and based on language experience (Krizman Bidelman GM. Multichannel recordings of the human brainstem frequency-
et al., 2012; Skoe et al., 2017). Second, future research should following response: Scalp topography, source generators, and distinctions
from the transient ABR. Hear Res 2015;323:68–80.
investigate how performance on language or auditory tests track
Buss E, Hall JW, Grose JH. Development and the role of internal noise in detection
with objective auditory system development, as indexed by the and discrimination thresholds with narrow band stimuli. J Acoust Soc Am
FFR, to determine behavioral consequences of neurophysiological 2006;120:2777–88.
maturation. A third line of future research is the investigation of Buss E, Hall JW, Grose JH. Psychometric functions for pure tone intensity
discrimination: Slope differences in school-aged children and adults. J Acoust
auditory maturation prior to 3 and 4 years of age. While a few Soc Am 2009;125:1050–8.
studies have demonstrated auditory system development evolves Carré R, Divenyi P, Mrayati M. Speech: A dynamic process. Berlin, Boston: De
over the first two years of life, a gap in the literature between Gruyter; 2017.
Centanni TM, Booker AB, Sloan AM, Chen F, Maher BJ, Carraway RS, Khodaparast N,
10 months and 3 years of age remains. A systematic, longitudinal Rennaker R, LoTurco JJ, Kilgard MP. Knockdown of the Dyslexia-Associated Gene
examination is needed to confirm these maturational changes Kiaa0319 Impairs Temporal Responses to Speech Stimuli in Rat Primary
and to fully understand auditory development from the onset. Auditory Cortex. Cereb Cortex 2014;24:1753–66.
Chandrasekaran B, Kraus N. The scalp-recorded brainstem response to speech:
Neural origins and plasticity. Psychophysiology 2010;47:236–46.
Eggermont JJ, Moore JK. Morphological and Functional Development of the Auditory
5. Conclusion
Nervous System. In: Werner L, Fay RR, Popper AN, editors. Human Auditory
Development. New York, NY: Springer New York; 2012. p. 61–105.
Through a large longitudinal dataset analyzed through growth Eggermont JJ, Brown DK, Ponton CW, Kimberley BP. Comparison of Distortion
curve modeling, we observe the sharpening of neurophysiological Product Otoacoustic Emission (DPOAE) and Auditory Brain Stem Response
(ABR) Traveling Wave Delay Measurements Suggests Frequency-Specific
processing of sound within individuals in childhood: neural timing Synapse Maturation. Ear Hear 1996;17:386–94.
became faster, spectral coding stronger, and response stability Frick RW. Communicating emotion: The role of prosodic features. Psychol Bull
more consistent over time. These findings align with the percep- 1985;97:412–29.
Greenberg S, Marsh JT, Brown WS, Smith JC. Neural temporal coding of low pitch. I.
tual and cross-sectional investigations of auditory development, Human frequency-following responses to complex tones. Hear Res
and show that auditory maturation extends into late childhood 1987;25:91–114.
using an objective and longitudinal approach. Hartley DEH, Wright BA, Hogan SC, Moore DR. Age-Related Improvements in
Auditory Backward and Simultaneous Masking in 6- to 10-Year-Old Children. J
Speech Lang Hear Res 2000;43:1402.
Declaration of Competing Interest Hooper D, Coughlan J, Mullen MR. Structural Equation Modelling: Guidelines for
Determining Model Fit. Electron J Bus Res Methods 2008;6:53–60.
Hornickel J, Kraus N. Unstable Representation of Sound: A Biological Marker of
The authors declare that they have no known competing finan- Dyslexia. J Neurosci 2013;33:3500–4.
cial interests or personal relationships that could have appeared Hu L, Bentler PM. Cutoff criteria for fit indexes in covariance structure analysis:
to influence the work reported in this paper. Conventional criteria versus new alternatives. Struct Equ Modeling
1999;6:1–55.
Jeng F-C, Schnabel EA, Dickman BM, Hu J, Li X, Lin C-D, Chung H-K. Early Maturation
Acknowledgements of Frequency-Following Responses to Voice Pitch in Infants with Normal
Hearing. Percept Mot Skills 2010;111:765–84.
Jensen JK, Neff DL. Development of Basic Auditory Discrimination in Preschool
We would like to thank the members of the Auditory Neuro- Children. Psychol Sci 1993;4:104–7.
science Laboratory, past and present, for their contributions to this Jerger J, Hall J. Effects of Age and Sex on Auditory Brainstem Response. Arch
Otolaryngol 1980;106:387–91.
work, and the children and families who participated in this study. Johnson KL, Nicol T, Zecker SG, Kraus N. Developmental Plasticity in the Human
This work was supported by the National Institutes of Health (R01 Auditory Brainstem. J Neurosci 2008;28:4000–7.
HD069414 and F31 DC016205-02). Kraus N, McGee TJ, Carrell TD, Zecker SG, Nicol TG, Koch DB. Auditory
neurophysiologic responses and discrimination deficits in children with
learning problems. Science 1996;273:971–3.
Appendix A. Supplementary material Krishnan A, Xu Y, Gandour JT, Cariani PA. Human frequency-following response:
representation of pitch contours in Chinese tones. Hear Res 2004;189:1–12.
Krishnan A, Xu Y, Gandour J, Cariani P. Encoding of pitch in the human brainstem is
Supplementary data to this article can be found online at sensitive to language experience. Cogn Brain Res 2005;25:161–8.
https://doi.org/10.1016/j.clinph.2021.05.025. Krizman J, Kraus N. Analyzing the FFR: A tutorial for decoding the richness of
auditory function. Hear Res 2019;382 107779.
Krizman J, Marian V, Shook A, Skoe E, Kraus N. Subcortical encoding of sound is
References enhanced in bilinguals and relates to executive function advantages. Proc Natl
Acad Sci 2012;109:7877–81.
Krizman J, Bonacina S, Kraus N. Sex differences in subcortical auditory processing
Abdala C, Keefe DH. Effects of middle-ear immaturity on distortion product
emerge across development. Hear Res 2019;380:166–74.
otoacoustic emission suppression tuning in infant ears. J Acoust Soc Am
Krizman J, Lindley T, Bonacina S, Colegrove D, White-Schwoch T, Kraus N. Play
2006;120:3832–42.
Sports for a Quieter Brain: Evidence From Division I Collegiate Athletes. Sports
Ahissar M, Protopapas A, Reid M, Merzenich MM. Auditory processing parallels
Health 2020;12:154–8.
reading abilities in adults. Proc Natl Acad Sci USA 2000;97:6832–7.
Lavigne-Rebillard M, Pujol R. Surface aspects of the developing human organ of
Aiken SJ, Picton TW. Envelope and spectral frequency-following responses to vowel
Corti. Acta Oto-Laryngol Suppl 1987;436:43–50.
sounds. Hear Res 2008;245:35–47.
2121You can also read