Classification of plant communities in the Caspian Hyrcanian English yew (Taxus baccata L.) forests using environmental factors: testing the ...
←
→
Page content transcription
If your browser does not render page correctly, please read the page content below
Volume 6 (1): 57-78 (2022) (http://www.wildlife-biodiversity.com/)
                                                                                                                     Research Article

Classification of plant communities in the Caspian Hyrcanian
English yew (Taxus baccata L.) forests using environmental
factors: testing the modified TWINSPAN method
Zahra Kalantari1, Mehdi Heydari1*, Omid Esmailzadeh2, Hamed Asadi3, Bernard
Prévosto4
1
 Department of Forest Science, College of Agriculture, Ilam University, Ilam, Iran.
2
 Department of Forestry, Faculty of Natural Resources and Marine Sciences,Tarbiat Modares University,
Noor, Iran
3
 Department of Forestry, Faculty of Natural Resources, Sari Agricultural Sciences and Natural Resources
University, Sari, Iran
4
 INRAE, Aix Marseille Univ., UR RECOVER, Mediterranean Ecosystems and Risks, Aix-en-Provence,
France.
*
 Email: m_heydari23@yahoo.com
Received: 26 January 2022 / Revised: 17 February 2022 / Accepted: 19 March 2022/ Published online: 05 April 2022. Ministry of Sciences,
Research, and Technology, Arak University, Iran.

How to cite: Kalantari, Z., Heydari, M., Esmailzadeh, O., Asadi. H., Prévosto, B. (2022). Classification of plant communities in the Caspian Hyrcanian
English yew (Taxus baccata L.) forests using environmental factors: testing the modified TWINSPAN method, 6(1), 57-78. https://doi.org/
10.22120/jwb.2022.543338.1479

Abstract
Hyrcanian forests in northern Iran are one of the world's precious deciduous broadleaved forest
ecosystems but are subjected to increasing disturbances mostly of anthropogenic origin. In this
context, it is necessary to assess the existing vegetation and its relation to environmental factors in
order to establish a scientific reference for conservation measures. The purpose of this research is to
evaluate the quality of the modified and classical TWINSPAN (Two-way indicator species analysis)
classification based on the environmental factors to identify the plant communities of Taxus baccata
L. forests of Golestan Province (Northern Iran). Fifty 400-m2 plots were systematically selected along
an elevation gradient in the Taxus baccata forests. In each plot, the soil was sampled using a
composite sample of three replicates taken to a depth of 20 cm. All vascular species were recorded
58 | Journal of Wildlife and Biodiversity 6(1): 57-78 (2022)

on each plot according to Braun-Blanquet’s method. In total, 56 plant species belonging to 48 genera
and 34 families were recorded in spring 2018. The comparison of the results of modified and classical
TWINSPAN showed that the modified TWINSPAN did not change the classification logic, but
introduced more flexibility in the hierarchy of the division. It was also found that the compliance rate
of the results provided by the classical TWINSPAN method was lower than the modified method.
Using modified TWINSPAN, Detrended correspondence analysis (DCA), and Redundancy analysis
(RDA), we determined four floristic groups in the Taxus baccata habitat. The first (Carpinus betulus)
and second (Taxus baccata) groups were located at low altitudes and soil contents in silt and clay
were higher than in the other groups. In contrast, the third (Quercus castaneifolia) and the fourth
(Juniperus communis) groups were located next to each other at higher altitudes and southwestern
aspects, on steeper slopes and soils that exhibited a high pH and a high sand content. We found close
relationships between the distribution of vegetation groups of Taxus baccata habitat with edaphic and
physiographic factors using the RDA method. To conclude, the modified TWINSPAN offers a more
efficient and flexible method to identify vegetation communities. This is the first step to implementing
future management and ecological restoration measures in habitats of high ecological value such as
yew forests.
Keywords: Environmental filtering, Ecological species group, DCA, Forest

Introduction
There is a close relationship between the vegetation composition of the ecosystem and the functioning
of the different components of this ecosystem (Lavorel and Garnier, 2002; Vilàet al., 2011).
Therefore, the classification and ordination of forest habitats and the study of the relationship between
vegetation and environmental factors with different appropriate techniques (Woldewahid et al., 2007;
Adams et al., 2019) is of major interest to ecologists around the world. In fact, these studies aim at
providing valuable information for the management, protection, and regeneration of plant species,
especially rare and endangered species (Adel et al., 2014; Siben et al., 2016; Al Harthy and Grenyer,
2019). They are especially needed for areas with high ecological importance such as the northern
forests of Iran. These forests known as Hyrcanian mixed forests, are one of the world's unique
deciduous broad-leaved forest ecosystems (Pejman, et al., 2018; Kooch et al., 2015) and are similar
to broad-leaved forests typical of Central Europe (Marvie-Mohadjer, 2006). They are the habitat of
endemic and rare species, some of which have a global reputation (Naqinezhad et al., 2012) and have
a prominent place in terms of species diversity, economic, social, soil conservation, and carbon
59 | Journal of Wildlife and Biodiversity 6(1): 57-78 (2022)

sequestration (Amirnejad et al., 2006; Adel et al., 2013; Moghimian et al., 2013). The yew (Taxus
baccata L.) occurs throughout the temperate zone of the Northern Hemisp re and is one of the native
needle-leaf species, which naturally grows in these forests (Gegechkori et al., 2018). The assessment
of the Taxus baccata and its habitat is of major importance due to the highly prominent position of
this species in terms of dendrochronology, long-living, extinction, very low regeneration, and
extensive geographic distribution in the world (Keunecke et al., 2008; Benham et al., 2016).
Among all the techniques used to assess plant communities’ classification, the modified TWINSPAN
method has been proposed in recent years as an efficient tool for the classification of vegetation
(Roleček et al., 2009). In this method, the separation of homogeneous groups is avoided at higher
levels of classification. At each level, the group with the highest heterogeneity is divided into two
groups, and the other groups are transferred to the next level without change (Uğurlu et al., 2012;
Davydova et al., 2019). Therefore, the number of groups (clusters) in this method, unlike the classical
TWINSPAN method, does not necessarily increase in powers of two. So, in this method, the
researcher can create a cluster or group as desired. In other words, the modified TWINSPAN method
has more flexibility in choosing the groups in the classical method.
For instance, in Beech forests of northern Iran, Adel et al. (2014) investigated the relationship between
plant ecological groups and environmental factors using Canonical Correspondence Analysis (CCA),
Detrended Correspondence Analysis (DCA), and TWINSPAN techniques. They showed that
elevation, slope, aspect, nitrogen, phosphorus, potassium, salinity, acidity, and soil texture played
significant roles in the segregation of plant ecological species groups. Similarly, Bazdid Vahdati et
al. (2014) using the modified TWINSPAN method in a temperate deciduous forest in northern Iran
showed that slope, aspect, elevation, soil texture, and organic matter were the most effective factors
in the segregation of ecological species groups. They also showed that the species diversity of
ecological groups was decreasing with increasing elevation. Mirzaei et al. (2017), using classical
TWINSPAN and CCA, segregated four ecological species groups in oak forests in Iran based on plant
composition and physiographic and soil factors, and indicated that among these groups, regeneration
of woody species has a different distribution.
The main objective of this study is to test the modified TWINSPAN method in the classification of
ecological groups of Taxus baccata stands using environmental factors. More specifically, we have
compared this method with the classical TWINSPAN method, which is currently the most widely
used method (Roleček et al., 2009; Kim et al., 2016; Mirzaei et al., 2017). The classification was
applied to the Taxus baccata forests as so far few studies have been provided on the vegetation
60 | Journal of Wildlife and Biodiversity 6(1): 57-78 (2022)

composition of this valuable habitat submitted to increasing anthropogenic pressure. The objectives
of this study are 1) identify the ecological species group of the Taxus baccata habitat based on
physiographic characteristics and physical and chemical properties of the soil, 2) compare the results
given by the modified TWINSPAN method with the classical method.

Materials and methods
Study area
The studied site (118 ha) is located in Aliabad-e-Katul County in Golestan Province (north of Iran).
This area is dominated by a mixed deciduous forest but also offers one of the largest collections of
Taxus baccata in the world (Fig. 1). The elevation ranges from 1200 to 1650 m a.s.l. and the slope
from 30º to 85º. Slope aspects were mainly north- and south-facing. The dominant species is Taxus
baccata accompanied by many other woody species such as Carpinus betulus, C. schuschaensis,
Quercus castaneifolia, Juniperus communis, Prunus avium, Tilia rubra, and Cornus australis. The
dominant type of humus in these sites is a carbonate and lime-rich humus. Soil pH varies from 7 to
7.5 in the first upper layer. The average annual temperature is 17.9 ° C and the average annual
precipitation is 415 mm. According to the long-term climatic data (2007–2018) of the nearest
meteorological station to the study area (≤4 km, Aliabad-e-Katul station), the driest month is July
with rainfall of 8 mm. In March, the precipitation peaks at an average of 77 mm. August and January
are the hottest and coldest months with average temperatures of 28.3 °C and 8.5 °C, respectively.

                 Figure 1. The study area location in Iran and Golestan Province
61 | Journal of Wildlife and Biodiversity 6(1): 57-78 (2022) Experimental design and data collection We used nine transects approximately 500–1500 meters long located along the elevation gradient (perpendicular to the contour lines). In order to best capture the variation of vegetation and environmental factors along the elevation gradient, we sampled a total of 50 square plots (20 m × 20 m) distributed at intervals of 200 and 400 m from each other along the transects. In each plot, environmental properties slope, aspect, elevation, and geographic location were recorded. For the aspect, we applied the transformation proposed by Dobrović et al. (2006) and coded it from 0 to 2. Abundance and dominance for each species were estimated using the Braun-Blanquet scale (Müller- Dombois and Ellenberg, 1974) during the period of peak vegetative growth (i.e. spring 2018), and each species was identified according to the available literature (Ghahraman, 2000; Rechinger, 1963-2010). In order to investigate the relationship between soil factors and plant communities of the habitat, three soil subsamples were collected in each plot at a depth 0–20 cm using a 5 cm diameter auger and mixed to form one composite soil sample. Soil samples were air-dried and sieved to 2 mm. For each sample, we measured soil organic carbon (SOC) by dichromate oxidation using the Walkley- Black method (Nelson and Sommers, 1982), and total N by Kjeldahl digestion (Bremner, 1996). Soil pH was measured electrometrically (in H2O, 2:1 v/m) and soil texture was measured using a hydrometer (Bouyoucos, 1962). Statistical analysis In this study, the modified TWINSPAN method (Roleček et al., 2009) was used for the classification and identification of the groups of the Taxus baccata vegetation database (using the Juice software package (Tichý, 2002). In this study, the degree of heterogeneity in each cluster is calculated using the total inertia (Greenacre, 2000). DCA analysis was used to determine the range of species variation along with the ordination (Gauch and Hill, 1980). To determine the relationship between vegetation composition and environmental factors, a Redundancy Analysis (RDA) was used with regard to the DCA axis length. (
62 | Journal of Wildlife and Biodiversity 6(1): 57-78 (2022)
the species’ fidelity to the specific group is determined (Dai et al., 2006). In this analysis, the
introduction of the indicator species of each group is done based on the Indicator Values Model or
IVM developed by Dufrene and Legendre in 1997 and obtained by equation (3) (McCune and
Mefford, 1999).
equation 1
equation 2
equation 3
Where IVjk= Indicator value of J species in the group; Ajk=Abundance of j species in group k; Fjk=
Frequency of j species in group k; RAjk= Relative abundance of j species in group k; RFjk= Relative
frequency of j species in group K; nk = number of species in the group k; n= total number of species
Composition and structure of plant communities, especially in mountainous areas, are largely
controlled by topographic and soil characteristics (e.g. Pielech et al., 2015; Dearborn et al., 2017;
Mirzaei et al., 2017). Therefore, we used cluster analyses based on a large set of various
environmental factors to evaluate the quality of the modified and classical TWINSPAN (Esmailzadeh
et al., 2015). In this regard, the Chi-square goodness-of-fit test (χ2) and tests of independence in the
contingency table were used to evaluate the compliance of each TWINSPAN method with the cluster
analysis grouping results. Also, the Kappa coefficient was used to evaluate the compliance rate.
Cluster analysis was performed using the Euclidean distance coefficient and Ward's method in PC-
ORD software version 4. In the cluster analysis, an equivalent level was considered for increasing the
similarity with the TWINSPAN grouping. Differences in physiographic and soil variables between
ecological groups were assessed by one-way ANOVA test and Duncan's multiple range post hoc test
was used for mean comparison. The normality of data was assessed using the Kolmogorov-Smirnov
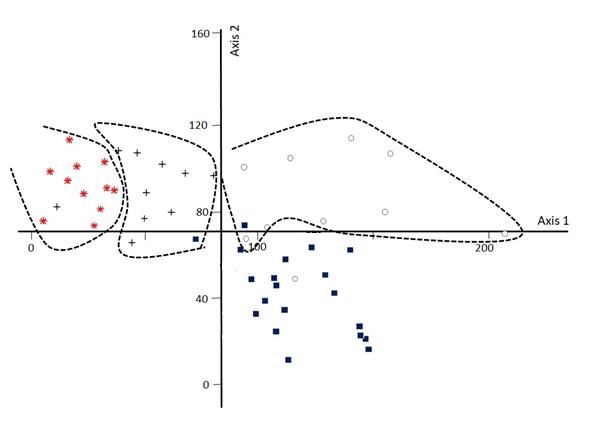
test. These analyses were performed using the SPSS version 21 software.63 | Journal of Wildlife and Biodiversity 6(1): 57-78 (2022) Results Using the classical TWINSPAN analysis, four clusters were produced based on the percentage cover values of 56 plant species transformed using four cut levels (Fig 2 a). Also, in the classification of ecological species groups of habitats, four primary ecological groups at the fourth cut-off level were identified and separated using the modified TWINSPAN method based on the total variance function (Fig. 2 b). The presentation of the plots and ecological groups derived from the modified TWINSPAN classification method in the DCA ordination diagram (Fig. 3) showed that the plots of the four groups of modified TWINSPAN in DCA analysis have their own margin and are distinct from each other. The comparison of compliance rates of the dendrograms produced by the modified and the classical TWINSPAN classifications with cluster analysis (based on environmental factors) showed that the weighted compliance rates of the former (43.57 %) were higher than that of the later (16.69 %) (Fig 4 a, b and Table 1). Figure 2. Classification dendrogram of units of habitat by classical TWINSPAN analysis (a) and modified TWINSPAN analysis (b); : group 1, : group 2, : group 3, : group 4.
64 | Journal of Wildlife and Biodiversity 6(1): 57-78 (2022)

Besides, the assessment of compliance rates of the results of the two methods of modified
TWINSPAN classification and cluster analysis, based on the results of the adaptive table and the Chi-
square goodness-of-fit test (χ2 = 20.77), showed that the results of the two classification methods with
a probability of 95% were not independent, and coincided with each other. In this regard, the
compliance rate of the two methods based on the Kappa coefficient was estimated to be 63.8% (Table
2). However, according to the results of the Chi-square goodness-of-fit test (χ2 = 20.89) and kappa
agreement criterion (K = 11.80), it was found that the compliance rate of the cluster analysis with the
classical TWINSPAN method was lower than the modified TWINSPAN method (Table 2).

Figure 3. Diagram of sample plots of the units derived from the modified TWINSPAN method in
DCA ordination; : group 1, : group 2, : group 3, : group 4;               : margin of groups; Axis 1
(Percentages of variance= 28; Eigenvalue = 0.67) and Axis 2 (Percentages of variance= 19; Eigenvalue
= 0.46)
65 | Journal of Wildlife and Biodiversity 6(1): 57-78 (2022)

Figure 4. Cluster analysis dendrogram based on environmental factors and groups introduced by
modified TWINSPAN (a) and classical TWINSPAN (b)
66 | Journal of Wildlife and Biodiversity 6(1): 57-78 (2022)

Table 1. Membership of the sample plots, in the classified groups of clustering method based on
environmental factors and modified TWINSPAN method (weighted average of compliance
percentage= 43.57 %) and classical TWINSPAN (weighted average of compliance percentage= 16.69
%)
                                    Groups             Number                  Groups of cluster analysis                 Percentage of
    Methods                                            of plots                                                            compliance
                                                                    Group 1      Group 2       Group 3      Group 4

                                    Group 1               10            4           0             3            3               40

                                    Group 2               19            2           6             0           11              31.57
                     TWINSPAN
Modified

                                    Group 3               10            1           2             3            4               30

                                    Group 4               11            0           0             3            8              72.72
                                                                                                                          Mean= 43.57 %
                                    Group 1               15            0           1             5            9                0
Classical TWINSPAN

                                    Group 2               9             1           1             3            4              11.11

                                    Group 3               11            4           0             1            6                9

                                    Group 4               15            2           6             0            7              46.66
                                                                                                                          Mean= 16.69 %

Table 2. Kappa coefficient and Spearman correlation for determining compliance rate and the
correlation of cluster analysis (based on environmental factors) and modified and classical
TWINSPAN methods (compliance and correlation at 95% level)
                                Method                            Kappa coefficient= 0.638                         SE           Sig
                     Modified and TWINSPAN                                                                         0.08      0.001 **
                                                                     Spearman rank correlation coefficient= 0.290*
                          Classical TWINSPAN                      Kappa coefficient= 0.118                         0.06      0.133 NS
                                                                   Spearman rank correlation coefficient= 0.214 NS
                                      ** Significant at 99% level, * at 95% normal level and NS: non- Significant

Indicator species
The results showed that there were 15 indicator species based on the segregated groups in modified
TWINSPAN in the Taxus baccata habitat (Table 3). Accordingly, in groups 1 to 4, we found that
four, five, two and four species respectively were significant indicators of the site (Table 3).
In the first group, indicator species were Carpinus betulus L., Ulmus glabra Huds., Prunus avium L.
and Tilia rubra DC. subsp.; in the second group Polystichum aculeatum L., Rubus hyrcanus Juz.,
Sorbus torminalis (L.) Crantz, Salvia glutinosa L., and Taxus baccata L.; in the third group, Primula
heterochroma Stapf. and Quercus castaneifolia C.A. Mey., and in the fourth group; Lithospermum
officinale L., Juniperus communis L., Cornus australis C.A. Mey., and Carpinus schuschaensis H.J.P.
67 | Journal of Wildlife and Biodiversity 6(1): 57-78 (2022) Winkl. In contrast, we found only 11 indicator species based on the separated groups in the classical TWINSPAN method in the Taxus baccata habitat. Accordingly, in groups 1 to 4, the significant species were respectively four, zero, three, and four (Table 3). Table 3. Indicator value of species for the segregated groups by classical and modified TWINSPAN. Monte Carlo test of significance (P) of observed maximum (max) indicator value in each group for each species; P-values underlined are
68 | Journal of Wildlife and Biodiversity 6(1): 57-78 (2022)
Polystichum aculeatum 4 27.8 0.017 2 19.1 0.040
Primula heterochroma 4 10.5 0.522 3 34.3 0.022
Prunus avium 1 10.5 0.557 1 27.7 0.033
Pyrus boissieriana 4 3.3 1 4 18.2 0.126
Quercus castaneifolia 1 6.7 0.33 3 31 0.041
Quercus macranthera 1 31 0.106 3 19.3 0.13
Rubus hyrcanus 1 6.7 1 2 10 0.040
Salvia glutinosa 4 21.7 0.042 2 36.8 0.004
Sanicula europea 4 3.2 0.121 2 41.9 0.013
Sigesbeckia orientalis 4 30 0.139 3 30 0.147
Solanum kieseritzkii 4 6.7 1 2 5.3 1
Sorbus torminalis 4 8.9 0.08 2 36.8 0.007
Stellaria holostea 2 23.1 0.06 3 7.5 0.823
Stellaria holostea 3 7.9 0.641 2 15.8 0.268
Taxus baccata 3 9.1 0.375 2 31 0.040
Tilia rubra 3 28.4 0.04 1 30.3 0.001
Ulmus glabra 4 34.4 0.005 1 42.4 0.006
Vicia crocea 4 6.7 0.06 2 21.1 0.087
Viola alba 2 8.2 0.364 4 18.2 0.116
Anthriscus sylvestris 4 30.3 0.195 2 22.4 0.704
In the first group, the indicator species were Carpinus schuschaensis H.J.P.Winkl., Cornus australis
C.A. Mey., Festuca drymeja Mert. & W.D.J. Koch and Juniperus communis L.; in the third group
Acer velutinum Boiss., Carpinus betulus L. and Tilia rubra DC. and in the fourth group, Danae
racemosa (L.) Moench, Polystichum aculeatum (L.) Roth ex Mert., Salvia glutinosa L., and Ulmus
glabra Huds. Therefore, the composition and the number of species in each group dramatically
changed between the two methods (Table 3).
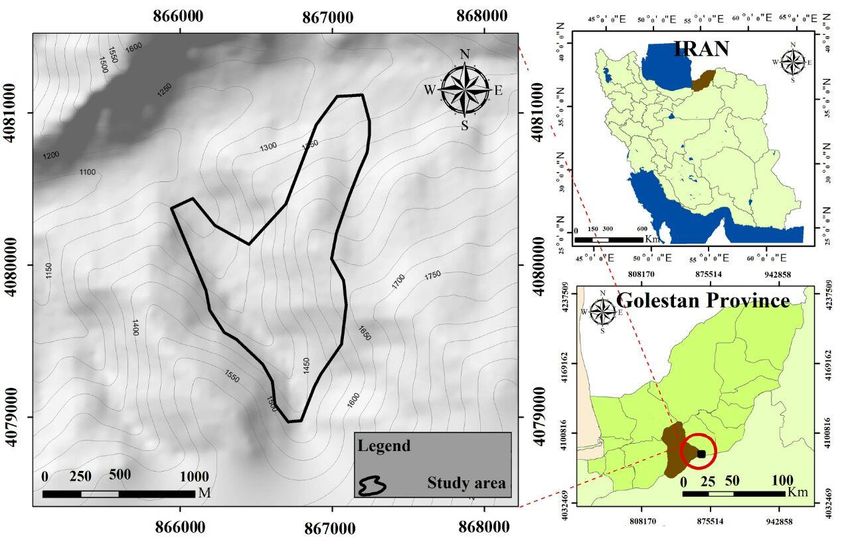
Redundancy Analysis (RDA)
Due to the fact that the DCA gradient length for the first axis is 2.6 and 1.58 (less than 3) for the
second axis, then the RDA analysis was used (Lepš and Šmilauer, 2003). The results of applying
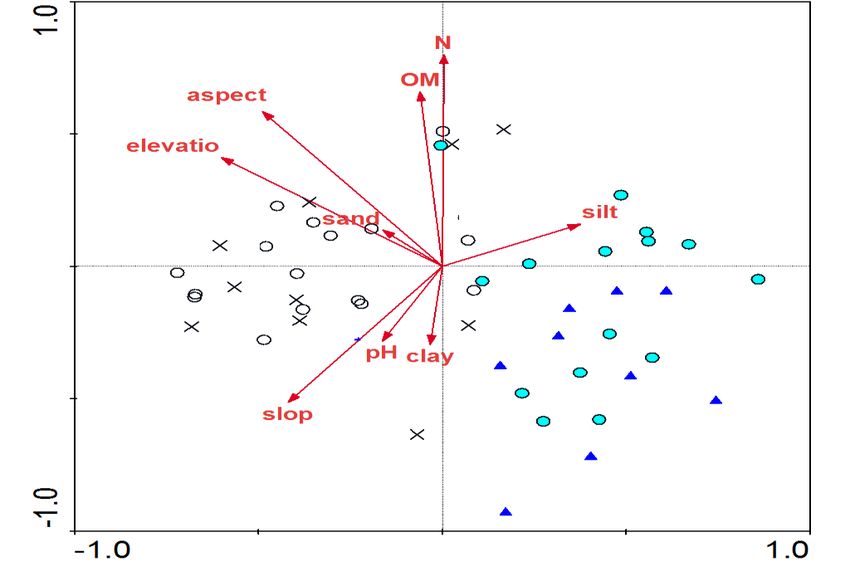
RDA based on the cut-off level 2 of vegetation in plots and soil characteristics were shown in figure
5. According to this analysis (Fig. 5a), the first (Carpinus betulus) and second (Taxus baccata) groups
were located at low altitudes and their soil contents in silt and clay were higher. In contrast, the third
(Quercus castaneifolia) groups were located close to each other at higher altitudes and in
southwestern aspects with a higher soil pH, and on steeper slopes. The Redundancy Analysis (RDA)
showed a good correlation between the species composition and the environmental factors. In the first
group, indicator species were Carpinus betulus, Prunus avium, and Tilia rubra; in the second group
Polystichum aculeatum, Rubus hyrcanus, Salvia glutinosa, and Taxus baccata; in the third group,69 | Journal of Wildlife and Biodiversity 6(1): 57-78 (2022)
Primula heterochroma, Quercus castaneifolia, and in the fourth group; Lithospermum officinalis,
Juniperus communis, Cornus-australis, and Carpinus schuschaensis (Fig. 5b).
a)
b
Figure 5. Results of RDA analysis based on vegetation and environmental characteristics: distribution
of plots across the first and second axes (a) and indicator plant species composition (b) based on
modified TWINSPAN separated groups ( : group 1, : group 2, : group 3, and : group 4);
Note: Species in a colored frame are the indicator species of groups
Comparison of soil properties and physiographic factors between the ecological groups
Variations of soil properties and physiographic factors significantly differed between the different
ecological groups. Soil contents in clay and silt were the highest in the first and second groups (23.470 | Journal of Wildlife and Biodiversity 6(1): 57-78 (2022)
to 22.6 % and 25.5 to 26.1 % respectively)) and the lowest in the third and fourth groups (19.2 to 17.6
% and 21 to 24.4% respectively). The reverse trend was observed for soil content in the sand (from
51% in groups 1 and 2 to 59.7-58% in groups 3 and 4). The elevation was also higher in the third
(1449 m) and fourth (1444 m) groups than in the first (1326 m) and second (1371 m) groups. The
slope was steepest in the fourth group (80.9 %) while no significant difference was observed in the
other groups (from 58.5 to 64.5%). The azimuthal directions for the four groups (1 to 4) were south,
west, southwest, and southeast, respectively (Table 4).
Table 4. Comparison of physiographic and soil characteristics of the habitat species groups based
on Duncan test; ** significant at 1% level; * significant at 5% level; non-identical letters indicate
the difference between the mean values of the investigated 6 factors among the regions.
Separated groups
Variables Carpinus betulus Taxus baccata Quercus castaneifolia Juniperus communis Sig
group (1) group (2) group (3) group (4)
Mean ± se Mean ± se Mean ± se Mean ± se
Total nitrogen )mg kg-1( 0.51 ± 0.04 0.59 ± 0.03 0.51 ± 0.04 0.54 ± 0.02 0.296 NS
pH )1:1 H2O( 7.57± 0.13 7.72 ± 0.13 7.76± 0.03 7.68± 0.02 0.280 NS
Organic matter )%( 13.98 ± 1.36 16.50 ± 1.05 16.46 ± 1.72 14.57± 0.79 0.416NS
Sand )%( 51.10± 1.24 b 51.30. ±2.68 b 59.70 ± 3.27 a 58.00± 2.30 a 0.001**
Silt )%( 25.50± 0.80 a 26.10 ± 0.57 a 21.00 ± 0.28 b 24.36± 0. 70 ab 0.003**
Clay )%( 23.40± 0.68 a 22.60 ± 0.56 a 19.20 ± 20.20 b 17.63 ± 1.60 b 0.007**
Elevation )m( 1326.13 ± 24.80b 1371± 8.27 b 1449.18 ± 28.62 a 1444.50 ± 19.13 a 0.000**
Slope )%( 58.50± 12.84 b 61.50 ± 10.32 b 64.50 ± 9.11 b 80.90 ± 13.14 a 0.03*
Aspect )°( 270.11 ± 0.13 a 183.02 ± 0.13 b 258.23 ± 0.03 a 224.13± .0.02 a 0.000**
** Significant at 1% level, * Significant at 5% level, Non-identical letters indicate the difference
between the mean values of the investigated factors among the regions.
Discussion
The results of this study show that the first and second axes of the DCA method represent
approximately 47% of the variation of vegetation composition in the habitat. This high cumulative
percentage indicates that the differences or similarities of the groups in terms of floristic composition71 | Journal of Wildlife and Biodiversity 6(1): 57-78 (2022) were accurately described. The modified TWINSPAN method does not change the hierarchical classification principles but modifies and improves the order of hierarchy divisions within the final classification of the dendrogram (Rolečeket al., 2009). In fact, after applying the modified TWINSPAN method in the DCA analysis, the results show that the different ecological groups and the indicator species of each of the ecological groups are clearly identified. This distinction not only reflects the differences in the floristic composition and in the environmental characteristics but also shows that there is an acceptable agreement between the results of the classification and the ordination of the ecological groups. The number of groups in this method is not necessarily in binary (i.e. the group with the highest heterogeneity will be divided into two groups) and the quality of classification and the flexibility of the method are increased (Tichy et al., 2007; Lötteret al., 2013; Świerkoszet al., 2014). The comparison of classification by TWINSPAN modified based on vegetation composition and cluster analysis based on environmental factors (soil and physiography), as well as the comparison of TWINSPAN modified with classical TWINSPAN (Adel et al., 2018), show that the modified TWINSPAN method has a higher efficiency in ecological species grouping and classification of forest habitats. The cluster analysis based on environmental factors can be suitable to evaluate the accuracy of the results of the two methods of TWINSPAN. The vegetation features, such as composition and structure in different terrestrial ecosystems, especially in mountainous areas, are largely controlled by topographic and soil attributes (Kirkpatrick et al., 2014; Pielech et al., 2015; Mirzaei et al., 2017). For example, the combination of aspect and slope is related to the amount of energy received from the sun. This factor along with other environmental variables such as soil texture and soil depth also largely influence soil moisture content (He et al., 2007). All these factors play a key role in the distribution of plant communities, plant growth, and vegetation dynamics and are always considered of major importance in vegetation ecological studies (Burton et al., 2011; Apaza‐ Quevedo et al., 2015; Chapman et al., 2018). The composition and the number of species in each group dramatically changed between the two methods. The higher number of indicator species in the groups derived from the modified TWINSPAN method still indicates the higher efficiency of this method in the studied habitat. This clearly represents an additional asset of this method as the indicator species reflect environmental conditions and have therefore high values in the assessment of habitats (Heydari et al., 2016). Based on the redundancy analysis, the composition of vegetation in the Taxus baccata habitat can be divided into four groups based on environmental factors. The first (Carpinus betulus, Prunus avium, and Tilia rubra) and second (Taxus baccata) groups are located at low elevation and their soil contents
72 | Journal of Wildlife and Biodiversity 6(1): 57-78 (2022)

in silt and clay are higher than the other groups (see Table 4). The first and second groups only differ
in the aspect as the former is southwest-oriented whereas the later is south-oriented. Esmailzadeh et
al. (2007) also pointed to the presence of Taxus baccata and Carpinus betulus in the same sites and
explained that this community is found on areas with a slope of less than 70 percent. In fact, Taxus
baccata grows in various soil conditions (Thomas and Polwart, 2003), but its growth is enhanced in
clay-silt sedimentary soils. In contrast, growth is reduced in poor acidicand waterloggingg soils as
this species is quite nutrient-demanding in potassium, phosphorus, and calcium (Vidaković, 1991).
In line with our results Gegechkori (2018) indicated that, although Taxus baccata tolerates a wide
range of soils, it is most likely found in calcareous soils with a high lime content. In fact, we found
that Taxus baccata trees are dominant in the second ecological group i.e. in south-facing sites
benefiting of a warmer climate and on on soils with a high percentage of clay and silt-clay that have
the potential to store more moisture and nutrients. Consistent with our results Gegechkori (2018)
stated yew's dispersal ability is limited by low temperatures in the north. The presence of Taxus
baccata has been recorded a with long a wide altitudinal range in different countries of temperate
Eurasia (from 660–1000 m a.s.l. in South Slovakia to 2000–2500 m a.s.l. in Northern Africa and
Okhachkue, W. Georgia) but mostly around 1400 m a.s.l. in Iran (Thomas and Polwart, 2003) as also
found in this study. Borji et al. (2018) also noted that southwestern slopes (mean slope 41%) on soils
with a high percentage of silt are conditions favorable to the habitat of Carpinus betulus, and this
finding is consistent with our results. In contrast, the third and fourth groups are located at higher
altitudes on steeper southwestern slopes and on soils with a higher pH and sand content (Table 4). In
these groups, the main indicator species are Juniperus communis, Festuca drymeja, Quercus
castaneifolia, and Cornus australis. The presence of these species is correlated to the main habitat
characteristics in particular the environmental conditions as well as past and present biotic factors
(Muller-Dombois and Ellenberg, 1974; Grabherr et al., 2003). More precisely, the presence of
Juniperus communis in high and sloping highlands, as well as in sandy and shallow soil conditions,
has also been confirmed in other studies (García et al., 2000; García and Zamora, 2003; Thomas et
al., 2007). The presence of Quercus castaneifolia is also reported in highlands (Sagheb-Talebi et al.,
2014) which is consistent with the results of this research. The perennial grass Festuca drymeja found
in this study, is known to tolerate harsh conditions such as steep slopes and shallow soils (Tomaselli
et al., 2000). For instance, Esmailzadeh et al. (2007) also noted the presence of Festuca drymeja and
Juniperus communis in high-altitude communities on steep slopes in the Taxus baccata habitat. The
73 | Journal of Wildlife and Biodiversity 6(1): 57-78 (2022)

first and second groups are located close to each other at low elevation and their indicator species are
representative of heavy soils with high clay and silt contents.

Conclusion
The habitat vegetation assessment by the modified TWINSPAN method not only does not change the
logic of classification but also makes it more flexible in the division hierarchy than the other methods.
Besides, the compliance rate of the results of the cluster analysis produced by the classical
TWINSPAN method was lower than the modified TWINSPAN method. The representation of sample
plots and ecological groups derived from the modified TWINSPAN classification method in DCA-
ordination shows that the plots of the four groups of modified TWINSPAN in DCA- ordination are
more clearly separated. This indicates a more homogenous composition among each group whereas
the differences in floristic composition between groups are maximized. Redundancy Analysis (RDA)
also shows that there is high compliance between the distribution of indicator species and segregated
groups of modified TWINSPAN. Besides, the results of the RDA integrating the environmental
factors show that the differences between groups are more linked to the physiographic factors (in
particular, altitude, slope and exposure) than to the soil properties. Applying the TWINSPAN
modified method to the classification of the yew habitats enabled us to identify four ecological groups
which are closely related to some key environmental conditions. In particular, variations in aspects
(from southwest to southeast), slope steepness and soil texture are major factors shaping the
vegetation composition of these habitats. Classification of plant communities with efficient methods
reflecting vegetation composition and abiotic factors is a first step to implementing future
management measures of such habitats of high ecological value.

Acknowledgments
We are grateful to the Ilam University for its financial support

References
Adams, B.T., Matthews, S.N., Peters, M.P., Prasad, A. and Iverson, L.R., 2019. Mapping floristic
    gradients of forest composition using an ordination-regression approach with landsat OLI and
    terrain data in the Central Hardwoods region. Forest ecology and management, 434, pp.87-98.
74 | Journal of Wildlife and Biodiversity 6(1): 57-78 (2022)
Adel, M.N., Pourbabaei, H. and Dey, D.C., 2014. Ecological species group—Environmental factors
relationships in unharvested beech forests in the north of Iran. Ecological engineering, 69, pp.1-
7.
Adel, M.N., Pourbabaei, H., Omidi, A. and Dey, D.C., 2013. Forest structure and woody plant
species composition after a wildfire in beech forests in the north of Iran. Journal of Forestry
Research, 24(2), pp.255-262
Adel, M.N., Pourbabaei, H., Salehi, A., Alavi, S.J. and Dey, D.C., 2018. Structure, composition and
regeneration of riparian forest along an altitudinal gradient in northern Iran. Folia geobotanica,
53(1), pp.63-75.
Al Harthy, L. and Grenyer, R., 2019. Classification and ordination of the main plant communities
of the Eastern Hajar Mountains, Oman. Journal of Arid Environments, 169, pp.1-18.
Amirnejad, H., Khalilian, S., Assareh, M.H. and Ahmadian, M., 2006. Estimating the existence
value of north forests of Iran by using a contingent valuation method. Ecological Economics,
58(4), pp.665-675.
Apaza‐Quevedo, A., Lippok, D., Hensen, I., Schleuning, M. and Both, S., 2015. Elevation,
topography, and edge effects drive functional composition of woody plant species in tropical
montane forests. Biotropica, 47(4), pp.449-458.
Bazdid Vahdati, F., 2014. Floristic characteristics of the Hyrcanian submountain forests (case study:
Ata-Kuh forest). Caspian Journal of Environmental Sciences, 12(2), pp.169-183.
Benham, S.E., Houston Durrant, T., Caudullo, G. and de Rigo, D., 2016. Taxus baccata in Europe:
distribution, habitat, usage and threats. European Atlas of Forest Tree Species. Publ. Off. EU,
Luxembourg, pp e015921.
Borji, M., Ravanbakhsh, H., Hamzeh’ee, B. Amiri, M. and Kianian, M.K. 2018. A comparison of
environmental and vegetation variables between Carpinus betulus and C. schuschaensis stands
in Naghibdeh and Mazdeh forests (Sari, Mazandaran) and introducing a new hornbeam
association. Iranian Journal of Forest and Poplar Research. 26 (2), pp. 189-21.
Bouyoucos, G.J., 1962. Hydrometer method improved for making particle size analyses of soils 1.
Agronomy journal, 54(5), pp.464-465.
Bremner, J.M., 1996. Nitrogen–total. In ‘Methods of soil analyses, part 3, Chemical methods’.(Ed.
DL Sparks) pp. 1085–1122. Soil Science Society of America and American Society of
Agronomy: Madison, WI, USA.75 | Journal of Wildlife and Biodiversity 6(1): 57-78 (2022)
Burton, J.I., Mladenoff, D.J., Clayton, M.K. and Forrester, J.A., 2011. The roles of environmental
filtering and colonization in the fine‐scale spatial patterning of ground‐layer plant communities
in north temperate deciduous forests. Journal of Ecology, 99(3), pp.764-776.
Chapman, J. and McEwan, R., 2018. The Role of Environmental Filtering in Structuring
Appalachian Tree Communities: Topographic Influences on Functional Diversity Are Mediated
through Soil Characteristics. Forests, 9(1), p.19.
Davydova, A.O., Ponomarеva, A.A. and Davydov, D.A., 2019. Investigation of vegetation as a
precondition for improving the management of a national nature park (on the example of
Dzharylhatskyi NP). Biosystems Diversity, 27(1), pp.69-75.
Dearborn, K.D. and Danby, R.K., 2017. Aspect and slope influence plant community composition
more than elevation across forest–tundra ecotones in subarctic Canada. Journal of vegetation
science, 28(3), pp.595-604.
Dobrović, I., Safner, T., Jelaska, S.D. and Nikolić, T., 2006. Ecological and phytosociological
characteristics of the association Abieti-Fagetum» pannonicum «Rau {1969 prov. on Mt.
Medvednica (NW Croatia). Acta Botanica Croatica, 65(1), pp.41-55.
Dufrêne, M. and Legendre, P., 1997. Species assemblages and indicator species: the need for a
flexible asymmetrical approach. Ecological monographs, 67(3), pp.345-366.
Esmailzadeh, O., Hosseini, S. M. and Tabari, M. 2007. A Phytosociological Study of English Yew
(Taxus baccata L.) In Afratakhteh Reserve. Pajouhesh and Sazandegi, 74, pp: 17-24
García, D. and Zamora, R., 2003. Persistence, multiple demographic strategies and conservation in
long‐lived Mediterranean plants. Journal of Vegetation Science, 14(6), pp.921-926.
García, D., Zamora, R., Gómez, J.M., Jordano, P. and Hódar, J.A., 2000. Geographical variation in
seed production, predation and abortion in Juniperus communis throughout its range in Europe.
Journal of Ecology, 88(3), pp.435-446.
Gegechkori, A., 2018. Patterns of distribution and survival of European yew (Taxus baccata L.) in
an alpine tree line ecotone in the Greater Caucasus (Georgia). Annals of Agrarian Science, 16
(2), pp.170-176.
Ghahraman, A., 2000. Colored flora of Iran. Research Institute of Forests and Rangelands, Tehran,
Iran.
Grabherr, G., Reiter, K. and Willner, W., 2003. Towards objectivity in vegetation classification: the
example of the Austrian forests. Plant Ecology, 169(1), pp.21-34.76 | Journal of Wildlife and Biodiversity 6(1): 57-78 (2022)
Greenacre, M., 2000. Correspondence analysis of square asymmetric matrices. Journal of the Royal
Statistical Society: Series C (Applied Statistics), 49(3), pp.297-310.
He, M. Z., Zheng, J. G., Li, X. R. and Qian, Y. L. 2007. Environmental factors affecting vegetation
composition in the Alxa Plateau, China. Journal of Arid Environments 69 (3), pp. 473-489.
Heydari, M., Faramarzi, M. and Pothier, D., 2016. Post-fire recovery of herbaceous species
composition and diversity, and soil quality indicators one year after wildfire in a semi-arid oak
woodland. Ecological Engineering, 94, pp.688-697.
Heydari, M., Prévosto, B., Abdi, T., Mirzaei, J., Mirab-Balou, M., Rostami, N., Khosravi, M. and
Pothier, D., 2017. Establishment of oak seedlings in historically disturbed sites: Regeneration
success as a function of stand structure and soil characteristics. Ecological Engineering, 107,
pp.172-182.
Hill, M.O. and Gauch, H.G., 1980. Detrended correspondence analysis: an improved ordination
technique. In Classification and ordination (pp. 47-58). Springer, Dordrecht.
Keunecke, D., Hering, S. and Niemz, P., 2008. Three-dimensional elastic behaviour of common
yew and Norway spruce. Wood science and technology, 42(8), pp.633-647.
Kim, M.H., Park, C.M. and Jang, K.K., 2016. An analysis of correlation between Pinus thunbergii
forests and soil conditions by TWINSPAN and CCA ordination in west coast of South Korea.
Journal of the Korea Society of Environmental Restoration Technology, 19(1), pp.45-59.
Kirkpatrick, J.B., Green, K., Bridle, K.L. and Venn, S.E., 2014. Patterns of variation in Australian
alpine soils and their relationships to parent material, vegetation formation, climate and
topography. Catena, 121, pp.186-194.
Kooch, Y., Hosseini, S.M., Scharenbroch, B.C., Hojjati, S.M. and Mohammadi, J., 2015.
Pedodiversity in the Caspian forests of Iran. Geoderma Regional, 5, pp.4-14.
Lavorel, S. and Garnier, É., 2002. Predicting changes in community composition and ecosystem
functioning from plant traits: revisiting the Holy Grail. Functional ecology, 16(5), pp.545-556.
Lötter, M., Mucina, L. and Witkowski, E., 2013. The classification conundrum: species fidelity as
leading criterion in search of a rigorous method to classify a complex forest data set.
Community Ecology, 14(1), pp.121-132.
Marvie-Mohadjer, M.R., 2006. Silviculture. University of Tehran Press, Tehran, Iran,pp. 387.
McCune, B. and Mefford, M.J., 1999. PC-ORD: multivariate analysis of ecological data; Version 4
for Windows;[User's Guide]. MjM software design.77 | Journal of Wildlife and Biodiversity 6(1): 57-78 (2022)
Mirzaei, J., Heydari, M. and Bernard, P., 2017. Effects of vegetation patterns and environmental
factors on woody regeneration in semi-arid oak-dominated forests of western Iran. Journal of
Arid Land, 9(3), pp.368-378.
Moghimian, N., Habashi, H. and Kooch, Y., 2013. Influence of windthrow events on soil carbon
sequestration and fertility status at local scales-A case study in Hyrcanian forest. European
Journal of Experimental Biology, 3(3), pp.160-167.
Mueller-Dombois, D. and Ellenberg, H., 1974. Aims and methods of vegetation ecology. Wiley.
Naqinezhad, A., Bahari, S.H., Gholizadeh, H., Esmaeili, R., Hamzeh’ee, B., Djamali, M. and
Moradi, H., 2012. A phytosociological survey of two lowland Caspian (Hyrcanian) remnant
forests, Northern Iran, for validation of some forest syntaxa. Phytol Balc, 18(2), pp.173-186.
Nelson, D.W. and Sommers, L., 1982. Total carbon, organic carbon, and organic matter 1. Methods
of soil analysis. Part 2. Chemical and microbiological properties, (methodsofsoilan2), pp.539-
579.
Pejman, P., Majid, H. and Sadeghzadeh, H.M.H., 2018. Gap characteristics under oriental beech
forest development stages in Kelardasht forests, northern Iran. Journal of Forest Science, 64(2),
pp.59-65.
Pielech, R., Anioł-Kwiatkowska, J. and Szczęśniak, E., 2015. Landscape-scale factors driving plant
species composition in mountain streamside and spring riparian forests. Forest Ecology and
Management, 347, pp.217-227.
Rechinger, K. H. (ed.) 1963-2010. Flora Iranica, 1-178. Akademsiche Druck- u. Verlagsanstalt und
Naturhistorisches Museum Wien. Graz & Wien.
Roleček, J., Tichý, L., Zelený, D. and Chytrý, M., 2009. Modified TWINSPAN classification in
which the hierarchy respects cluster heterogeneity. Journal of Vegetation science, 20(4),
pp.596-602.
Sagheb-Talebi, K., Pourhashemi, M. and Sajedi, T., 2014. Forests of Iran: A Treasure from the Past,
a Hope for the Future. Springer.
Sieben, E.J.J., Collins, N.B., Mtshali, H. and Venter, C.E., 2016. The vegetation of inland wetlands
with salt-tolerant vegetation in South Africa: description, classification and explanatory
environmental factors. South African journal of botany, 104, pp.199-207.
Świerkosz, K., Reczyńska, K. and Boublík, K., 2014. Variability of Abies alba-dominated forests
in Central Europe. Central European Journal of Biology, 9(5), pp.495-518.78 | Journal of Wildlife and Biodiversity 6(1): 57-78 (2022)
ter Braak, C.J. and Smilauer, P., 1998. CANOCO reference manual and user's guide to Canoco for
Windows: software for canonical community ordination (version 4).
Thomas, P.A. and Polwart, A., 2003. Taxus baccata L. Journal of Ecology, 91(3), pp.489-524.
Thomas, P.A., El‐Barghathi, M. and Polwart, A., 2007. Biological flora of the British Isles:
Juniperus communis L. Journal of Ecology, 95(6), pp.1404-1440.
Tichý, L., 2002. JUICE, software for vegetation classification. Journal of vegetation science, 13(3),
pp.451-453.
Tomaselli, M., Rossi, G. and Dowgiallo, G., 2000. Phytosociology and ecology of the Festuca
puccinellii-grasslands in the northern Apennines (N-Italy). Botanica Helvetica, 110(2), pp.125-
149.
Uğurlu, E., Roleček, J. and Bergmeier, E., 2012. Oak woodland vegetation of T urkey–a first
overview based on multivariate statistics. Applied Vegetation Science, 15(4), pp.590-608.
Vidaković, M., 1991. Conifers: morphology and variation. Grafičko Zavod Hrvatske.
Vilà, M., Espinar, J.L., Hejda, M., Hulme, P.E., Jarošík, V., Maron, J.L., Pergl, J., Schaffner, U.,
Sun, Y. and Pyšek, P., 2011. Ecological impacts of invasive alien plants: a meta‐analysis of
their effects on species, communities and ecosystems. Ecology letters, 14(7), pp.702-708.
Woldewahid, G., van der Werf, W., Sykora, K., Abate, T., Mostofa, B. and Van Huis, A., 2007.
Description of plant communities on the Red Sea coastal plain of Sudan. Journal of arid
environments, 68(1), pp.113-131.You can also read