CID Discussion Paper 2022-1 - Shauna Dyer & Giovanni Román-Torres Latina/o Postsecondary Education: Trends in Racial/Ethnic Education Gaps and the ...
←
→
Page content transcription
If your browser does not render page correctly, please read the page content below
CID Discussion Paper 2022-1

Shauna Dyer & Giovanni Román-Torres
Latina/o Postsecondary Education: Trends in
Racial/Ethnic Education Gaps and the Role
of Citizenship in Access to Higher Education

 February 2022
 www.inequalitydynamics.org
Latina/o Postsecondary Education: Trends in Racial/Ethnic Education Gaps and the Role

of Citizenship in Access to Higher Education

Shauna Dyer1 and Giovanni Román-Torres 1

ABSTRACT

Black-Latina/o and White-Latina/o bachelor’s degree gaps persist despite substantial increases in
Latina/o educational attainment since the late 1950s. The Latina/o population has grown rapidly
in recent decades and currently comprises over 20% of the United States population. However,
barriers to citizenship have grown in tandem, and these barriers have limited access to higher
education. Using data from the U.S. Census (1950-2010) and the ACS (2015-2017), we examine
trends in Black-Latina/o and White-Latina/o college completion gaps and factors that may
explain them. We find that college enrollment differences explain the majority of the bachelor’s
degree gaps. We then decompose enrollment gaps by differences in enrollment by citizenship.
We find that if Latina/os had the same citizenship rates as the White and Black populations, the
Black-Latina/o enrollment gaps would effectively disappear, and the White-Latina/os enrollment
gaps would be reduced by up to 75%. Our findings indicate that the Latina/o population's
relatively low college completion rates can partially be explained by restricted access to
citizenship. The high proportion of Latina/o non-citizens has also masked the considerable
educational progress Latina/o citizens have made in recent decades.

Keywords: Education, Race/Ethnicity, Immigration, Citizenship

This research was supported in part by the NAEd/Spencer Foundation Dissertation Fellowship, an NICHD
center grant (P2CHD041028) and an NICHD training grant (T32HD007339) to the Population Studies Center
at the University of Michigan.

This material is based upon work supported by the National Science Foundation Graduate Research
Fellowship Program. Any opinions, findings, and conclusions or recommendations expressed in this material
are those of the author(s) and do not necessarily reflect the views of the National Science Foundation

The authors thank Deirdre Bloome, Davis Daumler, Lauren Duquette-Rury, Elly Field, Erin Ice, Garrett Pace,
Fabian Pfeffer, the Stone Center for Inequality Dynamics, and members of the Inequality, Demography and
Family Workshop for valuable comments on this paper. Earlier versions of this paper were presented at the
annual meeting of the American Sociological Association in New York City.

1
 Population Studies Center, University of Michigan, 426 Thompson Street, Ann Arbor, MI 48104
Corresponding Author: Shauna Dyer, sldyer@umich.edu, 541-914-6861
INTRODUCTION

 Education continues to be a major source of social and economic stratification in the United

States, and as inequality has increased over the last several decades, so has the importance of

higher education (Baum et al. 2013; Goldin and Katz 2009, 2020; Hout 2012). Despite substantial

increases in Latina/o 2 educational attainment since the late 1950s, Latina/os continue to have lower

bachelor’s degree rates than Black and White men and women (Ma et al. 2019; National

Academies 2015; Hirschman 2016). The Latina/o population has grown rapidly in recent decades

and currently comprises approximately 20% of the U.S. population (U.S. Census 2019). Given the

many benefits associated with a college degree, it is critical to understand why such a large

proportion of the population lags behind their peers (Baum 2014; Brand and Xie 2010; Oreopoulos

and Petronijevic 2013).

 A wide-ranging body of literature has looked at factors that influence college completion

from family and neighborhood poverty to first generation college student status (Alvarado 2016;

Engle and Tinto 2008; Fletcher and Tienda 2010). Factors particularly salient for the Latina/o

population are low high school graduation rates, lack of academic preparation among high school

graduates, and limited local college choices, all of which decrease the likelihood that Latina/os

will finish a bachelor’s degree (Alon et al. 2010; Desmond and Turley 2009; Gándara and

Mordechay 2017). Recent research has also identified lower college enrollment among non-

citizen Latina/o youth in comparison to citizens as an additional explanation for Latina/os

uniquely low educational attainment (Hirschman 2016; Patler 2018).

2For clarity in the remainder of this paper, we use Latina/o to refer to the broader Latina/o population while we use
Latina or Latino to address each gender.

 1
However, we still do not know a great deal about trends in Black-Latina/o and White-

Latina/o bachelor’s degree gaps such as when they arose and how persistent they have been. It is

also difficult to discern why Latina/o educational attainment is lower relative to other

racial/ethnic groups, such as the Black population, who share a similar set of disadvantages as

well as other types of historical and current disadvantages that do not negatively impact the

Latina/o community in the same way (O’Connell 2012; Wilson 2008). Moreover, we do not

know the proximate drivers of these education gaps nor how they have varied over time as

Latina/os have experienced different structural constraints and opportunities that might shape

college enrollment and college completion once enrolled, including access to citizenship.

 This study addresses these unknowns by using U.S. Census data from 1950-2010 and the

American Community Survey data from 2015-2017. With Census data that has been optimally

adjusted to capture the full Latina/o population prior to 1980, we first examine trends in the

racial/ethnic gap between Latina/os and their Black and White peers to see how inequalities have

developed and varied over time (Gratton and Guttman 2000). Second, we reveal the relative

importance of differences in college enrollment versus differences in college completion among

individuals who enroll to explain Black-Latina/o and White-Latina/o bachelor’s degree gap

trends. Finally, we examine how citizenship differences explain Black-Latina/o and White-

Latina/o college enrollment gaps. We examine Latinas and Latinos separately because,

historically, they have had different migration patterns as well as different cultural and familial

expectations placed on them (Feliciano and Rumbaut 2005; Garip 2012; Ovink 2014). We

exclude Asian and other racial/ethnic groups from the analysis, because they also have had very

different immigration histories in comparison to Latina/os, although we encourage future

research on these important populations (see Discussion section on future work).

 2
With these analyses, we draw attention to the importance of access to college, here

measured by enrollment in college, for explaining racial/ethnic bachelor’s degree gaps. Further,

we focus on citizenship as one explanation for White-Latina/o and Black-Latina/o enrollment

differences observed in this study. The negative consequences of being a non-citizen and the

associated benefits of citizenship has been studied in several contexts (Abrego 2006; Cebulko

2014; Ku and Matani 2001; Young et al. 2018). Differences in outcomes between citizens and

non-citizens are especially salient in the Latina/o community because it has become more difficult

in recent years to gain citizenship (Gonzalez-Barrera 2017). Citizenship provides security and

stability that allows for future planning (Cebulko 2014). It also conveys social advantages that

have social and legal implications for membership inclusion/exclusion and access to resources

such as social services and federal financial aid (Bean et al. 2015). Indeed, Patler labeled these

benefits the “citizenship advantage” in her recent study of high school completion and college

enrollment among California young adults (2018). It is, therefore, likely that citizenship

differences explain a significant proportion of Black-Latina/o and White-Latina/o education gaps,

and that these differences have become more important over time.

 We organize the paper into three parts. Part I examines trends in Black-Latina/o and

White-Latina/o bachelor’s degree gaps among the U.S population for ages 25 to 29, separately

among men and women. We find that these gaps were quite small or non-existent in 1950, grew

substantially over time, peaked in 2010, and as of 2017, had begun to narrow. This narrowing is

due to more rapid growth in Latina/o college completion in comparison to Black and White men

and women. In Part II, drawing upon McDaniel et al.’s study of White and Black gender gaps in

educational attainment, we examine how differences in college enrollment versus college

completion given enrollment explain Black-Latina/o and White-Latina/o bachelor’s degree gaps

 3
(2011). We find that differences in enrollment rates explain the majority of these bachelor’s

degree gaps, with some variation over time. We also find that Latina/os and Black men and

women consistently have very similar (and low) college completion given enrollment rates.

 Finally, in Part III, we draw upon Patler’s (2018) work on the citizenship advantage and

Hsin and Ortega’s (2018) study of DACA and educational outcomes to examine college

completion trends by Latina/o citizenship rates. We first examine trends in Latina/o college

enrollment and college completion given enrollment by citizenship status. We find that while

citizenship appears to have become more important for college enrollment among Latina/os,

college completion given enrollment is nearly the same for both citizens and non-citizens. We

then decompose Black-Latina/o and White-Latina/o college enrollment gaps by enrollment

differences among citizens and non-citizens and differences in citizenship rates. White-Latina/o

differences in citizen’s college enrollment rates explained the majority of observed enrollment

gaps in early decades, but these differences declined substantially over time while citizenship

rate differences have increasingly explained the majority of enrollment gaps since 1990.

Citizenship differences explain nearly all Black-Latina/o enrollment gaps in every decade, and in

some years, over-explains gaps. This over-explanation means that, if Latina/os had the same

citizenship rates of Black men and women, Latina/os would have higher college enrollment rates

relative to their Black peers.

 We conclude that the Latina/o population's relatively low college completion rates are

best understood as reflecting reduced access to college, and that restrictive citizenship policies

have played a significant limiting role in Latina/o access to postsecondary education. We also

find that the large proportion of Latina/o non-citizens in the United States during certain decades

masked the substantial educational progress that Latina/o citizens have made. Drawing attention

 4
to enrollment is important for researchers looking at where inequalities are magnified and where

we can intervene as policymakers. Drawing attention to citizenship also helps us think about the

unique structural constraints different groups face.

BACKGROUND

LATINA/O EARLY EDUCATION AND COLLEGE PREPARTION

 Three interrelated forces are frequently cited to explain the low college education rates of

Latina/os relative to other racial/ethnic groups: socio-economic background, academic

preparation, and cultural expectations (frequently moderated by gender) (Fraga et al 2010; Fry

2002; Hirschman 2016; Saenz et al. 2007). Latina/o children are more likely to grow up in low-

income households, have parents who have less than a high school diploma, seasonally migrate

with parents who work in agriculture, and live in mixed citizenship status families in comparison

to White and Black families (Bean et. al. 2015; Warren 1996; Salis-Reyes and Nora 2012;

Rodriguez 2016). They are also more likely to live in low-income neighborhoods with low

resourced schools than White children (National Center for Education Statistics 2020).

 These early disparities follow Latina/o children throughout elementary school and into high

school and result in lower academic preparation in comparison to White and Black students

(Arbona and Nora 2007; Fry 2002; Kanno and Varghese, 2010). Historically, Latina/os have had

lower high school completion rates in comparison to their White and Black peers, limiting their

college eligibility (Donato, Menchaca, and Valencia 1991; Hirschman 2016). In 2000, 87% of the

Black population and 94% of White population ages 25 to 29, had a high school diploma compared

to 63% of Latina/os, although there are striking nativity differences: 56% of foreign-born Latina/os

held diplomas versus 80% of U.S. born Latina/os (Driscoll et al. 2001).

 5
Examining high school students in the Pacific Northwest, Hirschman found that college

pathways not only vary among Latina/o high schoolers, but they also vary by generations: foreign

born Latina/os reported lower levels of college aspirations and expectations than native born

(second generation) Latina/os (2016). A recent report also found that foreign born Latina/os enter

the United States with some of the lowest years of schooling compared to other foreign-born

groups (National Academy of Sciences 2015). Despite differences across generations, in general,

educational expectations remain high for both parents and students and are not substantively

different from White and Black families’ expectations (Schneider et al. 2006; Patler 2018).

 Beyond academic disadvantages and immigration, cultural expectations, mediated by

gender, have been theorized to predict college outcomes. Familismo is often used by scholars to

describe the strong feelings of family loyalty and responsibility among Latina/os and is also closely

tied to traditional gender roles and expectations (Desmond and Turley 2009; Sabogal et al. 1987).

For Latinos, familismo may mean that while their parents are supportive of their sons’ pursuits of

higher education, young Latinos feel a great deal of pressure to provide financial support for the

family very early in adulthood (Saenz and Ponjuan 2008; 2012). For Latinas, in contrast, familismo

might push Latinas into college because their families expect them to be both educationally and

financially successful to help support the family later in life (Ovink 2014). Finally, during certain

time periods, young men migrated to the United States in greater numbers than women (Garip

2012; Parrado and Flippen 2005; Gordon 2005). These young men often immigrated to the U.S.

to find employment, not go to school (Pew Hispanic Center 2005; Garip 2012).

 Based upon these literatures, we hypothesize the following:

 Hypothesis 1a: Latina/os will consistently have lower bachelor’s degree rates than Black
 and White men and women, but White-Latina/o bachelor’s degree gaps will be
 consistently larger than Black-Latina/o degree gaps throughout the study time period.

 6
Hypothesis 1b: While Latina/os will share similar bachelor’s degree trends, on average,
 Latinas will have higher bachelor’s degree rates relative to Latinos.

COLLEGE ENROLLMENT AND COMPLETION ONCE ENROLLED

 While Latina/os struggle with disadvantages in early education and college preparation,

there are also a variety of factors that contribute to lower college enrollment and completion once

enrolled. Latina/os wrestle with the usual challenges facing disadvantaged college students

because they are more likely to be first-generation college students, come from low-income

families, and attend low-resourced colleges than their more advantaged peers (Nora and Crisp

2009). Latina/o students also express strong preferences to live at home during college, and

Latina/o students’ homes are generally closer to two-year colleges that have low transfer and

completion rates than they are to four-year colleges (Brint and Karabel 1989; Hogan and Perrucci

2020; Desmond and Turley 2009; Murphy and Murphy 2018). Latina/os are also more likely to be

employed while in school and to work more hours than the average college student which is

associated with an increased risk of dropping out (Nuñez 2009).3

 However, they share many of these disadvantages with other disadvantaged groups,

notably Black women and men who perform better in terms of college enrollment. This might

appear perplexing, but there are reasons to explain why Black men and women enroll in college at

higher rates. Black students graduate from high school at higher rates and take more college

preparatory classes than Latina/os leaving more Black students better qualified for college (Brindis

et al. 2002; Perna 2000). Additionally, the early establishment of Historic Black Colleges and the

3
 In addition, Latina/os college students are more likely to delay college enrollment in comparison to their White
peers, which has also been shown to reduce college persistence (Bozick and DeLuca 2005; Horn et al. 1995; Nora and
Crisp 2009; Snyder et al. 2008).

 7
long time focus on education to combat racism has likely contributed to Black men and women’s

relatively high rates of college enrollment (Bennett and Xie 2003; U.S. Department of Education

1991). Indeed, various studies have shown that Black men and women are more likely to attend

college than even White students net of socioeconomic characteristics (Alexander et al. 1987;

Bennett and Xie 2003; Rivkin 1995).

 However, it is not clear why Black students would perform better in college once enrolled

than Latina/o students. Black college students share many of the same challenges as Latina/o

students. They are also likely to come from low-income families and be first generation students

(Nora and Crisp 2009). Although Latina/o students are more likely to enroll in community

colleges, Black students are more likely to enroll in for-profit colleges (Cottom 2017). These

institutions are much more expensive than community colleges and yet have similar graduation

rates (CAPSEE 2018). Finally, the Black community have historical and current disadvantages

that Latina/os do not such as slavery, Jim Crow, and continuing anti-Black racism (Boutte and

Bryan 2019; O’Connell 2012).

 Based on these literatures, we hypothesize the following:

 Hypothesis 2a: Enrollment differences will explain a larger proportion of the Black-
 Latina/o and White-Latina/o bachelor’s degree gaps than differences in college
 completion given enrollment.

 Hypothesis 2b: Enrollment differences will explain a larger proportion of Black-Latina/o
 bachelor’s degree gaps than White-Latina/o college degree gaps.

 8
THE BURDEN OF NON-CITIZENSHIP

 Latina/os are the largest immigrant population in the United States,4 and the history of

Latina/o immigration to the United States as well as recent immigration patterns have been

documented in detail.5 Latina/os have the lowest naturalization rates among all immigrant

subpopulations (Pew Research Center 2020), and this has likely had a negative impact on

Latina/o’s access to postsecondary education. It has also become increasingly difficult to gain

citizenship over time, therefore, citizenship has also likely become increasingly important

explanation for college enrollment differences in comparison to Black and White men and women

(Bloemraad 2006; Cohn 2015; Gonzalez-Barrera 2017; Hainmueler et al. 2018; Massey et al. 2015;

Patler 2018)

 Although aspirations for college do not vary by citizenship, high school dropout rates and

college enrollment do (Greenman and Hall 2013; Patler 2018). Because non-citizen youth are

vulnerable to deportation, they are more likely to feel the precariousness and insecurity of their

position in comparison to citizens, and it appears to impact their academic preparation and their

success in college (Abrego 2006). Additionally, non-citizenship status can be disruptive to life-

course transitions from childhood to adulthood by requiring non-citizens to navigate hostile and

anti-immigrant contexts (Garcia 2020; Gonzalez 2011).

 Citizens are eligible for federal financial aid, in-state tuition at public universities, and do

not have to fear deportation (Oliverez et al. 2006). 6 The importance of citizenship is reflected in

4 While recent estimates show that, among newer arrivals, Asian immigrants outnumber Latina/o immigrants,
Latina/os remain the largest foreign-born population in the United States
5
 For a comprehensive history of Latina/o immigration streams to the United States, the effects of immigration
policies, and the changing characteristics of immigrants entering the United States see Garip 2012; Massey, Durand,
and Pren 2015; Massey and Pren 2012; Patler 2018).
6 Many states offer in-state tuition to immigrants who are not citizens, but this is a recent change. California was the
first state to pass this into law in 2001 (Mendoza and Shaikh 2019).

 9
the mixed results of DACA. Since the passage of the Deferred Action of Childhood Arrivals

(DACA) in 2013, undocumented young adults who were brought to the United States as children

(1.5 generation) have benefited from the relief of deportation and improved work opportunities as

well as access to higher education, but it does not provide citizenship. Hsin and Ortega (2018)

found that DACA immigrants were more likely to seek out employment than enroll in college.

This is largely explained by the financial needs of their families. Programs like DACA may, in

theory, increase access to higher education for young Latina/os, but it appears that what they really

need is improved access to citizenship.

 Citizenship status has likely become more important for access to postsecondary education

(enrollment) in recent decades, relative to earlier time periods. From a compositional perspective,

citizenship has become more important over time because of the large influx of Latina/o

immigrants at the end of the twentieth and beginning of the twenty-first century (Gonzalez-Barrera

2015). A large proportion of these immigrants never naturalized; therefore, the proportion of the

Latina/o non-citizen population grew (see Figure 5). Second, on average, Latina/o non-citizens

have lower educational attainment in comparison to citizens (Gonzalez-Barrera 2017; Ramirez and

Medina 2010).

 Based on these literatures, we hypothesize the following:

 Hypothesis 3a: Latina/o citizens will have higher bachelor’s degree rates than
 non-citizens.

 Hypothesis 3b: Over time as the proportion of non-citizens grows, non-citizen enrollment
 differences will explain a higher proportion of racial/ethnic enrollment gaps than
 enrollment differences among citizens.

 10
DATA AND MEASURES

 We use U.S. Decennial Census data from 1950 to 2010, in conjunction with pooled data

from the American Community Survey (ACS) from 2015 to 2017 (IPUMS 2019). The ACS is a

nationally representative survey collected annually by the U.S. Census Bureau between

Decennial Census years. We use these data to analyze historical trends in Black-Latina/o and

White-Latina/o bachelor’s degree gaps. These data also allow us to assess the role of citizenship

and age at migration in education gaps. Although the average age of college completion

continues to grow, we limit our sample to individuals ages 25 to 29 years old because these ages

continue to represent the ages by which the majority will complete college (Ma et al. 2019).

However, Latina/os overall are at higher risk of the types of disadvantages that delay college

attainment (e.g., first generation, poor, and immigrant parents). Therefore, Appendix Figure 8

examines college completion rates for 28 to 32-year-olds. We do not find substantial differences

between this older age group and the age 25 to 29 group used in the paper.

IDENTIFYING THE LATINA/O POPULATION

 Hispanic is often used interchangeably with Latina/o, but Hispanic formally refers to native

speakers of Spanish, or those who have Spanish-speaking ancestry. This definition is commonly

referred to as the Spanish Rule and was used by Census officials to develop the Hispanic category

during the 1970s (Gratton and Guttman 2000). In contrast, the term, Latina/o, formally refers to

anyone of Latin American origin or ancestry, which includes the Hispanic population as well as

those from non-Spanish speaking countries such as Brazil. While the term Hispanic continues to

be a dominant term used by researchers and organizations, such as the U.S. Census, we use the

term Latina/o to account for all individuals having ancestry in any of the Latin American countries

 11
including natural born citizens, naturalized citizens, and non-citizens. We classify everyone in our

sample born in Mexico, Central America, Cuba, or South America as Latina/o. Our sample

includes Latina/os born in the United States as well as those born abroad.

 Citizenship is a key variable of interest in this study. Although Latina/os represent the

largest immigrant population in the United States, not all Latina/os in the United States are

themselves immigrants and many are citizens. A large number are born to immigrant parents or

are multi-generational, thus making them native-born citizens. In addition, many immigrants

become naturalized citizens after entering the country, although this has become increasingly

difficult over the last two decades (Anon 2019; Bloemraad 2006). To examine citizenship, we

constructed a simple binary category: citizen and non-citizen. We define citizens as any individual

who is born in the U.S, born abroad to native parents, or became a naturalized citizen after entering

the country.7 We define non-citizens as those who were not born in the United States and did not

naturalize, although they may have legal permanent residency. Due to data limitations, we are

unable to separately examine those with legal status and those without. In addition, the 1960

Decennial Census did not ask about citizenship status. Therefore, in Part III of this study, we

exclude all respondents from 1960 from the analysis.

 Researchers have expressed concern about the potential undercount of the Latina/o

population prior to 1980 due to inconsistent measurement (Massey 2018; Duncan and Trejo 2018;

Jimenez 2018; Mora 2014). Prior to the 1980s, estimating the U.S. Latina/o population was

difficult because the Census did not include a question or category specifically aimed at

distinguishing Latina/o people (Gratton and Guttman 2000; Mora 2014). While this is still a

7 There are small differences in the educational attainment of natural born and naturalized citizens. However, they
are not large, and the proportion of naturalized citizens is quite small, approximately 7% of the Latina/o population
are naturalized citizens in comparison to non-citizens (19% ) and natural born citizens (76% ). For these reasons, we
combined natural born and naturalized citizens into one group (citizens).

 12
concern, IPUMS created an approach, which they call the Hispanic origin rule, to harmonize

inconsistencies and optimally capture the full Latina/o population (Gratton and Gutman 2000). For

the Census years 1950 to 1970, IPUMS assigned Hispanic origin according to eight rules. 8 We use

this Hispanic origin variable to create our race/ethnicity category and draw comparisons between

non-Latina/o Black, non-Latina/o White, and Latina/o (including White and Black) men and

women prior to 1980. However, despite changes in Census measurement strategies, Latina/os

remain one of the most undercounted populations (Alsan and Yang 2018; O’Hare 2015, 2019).

 Previous research has shown that the non-citizen Latina/o population (as well as those who

live in mixed status households) in the United States are less likely to complete the Decennial

Census, because they do not trust government authorities and they fear deportation (U.S. Census

Bureau 1992; Van Hook and Bean 1998). Latina/o non-citizens are also more likely to be unstably

housed and migrate for agricultural work making this population more difficult to enumerate (Bean

et al. 2015; O’Hare 2019). This undercount of non-citizens may bias any results that examine

citizenship in our analysis. We are not able to address this problem, but we note that any

differences due to citizenship in our findings are likely conservative and downwardly biased. Non-

respondents to the U.S. Census are more likely to be non-citizens, and non-citizens on average

experience higher rates of poverty and have lower educational attainment in comparison to citizens

(U.S. Census 2003). For example, the average Latina/o agricultural worker has an eighth-grade

education, and a high proportion of agricultural workers are non-citizens (Hernandez and Gabbard

8 The Hispanic Rule is used to delineate persons in the Census who were recorded as Hispanic from 1850-1970.
Individuals were categorized as Hispanic using eight rules (see Gratton and Guttman 2000). IPUMS USA
implemented the methods proposed by Gratton and Guttman. Persons were classified as Hispanic if they met one of
the eight rules. If a person could be assigned to more than one rule, they are assigned to the lowest rule (most robust)
possible. The lowest rule applied to Hispanics is 1, which indicates that (1) they were born in Latin America or
Spain or (2) that persons were born in states that were still considered Mexican territory before the Treaty of
Guadalupe Hidalgo in July of 1848. Rule 8 assigns individuals as Hispanic if that person is a relative of a
householder who was classified Hispanic using rules 6 or 7. Hispanic origin was asked in all Census forms 1980 and
onward (Mora 2016). See Gratton and Gutman 2000 for a detailed explanation of these rules.

 13
2019). Consequently, the gap in educational attainment between Latina/o citizens and non-citizens

is likely larger than we present in this study.

COLLEGE ENROLLMENT AND COLLEGE COMPLETION

 Our main outcomes of interest are college enrollment and bachelor’s degree completion

among individuals who enroll. The Decennial Census has not consistently measured education in

the same way during the time under observation. From 1950 to 1980, college education was

reported as years of college and did not assign degree status. To limit possible measurement errors

due to this change, we follow a procedure suggested by Jaeger (1997) and used in several studies

(Autor et al. 2008; Schwartz and Mare 2005): we classified (a) anyone who reported less than one

year of college or more as having enrolled in college and (b) those with four years of college or

more as having a bachelor’s degree or higher. From 1990 to 2017, we measure college attainment

as any degree completed at or above a bachelor’s degree (or BA).9 This category includes people

with a master's, professional, and doctoral degree. We do not differentiate between various types

of bachelor’s degrees (e.g., Bachelor of Arts, Bachelor of Science, etc.). 10 We limit our college

completion given enrollment variable to only those who enrolled in college. Individuals are are

coded as a 1 for those who completed a bachelor’s degree or higher and 0 for those who enrolled

in college but did not complete a bachelor’s degree. We use this measure in our decomposition of

Black-Latina/o and White-Latina/o education gaps where we identify differences in college

enrollment and completion given college enrollment.

9
 For accuracy, we compared our bachelor’s degree measure with annual reports from both the National Center for
Education Statistics and the U.S. Census and found that our share of the population with a bachelor’s degree is
within one percentage point of all reports across every year in this study (NCES 2020; U.S. Census 2009, 2020).
10 For brevity, we label all bachelor’s degrees as BA in accordance with other scholars’ labeling schemes (Bailey
and Dynarski 2011).

 14
ANALYTIC APPROACH

 We begin our analysis in Part I by examining trends in the Black-Latina/o and White-

Latina/o gaps in college attainment over a 70-year time period. In Part II, we explain the proximate

drivers of these gaps by decomposing them into racial/ethnic differences in college enrollment

versus racial/ethnic differences in college completion given enrollment. Finally, in Part III, we

explain the role of citizenship in Black-Latina/o and White-Latina/o college enrollment gaps by

decomposing them in racial/ethnic differences in citizen’s and non-citizen’s enrollment and

proportion of population that are citizens and non-citizens. We are unable to distinguish between

education completed inside or outside of the United States prior to immigrating. To account for

this problem, we add a sensitivity analysis and repeat our decomposition analysis limiting our

sample to those immigrated before age 14.

DECOMPOSITION ANALYSIS

BLACK-LATINA/O AND WHITE-LATINA/O COLLEGE COMPLETION GAPS

 In Part II, to examine the Black-Latina/o and White-Latina/o college completion gaps for

the full population in each time period from 1950 to 2017, we decompose the total Black-

Latina/o and White-Latina/o bachelor’s degree gaps by differences in college enrollment versus

college completion given enrollment. Decomposition-based studies allow scholars to simulate

counterfactual scenarios in order to explain subgroup inequalities (Kitagawa 1955). We measure

racial/ethnic gaps in absolute values in proportions. 11

11We measure racial/ethnic gaps in absolute values in proportions for a few reasons. These measures are internally
consistent with the other figures in the paper and are easier for readers to interpret in comparison to relative measures
such as odd ratios. In addition, for this type of decomposition, it is preferable to use absolute gaps. While relative
measures are important as well as absolute measures, one problem with this is during the early years of this study, the
gaps between Latinos and White and Black men are small, because, regardless of race/ethnicity, college completion
was rare. For example, in 1950, 4.2% of White men and 1.1% of Latinos completed college. The absolute gap is 3.1

 15
The total White-Latina/o and Black-Latina/o gaps in bachelor’s degree rates is

decomposed into the sum of the two components: college enrollment differences and college

completion given enrollment differences. We write the decomposition as follows:

 BA Completion Gaps Enrollment Completion given Enrollment

 ( − ) = ( | ) ∗ ( − ) + ( ) ∗ ( | − | )

where BA denotes bachelor’s degree and r denotes Black or White, L denotes Latina/o and g

denotes male or female. If White or Black men and women have an educational advantage over

Latina/os, the gaps will be positive and if Latina/os have the advantage then the gaps will be

negative.

 To estimate the role of college enrollment in these gaps as opposed to the role of college

completion given enrollment, we calculate the amount of the bachelor’s degree gap that can be

explained by White-Latina/o and Black-Latina/o differences in college enrollment in each

period:

 = ( | ) ∗ ( − )

percentage points, but the risk ratio indicates that White men are nearly four times more likely to complete college
than Latinos which is accurate. However, in 2000, the absolute gap was 23 percentage points between these groups,
but the risk ratio indicates that White men were only 3.5 times more likely to complete college than Latinos. If we
used relative gaps, education differences between White men and Latinos in 1950 and 2000 would appear to be
relatively similar, but we know that it has significantly changed, and the differences were much larger in 2000 in
comparison to 1950.

 16
where | is the proportion of Latina/os who graduate from college conditional on their

enrollment in college and is the proportion of the subpopulation that enrolls in college.

 To estimate the role of college completion given enrollment in the racial/ethnic gaps

observed, we calculate the amount of the bachelor’s degree gap that can be explained by White-

Latina/o and Black-Latina/o differences in college completion given college enrollment, in each

time period:

 = ( ) ∗ ( | − | )

where is the proportion of Black and White men and women that enroll in college and

 | is the proportion of the subpopulation who graduate from college given that they

enrolled in college.

BLACK-LATINA/O AND WHITE-LATINA/O COLLEGE ENROLLMENT GAPS

 In Part III, we estimate the proportion of the Black-Latina/o and White-Latina/o college

enrollment gaps that can be explained by differences in enrollment by citizenship status and

composition. We write the decomposition as follows:

 Enrollment Gap Non-Citizen Enrollment Citizen Enrollment
 ( − ) = ( ) * ( | − | ) + ( ) * ( | − | )

where E denotes college enrollment, r denotes Black or White, L denotes Latina/o and g denotes

male or female.

 17
To estimate the role of non-citizen enrollment differences and the composition of non-

citizens, we calculate the amount of the enrollment gap that can be explained by White-Latina/o

and Black-Latina/o differences in college enrollment among non-citizens in each period:

 differences in non − citizen′ s enrollment and composition =

 ( ) * ( | − | )

 where denotes the non-citizen rates of Latina/os and | is the enrollment

rate of non-citizens. When non-citizen rates are high and/or racial/ethnic non-citizen enrollment

gaps are large, differences in enrollment among non-citizens will explain more of the

racial/ethnic enrollment gaps.

 To estimate the role of citizen’s enrollment differences and the composition of citizens,

we calculate the amount of the enrollment gap that can be explained by White-Latina/o and

Black-Latina/o differences in college enrollment among citizens in each period:

 differences in citizen′ s enrollment and composition =

 ( ) ∗ ( | − | )

where denotes the citizenship rates of Latina/os and | is the enrollment rate of citizens.

When citizenship rates are high and/or racial/ethnic citizen enrollment gaps are large, differences

in enrollment among citizens will explain more of the racial/ethnic enrollment gaps.

 18
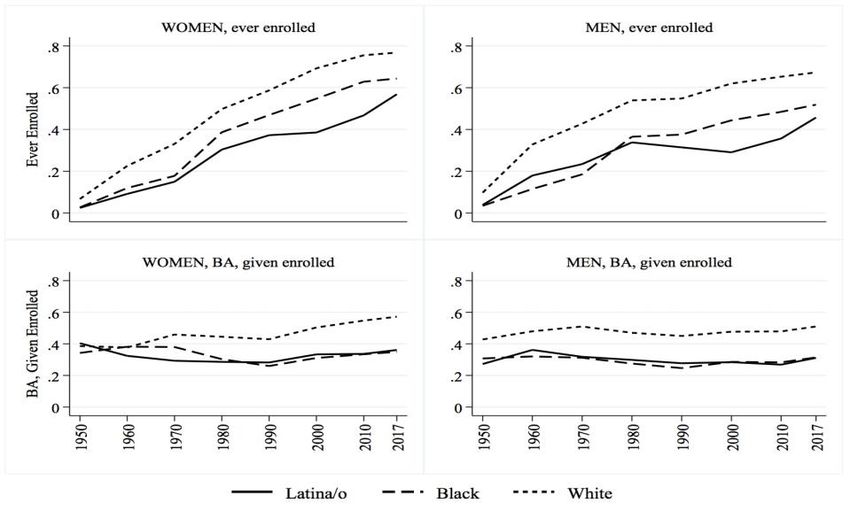
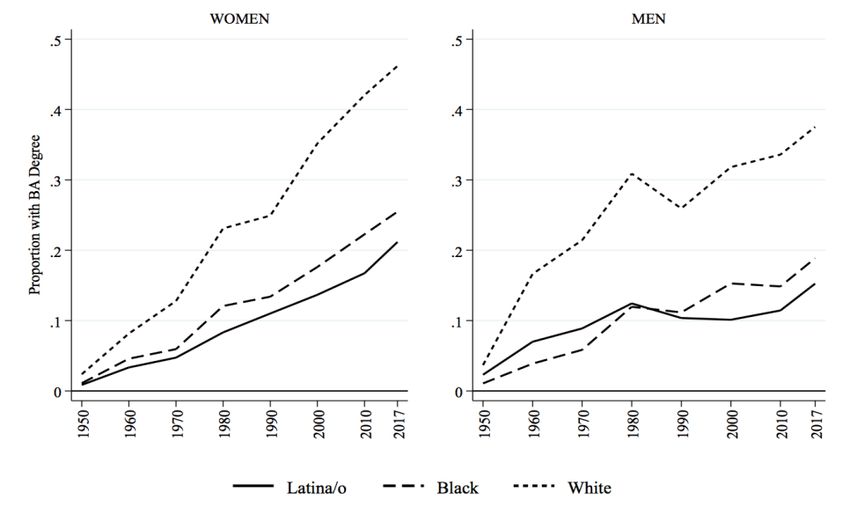
Decomposition methods are non-causal and descriptive in nature. Our goal is to describe

the association of citizenship differences with racial/ethnic educational inequality.

PART I: TRENDS IN RACIAL/ETHNIC EDUCATIONAL ATTAINMENT
AND GAPS

 Figure 1 shows trends in bachelor’s degree completion by race/ethnicity and gender. 12 The

left panel shows trends for women and the right panel shows the trends for men ages 25 to 29 from

1950 to 2017. Although women in all three racial/ethnic categories had nearly the same college

attainment rates in 1950, White women rapidly diverged from Black women and Latinas over time,

and Black women’s educational attainment increased at higher rates than Latinas. White and Black

women made their principal increases early (between 1950 and 1980) while Latinas made their

largest gains more recently, from 2000 to 2017.

 [Figure 1 here]

 Women in all racial/ethnic groups increased their college attainment more than men in the

same racial/ethnic group. As we saw with women, men’s racial/ethnic gaps were small in 1950

and the rapidly grew over the study period. Men in all three racial/ethnic groups increased their

college attainment the most from 1950 to 1980. Latinos are the only group to experience declines

in college attainment from 1980 to 2000. However, like Latinas, Latinos increased their college

education at a faster rate than White or Black men from 2000 to 2017.

12Changes in college attainment for women and men in each racial/ethnic category from 1950-1980, 1980-2000,
and 2000-2017 can be understood in greater detail in Appendix Table 1.

 19
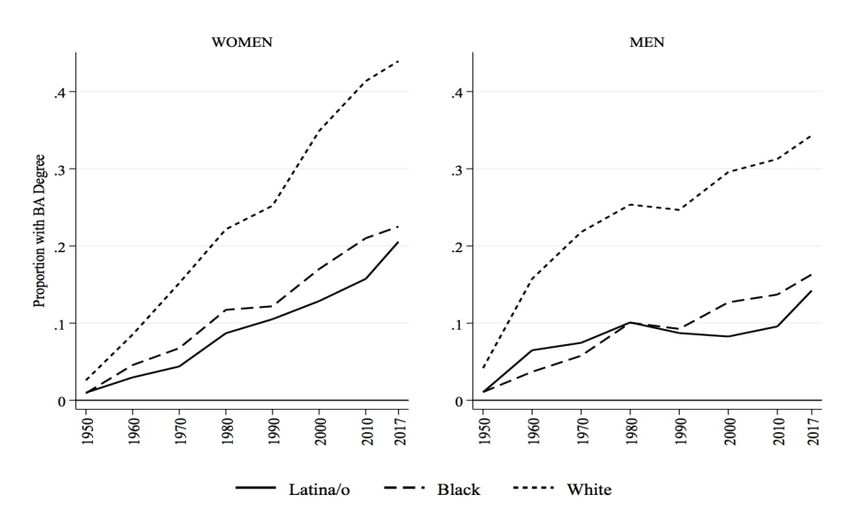
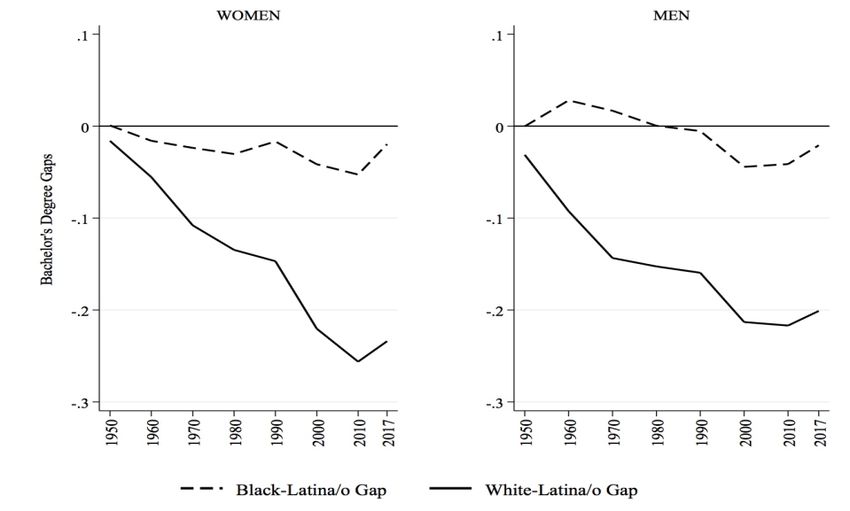
Figure 2 reorganizes the information in Figure 1 to highlight the trends in the Black-

Latina/o and White-Latina/o bachelor’s degree gaps from 1950 to 2017. The magnitude of the gap

in educational attainment between Black women and Latinas has never been very large, but Black

women have consistently held an advantage in educational attainment over Latinas since 1960

(Figure 2, left panel, dashed line). The White-Latina gaps are very different. While White women

and Latinas had similar educational attainment in 1950, White women rapidly outpaced Latinas.

This is despite Latinas’ consistent attainment increases in every decade after 1950. The recent

narrowing of gaps from 2010 to 2017 is due to Latinas more rapid increase in bachelor’s degree

attainment than Black and White women.

 [Figure 2 here]

 The college completion gap trends between Black men and Latinos varies from the other

racial/ethnic gaps in the earlier decades (1950 to 1990) where Black men and Latinos either earned

college degrees at the same rate, or Latinos earned degrees at higher rates than Black men, but

after 1990, Black men earned college degrees at higher rates than Latinos. White men have

consistently had higher degree rates than Latinos, although the gaps grew substantially over time.

As with women, White-Latino and Black-Latino bachelor's degree gaps narrowed in 2017. White-

Latina/o education gaps grew more rapidly in comparison to Black-Latina/o degree gaps and are

still quite large (greater than 20 percentage points for both men and women).

 20
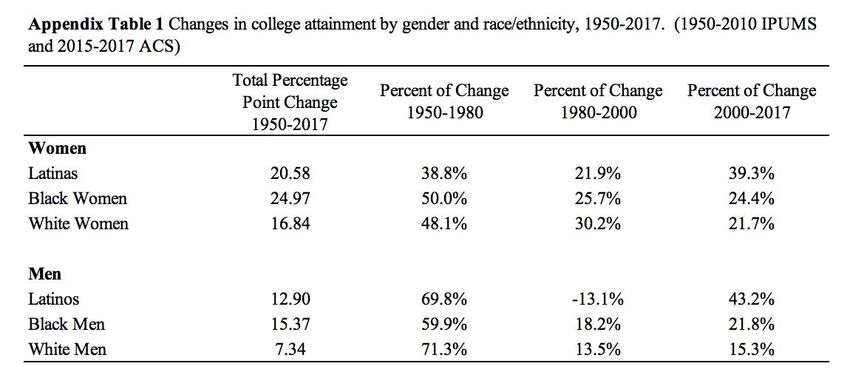
PART II: DIFFERENCES IN ENROLLMENT AND COMPLETION AS AN
EXPLANATION FOR COLLEGE COMPLETION GAPS

 Previous research has demonstrated how differences in college enrollment and college

completion given enrollment help explain differences in bachelor’s degree rates between White

and Black men and women (McDaniel et al. 2011). In the next section, we examine how these

differences explain White-Latina/o and Black-Latina/o college attainment gaps.

 Figure 3 shows trends in college enrollment (top row) and college completion given

enrollment (bottom row) for men and women in all three racial/ethnic groups. White men and

women have consistently enrolled in college and completed college, given enrollment, at higher

rates than both Latina/os and Black men and women (except for White women’s college

completion rates in 1950). White-Latina/o enrollment gaps were small in 1950 but grew

precipitously over time. Black women also experienced higher growth rates in enrollment than

Latinas after 1950s, albeit to a smaller degree. Latinos enrolled at higher rates than Black men

from 1950 to 1970, but from 1980 onward, Black men enrolled in college at higher rates than

Latinos. Black-Latina/o enrollment gaps have consistently been much smaller than the White-

Latina/o gaps, although all enrollment gaps declined slightly in 2017.

 [insert Figure 3 here]

 College completion conditional on enrollment trends are very different from enrollment

trends. While enrollment increased substantially, if unequally, for all groups since 1950,

completion rates have remained mostly flat for all racial-ethnic groups with one notable exception:

White women are the only group to experience large gains in college completion conditional on

 21
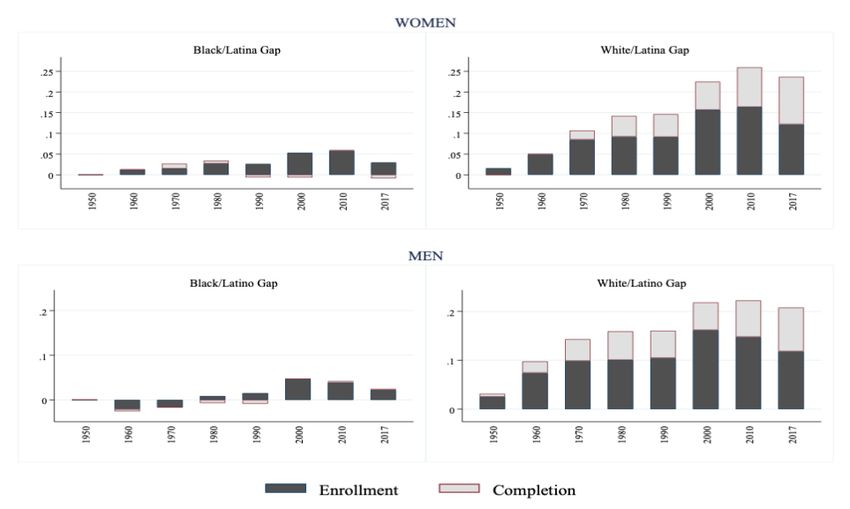
enrollment. White men have consistently completed college at much higher rates than both Latinos

and Black men, and White women have maintained a substantial college completion advantage

over Latinas and Black women since 1970. It is not surprising that White students complete college

at much higher rates than both Latina/os and Black students given the disadvantages that both

groups of students face in comparison to White students.

 Based upon the trends in Figure 3, it appears that college enrollment differences explain

more of the White-Latina/o and Black-Latina/o education gaps. Figure 4 decomposes these two

components (enrollment and completion given enrollment) to identify the magnitude of each

more precisely. Enrollment differences explain the entirety of the Black-Latina/o college

completion gaps, and in some years, over-explain the gaps (Figure 4, left column). This means

that in some years, if Latina/os had enrolled in college at the same rates as Black men and

women, they would have had higher college degree rates than Black men and women. The only

year when completion differences explained any of the Black-Latina/o education gap is 1970.

This finding suggests that Black men and women may have some advantages in college access,

but both groups experience challenges that lower their likelihood of finishing college in

comparison to their White peers.

 [insert Figure 4 here]

 White-Latina/o education gaps, in contrast, reflect both enrollment differences and

completion differences given enrollment (Figure 4, right column). Although enrollment

differences explain most of the college completion gaps between Latina/os and White students in

almost every year examined, they do not explain the entirety of the gaps, with an exception for

 22
women in 1950 and 1960. Moreover, the proportion of the college completion gap explained by

enrollment decreased between 1950 and 2010. The only year when conditional completion

explained more of the White-Latina gap than college enrollment is 2017.

 In summary, college enrollment differences explain the majority of the Black-Latina/o and

White-Latina/o college attainment gaps. What explains these White-Latina/o and Black-Latina/o

enrollment differences? We hypothesized that citizenship differences provide a key explanation.

Throughout the time period of this study, over 95% of Black and White men and women were

citizens (Appendix Table 2), while a very large proportion of the Latina/o population were

immigrants and non-citizens (ranging from 48% to 89% across the study period). In Part III, we

examine these citizenship differences to evaluate their relationship to Latina/o college enrollment.

PART III: DIFFERENCES IN CITIZENSHIP RATES AS AN
EXPLANATION FOR DIFFERENCES IN COLLEGE ENROLLMENT

 Figure 5 shows the proportion of Latina/o citizens as well as Latina/o bachelor’s degree

rates by citizenship status. The left y-axis is the proportion of Latina/os who are citizens, and the

right y-axis is the proportion of Latina/o citizens and non-citizens with a bachelor’s degree.

Although Latina/o citizens have comprised the majority of the U.S. Latina/o population in most

decades, citizenship rates were at their highest in 1950. From 1960 to 2000, Latina/os citizenship

rates declined, reaching a low of 53% and 48%, respectively. Except for 1970, Latinas have

consistently had higher citizenship rates than Latinos.

 23
[insert Figure 5 here]

 From 1950 to 1970, Latina/o non-citizens had higher college attainment rates than citizens,

but after 1980, citizens overtook non-citizens, and the education gap between them swiftly grew.

These differences are important, especially, in the context of declining citizenship rates. As it

became more challenging for Latina/o immigrants to gain citizenship, it also became more difficult

for non-citizens to gain access to college. Because the non-citizen population was so large and

growing, the educational progress that Latina/o citizens were making during this time was

obscured.

 Figure 6 shows trends in college enrollment (top row) and college completion given

enrollment (bottom row) for Latina/o citizens and non-citizens. Overall, in early decades Latina/o

citizens and non-citizens had similar and low college enrollment rates, but over time Latina/o

citizens increasingly enrolled in college at higher rates than non-citizens. For Latina non-citizens,

college enrollment slowly increased while Latino non-citizens experienced declines in college

enrollment until 2017. This suggests that the importance of citizenship for college enrollment grew

over time.

 [insert Figure 6 here]

 We observe a very different pattern for college completion given enrollment trends.

Despite some variation, Latina/o citizens and non-citizens have had roughly similar college

completion given enrollment rates. Citizenship appears to provide better access to college, but it

doesn’t increase the likelihood that Latina/o citizens will graduate. These findings are similar to

 24
Black-Latina/o enrollment and completion given enrollment gaps observed in Figure 3. It appears

that Black and Latina/o students, regardless of race/ethnicity or citizenship, are disadvantaged in

very similar ways once enrolled in college and this lowers the likelihood that they will complete

college in comparison to White students.

 Figure 7 display the proportion of the White-Latina/o and Black-Latina/o college

enrollment gaps that can be explained by differences in the enrollment rates of citizens and non-

citizens and the composition of each group. Differences in non-citizen enrollment explained a

small proportion of the White-Latina/o enrollment gaps from 1950 to 1970 but grew significantly

over time. Since 1990, the proportion of the enrollment gaps explained by non-citizen enrollment

differences has remained relatively stable at approximately 70%.

 [insert Figure 7 here]

 Turning to the Black-Latina/o college enrollment, differences in non-citizen enrollment

explains nearly all of the Black-Latina enrollment gaps in ever year. If Latinas had the same

citizenship rates as Black women, Latinas would have had the same enrollment rates as Black

women. The pattern is very similar for Black men and Latinos except that during some decades,

non-citizen enrollment over-explains Black-Latino enrollment gaps. Latinos would have had the

same enrollment or higher enrollment rates than Black men.

 Overall, we find that as Latina/o citizenship declined the proportion of racial/ethnic

enrollment gaps that could be explained by the enrollment differences of non-citizens increased

substantively, and the proportion of racial/ethnic enrollment gaps that could be explained by the

enrollment differences of citizens declined. Latina/o non-citizens have very low college

 25
enrollment rates and over time they became a large proportion of the Latina/o population. Although

enrollment differences among citizens declined during this time, the racial/ethnic gaps in

citizenship rates meant that the enrollment progress of Latina/o citizens was obscured. In Appendix

A, we conduct a sensitivity analysis to account for differences that may arise from age at migration.

Those who immigrated at younger ages may be more likely to enroll in college regardless of

citizenship status in comparison to those that immigrate in young adulthood (Beck et al. 2012;

Gonzalez 2003). Although there are differences in magnitude, the results support our previous

findings and our conclusion that access to citizenship is instrumental in Latina/o access to higher

education

 26
DISCUSSION

 Across the study period, college completion grew in social and economic importance.

Individuals with a bachelor’s degree earn higher wages, have longer life expectancy, and

increased intergenerational mobility in comparison to those who do not (Hout 2012). Yet, across

this same time period, educational inequality grew between Latina/os and Black and white men

and women. Previous scholarship provides some insight into these gaps such as the higher

childhood poverty rate and the lower high school graduation rates of Latina/o families (Kanno

and Varghese 2010; Nora and Crisp 2009). We add to this literature by demonstrating that

differences in enrollment explain the majority of racial/ethnic bachelor’s degree gaps and that

differences in citizenship rates explain gaps in enrollment.

 We extend upon previous scholarship with four main contributions. First, we show how

Black-Latina/o and White-Latina/o college completion gaps developed over a 70-year period, from

relative parity in 1950 to large gaps later. Racial/ethnic gaps in bachelor’s degree attainment can

occur at two points: inequalities in college enrollment and inequalities in college completion given

enrollment. This leads to our second finding that differences in college enrollment explain the

majority of the White-Latina/o education gaps in nearly every decade, although differences in

college completion given enrollment have grown over time. Differences in enrollment explains

nearly all Black-Latina/o college education gaps, and in some decades, college enrollment

differences over-explain these gaps. Therefore, if college enrollment rates were equal between

Black men and women and Latina/os, Latina/os would have higher bachelor’s degree rates than

their Black peers.

 Third, we show that Latina/o citizens increasingly enrolled in college at much higher rates

than non-citizens after 1980, but that there is little to no substantive difference between citizens

 27
and non-citizens for college completion conditional on enrollment. These findings support Patler’s

work on the “citizenship advantage” for the transition to college, although this advantage does not

appear to apply to college completion once enrolled.

 Finally, we find that citizenship rates explain or over-explain Black-Latina/o college

enrollment differences. We also find that the importance of citizenship differences increased over

time. This is due to Latina/o citizens having higher rates of college enrollment in comparison to

Black citizens and to the enormous differences in citizenship rates between Latina/os and the Black

population. The trends are similar for the White-Latina/o enrollment gaps, but of a smaller

magnitude. Through these results, we show that citizenship is an important factor for explaining

educational inequalities in the United States. Our findings offer a potential explanation for the mixed

effects of DACA for educational attainment that Hsin and Ortega found in their analysis (2018). It does

not appear to be sufficient to legally allow non-citizens to enroll in college. Instead, these students need

a path to citizenship before they can enroll.

 As with most scholarly work, there are limitations to our study. It is notoriously difficult

to obtain an accurate count of the Latina/o population due to the precarious position of

undocumented immigrants. The lack of a standardized measure of Latina/os in the early years of

this study period compounds this problem. However, these data collection challenges likely bias

our results downward meaning that the White-Latina/o and Black-Latina/o differences in

educational attainment would be even larger than we report, and that citizenship differences would

explain even more of the educational gaps than we find, if all Latina/os in the US were accurately

enumerated. In addition, all of our findings are descriptive, and we cannot make any causal claims.

 Future work should further examine how citizenship shapes other educational inequalities

in the United States. Latina/os are not a monolithic group, and there is likely a great deal of

variation in both citizenship rates and educational attainment between Latina/o subgroups.

 28
Education scholars could separate out the different regions from which Latina/os immigrate as

well as the different regions in which they settle in the United States and how these differences

interact with access to citizenship and predict educational attainment. In addition, future research

that can incorporate family socio-economic status could disentangle the relationship between

socio-economic status, citizenship, and education. Although the future of DACA is uncertain, we

still have a great deal to learn about the relationship between DACA (or similar types of programs)

and educational attainment.

 Finally, although they have very different immigration histories, comparative research on

the association between citizenship and educational attainment of Latina/os and the Asian

population is lacking. This scholarship would yield important insights for two of the largest

immigrant groups in the United States on how some immigration policies hyper-select immigrants

and how policy differences have impacted the educational achievement of these two racial/ethnic

groups.

 Our findings suggest that examining the educational attainment of the total Latina/o

population, without accounting for the large differences in citizenship rates between Latina/os and

the White and Black population, obscures both the overall higher attainment of Latina/o citizens

relative to non-citizens as well as the progress that Latina/o citizens have made in recent decades.

Our findings also indicate that continued attention and additional resources are necessary to help

disadvantaged students graduate after they have entered college.

 29
You can also read