China Hong Kong Opportunities Strategy - Quarterly Investment Update
←
→
Page content transcription
If your browser does not render page correctly, please read the page content below

Second Quarter 2022

China Hong Kong
Opportunities Strategy
Quarterly Investment Update

For a discussion of the risks associated with this strategy, please see the Investment Considerations page at the
end of the presentation.
2Q22: Policy stimulus and easing COVID-19 measures supported
China equities
                                                                                  Market Review & Update
  ▪ By markets, China equities posted gains while Hong Kong                                                                     ▪ For China ADRs, the TMT sector rallied as the State Council
    equities posted losses for the quarter.                                                                                       vowed to support platform economy’s health development and
                                                                                                                                  support venture capital via private investment. Inline sales for
  ▪ In April and the first half of May, markets were negatively
                                                                                                                                  Mainland China’s 6.18 event, the potential conclusion of the
    affected by the Russia-Ukraine conflict and widening COVID-19
                                                                                                                                  government’s probe on a ride-hailing company as well as
    outbreak in Mainland China. However, in the second half of May,
                                                                                                                                  authorization of the second batch of 60 video games’ licenses
    China equities rebounded as Mainland China announced 33
                                                                                                                                  were other positives for the sector.
    measures and guidelines to stimulate the economy, such as
    rolling out extensions of value-added tax rebates, encouraging                                                              ▪ On the policy front, the PBoC has loosened monetary policies
    relending programs, ensuring reasonable financing needs of                                                                    through several policy rate cuts, such as reserve requirement
    local government financing vehicles, as well as increasing                                                                    ratios (RRR), 5-year loan prime rate (LPR) etc..
    financial resources to logistics, transportation, and courier
                                                                                                                                ▪ Hong Kong equities moved lower in April however
    industries, etc.
                                                                                                                                  subsequently rebounded in May and June on the back of
  ▪ In June, China equities continued to move higher on the back of                                                               easing COVID-19 measures, positive catalysts from Mainland
    easing lockdown measures in Beijing and Shanghai, relaxed                                                                     China, market expectation for preferential policies by the new
    quarantine rules to 7+3 days from 14+7 days on inbound                                                                        government and the disbursement of electronic consumption
    travelers and stepped-up stimulus policies.                                                                                   vouchers.
                       Global Equity Markets Performance – 2Q 2022                                                                                      Sector Performance – 2Q 2022
                  20                                   15.3                                                                                               MSCI Zhong Hua 2.72%
                  15                                                                                                                               (85% MSCI China & 15% MSCI Hong Kong)
                                                                                                                                    15    12.3   12.0
                  10
    Return (%)

                                                                 3.5
                   5                                                      1.6      0.2                             Return (%)       10
                   0                                                                                                                 5                   0.8      0.7     0.2
                  -5                                                                       -0.1     -1.1                             0
                 -10
                                                                                                                                     -5                                         -0.3   -0.9   -0.9   -1.7
                 -15    -10.5 -11.4                                                                                                                                                                         -4.0   -4.5
                 -20                  -16.1 -16.1                                                                                   -10

Source: Manulife Investment Management, 30 June 2022
*Index returns are gross total returns for each country / exchange market. Past performance is not indicative of future results.

                                                                                For Institutional/Investment Professional Use Only. Not for distribution to the public.                                      QMSR. 556716   2
2Q22: Strategy moved higher however underperformed the broader
market
What Helped?
▪ The portfolio’s overweight in consumer discretionary and Attribution over Prevailing Benchmark
underweight in communication services contributed to Detractor Contributor
performance. Stock selection in industrials and consumer
discretionary also contributed to performance Total effect (bps)
▪ A key contributor was a Chinese automobile manufacturer. Selection effect -44
The stock moved higher as the company reported strong Allocation effect -16
auto sales with strength in new energy vehicles. The
company is also a key beneficiary of China’s purchase tax
reduction and “new energy vehicle (NEV) to rural” policies.
Consumer Discretionary 49
Another key contributor was also a Chinese automobile
manufacturer. The company’s sales volume in Q2 2022 hit Industrials 31
new high, attributable to the firm’s product mix improvement
and in-house production of core components. Communication Services 11
Health Care 10
What Hurt?
Information Technology -2
▪ The portfolio’s overweight in industrials detracted from
performance. Stock selection in financials and real estate Utilities -10
also detracted from performance. Materials -12
▪ A key detractor was a Chinese renewable energy project
Energy -18
development company. The stock pulled back post strong
2021 earnings. However, the company’s acquisition plans Consumer Staples -21
for projects from its parent company and independent third
parties may increase production capacity and drive future Financials -37
growth. Another key detractor was a Chinese bank. The Real Estate -42
stock pulled back due to management re-shuffle. Overall,
the bank maintains a strong balance sheet with higher-than- -70 -50 -30 -10 10 30 50 70
peers ROE.
Source: Manulife Investment Management and FactSet, as of 30 June 2022
Inception Date: 1 January 2006. MSCI Zhong Hua is comprised of MSCI China (85%) and MSCI Hong Kong (15%).
Past performance is not indicative of future results.
For Institutional/Investment Professional Use Only. Not for distribution to the public. QMSR. 556716 3Strategy sector positioning and changes
Key Investment Themes and Outlook
Strategy Active Weights (%)
▪ Overall, we remain constructive and expect policy executions
to accelerate in the second half of the year.
Industrials
▪ For policy tailwinds, Mainland China announced the 14th 5-
year plan for renewable energy, which estimated the
Information Technology
demand for renewable energy to reach 20% of China's
primary energy demand by 2025. Mainland China also
pledged to push green hydrogen pilot projects that are based Consumer Discretionary
on renewable energy, promote the application of fuel cell in
mining areas, ports and key industrial parks etc., as well as Materials
explore the alternative application of hydrogen in the
metallurgical and chemical industries. Mainland China’s
Energy
order for state-owned policy banks to set up RMB800 billion
credit line for infrastructure is positive, which may help
finance infrastructure costs. Infrastructure investment could Utilities
lead the cycle of recovery.
▪ For innovations, the newly announced auto consumption Health Care
policies continued to benefit traditional and new energy auto
manufacturers. The State Council is reportedly to consider Financials
extending tax exemptions on electric car purchases by
RMB200 billion, which could be favorable for the sector. Consumer Staples
▪ For consumptions, the relaxation of quarantine rules to 7+3
days from 14+7 days for Mainland China’s inbound travelers Real Estate
and other COVID-19 close contacts might further boost
domestic consumption. We expect consumption growth to
Communication Services
rebound should the COVID-19 situation subsides in
Mainland China.
-6 -4 -2 0 2 4 6
▪ We believe the fiscal and monetary stimulus announced in
Q2 2022 set the stage for economic recovery for the second Jun-22 Mar-22
half of the year. We remain selective and continue to focus
on our key structural investment themes.
Source: Manulife Investment Management, FactSet, as of 30 June 2022
For Institutional/Investment Professional Use Only. Not for distribution to the public. QMSR. 556716 4Outperformance mainly came from stock selection
Value-added across multiple sectors
Evidence of repeatable alpha generation by stock selection
(Annualized for period over 1 year) 2Q22 1Y 3Y 5Y 7Y 10Y
Strategy gross return 1.8 -36.2 1.6 5.3 4.2 9.1
Excess return over benchmark (MSCI Zhong Hua) -0.9 -6.9 2.8 3.2 2.0 3.2
% of outperformance from Stock Selection n/a n/a 20% 48% 39% 74%
Excess return over MSCI China 10/40 Index -2.3 -6.1 1.1 2.7 2.5 3.6
Total attribution effect* over benchmark by sector Strategy 3Y rolling return since current PM vs
for past 5 year (%) benchmark
25%
3yr Rolling Returns (%)
CHKO Equity Strategy
15%
5%
Average Excess Return: 3.7%
Periods Outperformed: 93%
-5%
-5% 5% 15% 25%
MSCI Zhong Hua Index 3yr Rolling Returns (%)
Source: Manulife Investment Management and FactSet, as of 30 June 2022. Annualized for period over 1 year. *Note that attribution may not match with official performance figures . Inception Date: 1 January 2006.
MSCI Zhong Hua is comprised of MSCI China (85%) and MSCI Hong Kong (15%). Past performance is not indicative of future results. Performance is shown in USD, gross of fees and
does not include advisory fees and other expenses an investor may incur, which when deducted will reduce returns. Changes in exchange rates may have an adverse
effect. The chart line represents a 0% outperformance, an illustrative scenario in which the composite returned the same as the benchmark. Above the line is
overperformance and below the line is underperformance. Scatter plots are the three-year annualized rolling returns in US$ shown monthly with periods beginning in
(06/30/2012) through periods ending (06/30/2022)
For Institutional/Investment Professional Use Only. Not for distribution to the public. QMSR. 556716 5China Hong Kong Opportunities strategy positioning
Mid & Small cap tilt and actively managed China A-shares exposure
Portfolio breakdown (%):
• Strategy’s focus on under-researched ideas resulted in a mid to small cap tilt
• Selective in China A-shares for unique opportunities not exist in offshore listings
• Highly actively managed China A-shares exposure
Market Cap Breakdown (%) Share Type Breakdown (%)
100 95 94 80 74
89 Mid & small cap stock picks in i) solar Current A-shares exposures mainly in
energy, EV supply chain that are trading renewable energy, industrial software
63 and semiconductor localization plays
at attractive valuation; ii) non-consensus 60
80
ideas in tertiary education, biotech, 60
medical services and property
management services
60
40
40
18 16 16 17
20 14
20 6 8
3
4 4 5 4 0
1 1 0
0 China (HK- Hong Kong ADRs A-shares
Large cap Mid cap Small cap listed)
(> USD 5B) (USD 3-5B) (China Hong Kong Opportunities Strategy
Investment results as of 30 June 2022
Annualized Returns (%)
20
9.13 8.38 7.39
10 5.26 4.15 5.94
1.83 2.72 1.59 2.11 2.13
0
-1.17
-10
-9.86
-20 -16.75
-30
-29.31
-40 -36.15
-50
3 Months YTD 1 Year 3 Years 5 Years 7 Years 10 Years Since Inception
(1 Jan 2006)
Gross Returns MSCI Zhong Hua Index
Calendar Year Returns (%)
2021 2020 2019 2018 2017 2016 2015 2014
China Hong Kong Opportunities Composite (Gross) -20.12 45.11 23.97 -14.91 58.57 -0.17 -3.27 5.98
MSCI Zhong Hua Index -19.16 25.13 20.71 -16.25 49.35 1.52 -5.58 7.27
Excess return (Gross) -0.96 19.98 3.25 1.35 9.22 -1.69 2.31 -1.29
As of 30 June 2022.
Performance shown is the Manulife Investment Management Hong Kong Opportunities Composite in USD. Returns greater than one year are annualized. Past performance is not indicative of future results.
Performance shown of the strategy is gross of fees and does not include advisory fees and other expenses an investor may incur, which when deducted will reduce returns. Changes in
exchange rates may have an adverse effect.
For Institutional/Investment Professional Use Only. Not for distribution to the public. QMSR. 556716 7China Hong Kong Opportunities Strategy
Portfolio characteristics as of 30 June 2022
Sector Allocation (%)
30
27.7
26.5
21.0
19.3
20
15.3
11.2
10.6
10
8.1
6.9 6.6
4.9 4.9 5.3
3.9 3.6 3.6 3.7 3.5 3.0 3.2 3.0
2.3 1.9
--
0
Health
Cash
Discretionary
Estate
Communication
Utilities
Materials
Industrials
Financials
Technology
Consumer
Energy
Information
Care
Real
Consumer
Staples
Services
China Hong Kong Opportunities Strategy MSCI Zhong Hua Index
Source: Manulife Investment Management, Factset as of 30 June 2022.
Holdings, sector weightings, market capitalisation and portfolio characteristics are subject to change at any time and are for illustrative and reference purpose only. Holdings, sector
weightings, market capitalisation and portfolio characteristics of individual client portfolios in the program may differ, sometimes significantly, from those shown. This information does not
constitute, and should not be construed as, investment advice or recommendations with respect to the securities and sectors listed. This information is supplemental to the GIPS-compliant
presentation included as a part of this material.
For Institutional/Investment Professional Use Only. Not for distribution to the public. QMSR. 556716 8Reasons at a glance
Why China Equities? Why Now? Why this Strategy? Why Manulife IM?
• Economic fundamentals • China equities are still • All-weather solution with alpha • One of the largest
remain solid underrepresented in sources coming from multiple investment managers for
international indices sectors, market cap ranges Greater China Equity
• Compelling structural and across all share types strategies with over USD 8
opportunities exist across • Opening up of China A- billion asset under
sectors thanks to key secular shares market and global • Focus on under-researched management
trends. China will continue to: index inclusion raised ideas which provide
the overall profile of differentiated exposure to • Investment team in Asia
• consume more and better China equity investors since 1996 and China
equity capability since 2005
• research, develop, and • Meaningful • ESG analysis is fully
innovate diversification benefits integrated throughout the • Stable and well-resourced
from developed markets investment process investment team with 40+
• use policies to direct investment professionals
sustainable growth to • Flexible exposure between on-the-ground presence
effect a smooth structural China and Hong Kong equity to
transition optimize risk-reward profile
Source: Manulife Investment Management, as of 31 March 2022.
Diversification doesn't guarantee any profit nor protect against any loss in the market."
For Institutional/Investment Professional Use Only. Not for distribution to the public. PRS.556716 9China Hong Kong Opportunities Strategy
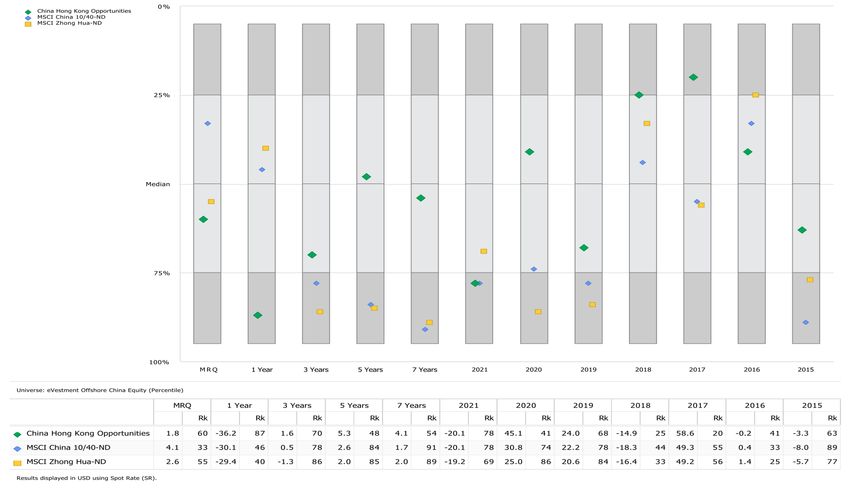
eVestment Offshore China Equity Universe – Performance
• Top quartile return
for 2017 and 2018
Source: eVestment as of 30 June 2022.
Past performance is not indicative of future results. Performance is shown in gross of fees.
For Institutional/Investment Professional Use Only. Not for distribution to the public. QMSR. 556716 10China Hong Kong Opportunities Strategy
eVestment Offshore China Equity Universe – Excess Return, Market Capture
• Top quartile upside
capture for 5 years
• Favorable upside
market capture for
3 and 5 years
• Top quartile batting
average for 5 years
Source: eVestment as of 30 June 2022.
Past performance is not indicative of future results. Performance is shown in gross of fees.
For Institutional/Investment Professional Use Only. Not for distribution to the public. QMSR. 556716 11China Hong Kong Opportunities Strategy
eVestment Offshore China Equity Universe – Risk ratios
• 2nd quartile
information ratio
for 5 years
Source: eVestment as of 30 June 2022.
Past performance is not indicative of future results. Performance is shown in gross of fees.
For Institutional/Investment Professional Use Only. Not for distribution to the public. QMSR. 556716 12The case for China Equity
For Institutional/Investment Professional Use Only. Not for distribution to the public. QMSR. 556716 13Mainland China is already the second largest equity market in the
world
But underrepresented in global indices
• Mainland China’s economic substance and growth contribution to the world is underrepresented by most
international market-cap weighted indices.
• While Mainland China represented 18.5% of the world’s GDP growth in 2021, Mainland China’s weight in MSCI All
Country World index is only at 4.1%.
Mainland China’s Mainland China’s Weight in
World Stock Exchange by
Contribution to Global GDP MSCI All Country World
Market Capitalization1
(2021)2 Index3
In USD trillion
US 41.4 4.1%
Mainland China
11.3 5.6 16.9
& HKSAR 18.5%
Japan 5.2
As % of world’s 35.2%
market cap
UK 2.9
• US 42%
• Mainland China 57.6% 23.9%
France 2.9 & HKSAR 17% 60.6%
India 2.6
Germany 2.0
Mainland China US Other markets Mainland China US Other markets
South Korea 1.6
1. Source: Bloomberg, as of 30 June 2022.
2. Source: World Bank, 30 June 2022.
3. Source: MSCI, Bloomberg, as of 30 June 2022.
For Institutional/Investment Professional Use Only. Not for distribution to the public. QMSR. 556716 14Unwavering demand for China equities
Stable southbound inflow amid market correction
• Despite equities market correction in Mainland China, net inflows of southbound capital continued to grow in H1
2022. Further expansion of eligible stocks to include “return-home” listings in the Southbound Stock Connect
Program remains as a medium-term catalyst. Net inflows into northbound turned positive in June.
• The rapid expansion in Mainland China’s household assets is being driven by growth in deposits and their
conversion to other household financial asset, creating long-term opportunities across Mainland China’s financial
spectrum.
Stock Connect net buying YTD1 China onshore household investable financial assets2
In USD billion In USD trillion
30 60
25 CAGR: 10%
50
20
40
15
30
10 Positive inflow
5 20
0 10
-5
0
2020 2025E
-10
1/2022 2/2022 3/2022 4/2022 5/2022 6/2022 Mutual fund Private funds Brokers CAM Bank WMP
Northbound Southbound Insurance Trust Deposit Stocks
1. Source: Bloomberg, as of 30 June 2022.
2. Source: Goldman Sachs Global Investment Research, Gao Hua Securities Research, as of July 2021.
The above information may contain projections or other forward-looking statements regarding future events, targets, management discipline or other expectations. There is
no assurance that such events will occur, and the future course may be significantly different from that shown here.
For Institutional/Investment Professional Use Only. Not for distribution to the public. 15
QMSR. 556716A holistic All-China approach to exploit the broad and deep universe
Market swing renders flexible approach more favorable
• An “All-China” allocation approach to stay invested in China equity could mean a more favorable risk-adjusted
reward.
• Hong Kong equity offers good unique stock selection opportunities for companies deriving growth from Mainland
China but with different macro and micro drivers.
Onshore & offshore market return since the launch of Stock Connect Program, in USD
H1 2022 2021 2020 2019 2018 2017 2016 2015 2014
Offshore China
(MSCI China)
(11.26) (21.72) 29.49 23.46 (18.88) 54.07 0.90 (7.82) 7.96
Onshore China
(13.37) 4.03 40.04 37.48 (32.99) 20.28 (19.11) 7.08 46.53
(MSCI China A)
Hong Kong
(2.92) (3.91) 5.82 10.34 (7.83) 36.17 2.27 (0.54) 5.07
(MSCI Hong Kong)
Source: Bloomberg, as of 30 June 2022. The above information may contain projections or other forward-looking statements regarding future events, targets, management discipline
or other expectations. There is no assurance that such events will occur, and the future course may be significantly different from that shown here. Past Performance is not
indicative of future results.
For Institutional/Investment Professional Use Only. Not for distribution to the public. QMSR. 556716 16Manulife Investment Management GIPS® Report
China Hong Kong Opportunities Composite
Creation Date: January 1, 2018 Inception Date: January 1, 2006 Reporting Currency: USD
Schedule of Calendar Year Returns and Assets
Number of Total Assets Firm Assets
Gross of Fees Net of Fees Benchmark Composite 3-Yr Benchmark 3-Yr Portfolios End Composite End of Period End of Period
Year End Return (%) Return (%) Return (%) Std. Dev. (%) Std. Dev. (%) of Period Dispersion (%) (Millions) (Millions)
2021 -20.12 -20.75 -19.16 20.99 18.92Index Definitions
Index Definition
The MSCI Australia Index is designed to measure the performance of the large and mid cap segments of the Australia market. With 70 constituents, the index covers
MSCI Australia
approximately 85% of the free float-adjusted market capitalization in Australia.
The MSCI China Index captures large and mid cap representation across China H shares, B shares, Red chips, P chips and foreign listings (e.g. ADRs). With 150 constituents,
MSCI China
the index covers about 85% of this China equity universe.
The MSCI Hong Kong Index is designed to measure the performance of the large and mid cap segments of the Hong Kong market. With 45 constituents, the index covers
MSCI Hong Kong
approximately 85% of the free float-adjusted market capitalization of the Hong Kong equity universe.
The MSCI Zhong Hua Index is a composite index that comprises the MSCI China (75%) and MSCI Hong Kong Index (25%). The index captures large and mid cap
representation across all China securities (B shares, H shares, Red Chips, P Chips and foreign listed shares) as well as Hong Kong securities. Currently, the index also includes
MSCI Zhong Hua
A stock connect large cap shares.
The MSCI India 10/40 Index (Total Return) is a free float-adjusted market capitalization index. The MSCI 10/40 index is designed to measure the performance of the large and
mid cap segments of the India market. It is designed and maintained on a daily basis to take into consideration of the 10% and 40% concentration constraints on funds. A fund
MSCI India 10/40
cannot invest more than 5% of its assets in securities issued by a single issuer. This limit can be increased up to 10%, provided that wherever the 5% limit is surpassed, the
fund’s exposure to these “larger” assets does not exceed 40% of the funds’ total assets.
The MSCI Indonesia Index is designed to measure the performance of the large and mid cap segments of the Indonesian market. With 31 constituents, the index covers about
MSCI Indonesia
85% of the Indonesian equity universe.
The MSCI Korea Index is designed to measure the performance of the large and mid cap segments of the South Korean market. With 111 constituents, the index covers about
MSCI Korea
85% of the Korean equity universe .
The MSCI Malaysia Index is designed to measure the performance of the large and mid cap segments of the Malaysian market. With 41 constituents, the index covers about
MSCI Malaysia
85% of the Malaysian equity universe .
The MSCI New Zealand Index is designed to measure the performance of the large and mid cap segments of the New Zealand market. With 7 constituents, the index covers
MSCI New Zealand
approximately 85% of the free float-adjusted market capitalization in New Zealand.
MSCI AC World Index captures large and mid cap representation across 23 Developed Markets (DM) and 23 Emerging Markets (EM) countries**. With 2,470 constituents, the
MSCI Philippines
index covers approximately 85% of the global investable equity opportunity set.
The MSCI Singapore Index is designed to measure the performance of the large and mid cap segments of the Singapore market. With 27 constituents, the index covers
MSCI Singapore
approximately 85% of the free float-adjusted market capitalization of the Singapore equity universe.
The MSCI Taiwan Index is designed to measure the performance of the large and mid cap segments of the Taiwan market. With89 constituents, the index covers approximately
MSCI Taiwan
85% of the free float-adjusted market capitalization in Taiwan.
The MSCI Thailand Index is designed to measure the performance of the large and mid cap segments of the Thailand market. With 36 constituents, the index covers about 85%
MSCI Thailand
of the Thailand equity universe .
For Institutional/Investment Professional Use Only. Not for distribution to the public. QMSR. 556716 18Investment Considerations
A widespread health crisis such as a global pandemic deducted monthly for the 10-year period, the securities was or will be profitable. Top ten holdings
could cause substantial market volatility, exchange- annualized compounded return would be 9.43% and information combines share listings from the same
trading suspensions and closures, and affect portfolio the ending dollar value would be $246,355. Unless issuer, and related depositary receipts, into a singular
performance. For example, the novel coronavirus otherwise noted, returns greater than 1 year are holding to accurately present aggregate economic
disease (COVID-19) has resulted in significant annualized; calendar year returns for each one year interest in the referenced company.
disruptions to global business activity. The impact of a period end in December. Discrepancies may occur
No investment strategy or risk management technique
health crisis and other epidemics and pandemics that due to rounding. Past performance does not
can guarantee returns or eliminate risk in any market
may arise in the future, could affect the global guarantee future results.
environment. Diversification or asset allocation does
economy in ways that cannot necessarily be foreseen
Performance information shown is generally for not guarantee a profit or protect against the risk of a
at the present time. A health crisis may exacerbate
discretionary strategies/solutions and managed by a loss in any market. The indices referenced herein are
other pre-existing political, social and economic risks.
Manulife entity which is GIPS compliant and falls broad-based securities market indices and used for
Any such impact could adversely affect the portfolio’s
under the definition of a corresponding Manulife GIPS illustrative purposes only. The indices cited are widely
performance, resulting in losses to your investment.
firm. Some investment strategies/solutions may not accepted benchmarks for investment performance
Any performance information shown is the investment be included in a GIPS compliant firm under certain within their relevant regions, sectors or asset classes,
strategy composite gross of fees, including advisory circumstances, such as SMA/UMA business in and represent non-managed investment portfolios.
and investment management fees and other expenses Canada.
If derivatives are employed, note that investing in
an investor would incur, but net of transaction costs,
Any characteristics, guidelines, constraints, or other derivative instruments involves risks different from, or
unless otherwise noted; deduction of such expenses
information provided for this material was selected by possibly greater than, the risks associated with
would reduce returns. Net performance results reflect
the firm as representative of the investment strategy investing directly in securities and other traditional
the application of the highest incremental rate of the
and is provided for illustrative purpose only, may investments and, in a down market, could become
standard investment advisory or management fee
change at any time, and may differ for a specific harder to value or sell at a fair price.
schedule to gross performance results, unless
account. Each client account is individually managed;
otherwise indicated. Changes in exchange rates may Information about SFDR
actual holdings will vary for each client and there is no
have an adverse effect. Actual fees may vary Unless otherwise noted, any references in this
guarantee that a particular client’s account will have
depending on, among other things, the applicable fee presentation to ESG or sustainability reflect the
the same characteristics as described herein. Any
schedule, portfolio size and/or investment general approach of Manulife Investment
information about the holdings, asset allocation, or
management agreement. For example, if $100,000 Management to integrating sustainability risk
sector diversification is historical and is not an
were invested and experienced a 10% annual return considerations into our investment decision-making
indication of future performance or any future portfolio
compounded monthly for 10 years, its ending value, processes. Further details on Manulife Investment
composition, which will vary. Portfolio holdings are
without giving effect to the deduction of advisory or Management’s general approach to sustainability are
representative of the strategy, are subject to change
investment management fees, would be $270,704 available at www.manulifeim.com/institutional
at any time, are not a recommendation to buy or sell a
with an annualized compounded return of 10.47%. If /global/en/sustainability.
security, and do not represent all of the securities
an advisory or investment management fee of 0.95%
purchased, sold or recommended for the portfolio. It The source for all information shown is Manulife
of the average market value of the account were
should not be assumed that an investment in these Investment Management, unless otherwise noted.
For Institutional/Investment Professional Use Only. Not for distribution to the public. 19Important Information
© 2022 Manulife Investment Management. All rights reserved. Investment Management and Trust Corporation. Singapore: The information in this material may contain projections or other
Manulife, Manulife Investment Management, Stylized M Design, and Manulife Investment Management (Singapore) Pte. Ltd. (Company forward-looking statements regarding future events, targets,
Manulife Investment Management & Stylized M Design are Registration No. 200709952G) South Korea: Manulife Investment management discipline or other expectations, and is only current as
trademarks of The Manufacturers Life Insurance Company and are Management (Hong Kong) Limited. Switzerland: Manulife IM of the date indicated. The information in this material including
used by it, and by its affiliates under license. (Switzerland) LLC. Taiwan: Manulife Investment Management statements concerning financial market trends, are based on current
(Taiwan) Co. Ltd. United Kingdom: Manulife Investment market conditions, which will fluctuate and may be superseded by
This confidential document is for the exclusive use of the intended Management (Europe) Ltd. which subsequent market events or for other reasons. This material was
institutional investors or their agents and may not be transmitted, is authorised and regulated by the Financial Conduct Authority prepared solely for informational purposes and does not constitute,
reproduced or used in whole or in part for any other purpose, nor United States: John Hancock Investment Management LLC, and is not intended to constitute, a recommendation, professional
may it be disclosed or made available, directly or indirectly, in whole Manulife Investment Management (US) LLC, Manulife Investment advice, an offer, solicitation or an invitation by or on behalf of
or in part, to any other person without our prior written consent. Management Private Markets (US) LLC and Manulife Investment Manulife Investment Management or its affiliates to any person to
About Manulife Investment Management Management Timberland and Agriculture Inc. Vietnam: Manulife buy or sell any security or to adopt any investment strategy, and
Investment Fund Management (Vietnam) Company Limited. shall not form the basis of, nor may it accompany nor form part of,
Manulife Investment Management is the global wealth and asset any right or contract to buy or sell any security or to adopt any
management segment of Manulife Financial Corporation. We draw No Manulife entity makes any representation that the contents of investment strategy. Nothing in this material constitutes investment,
on more than a century of financial stewardship to partner with this presentation are appropriate for use in all locations, or that the legal, accounting, tax or other advice, or a representation that any
clients across our institutional, retail, and retirement businesses transactions, securities, products, instruments or services discussed investment or strategy is suitable or appropriate to your individual
globally. Our specialist approach to money management includes in this presentation are available or appropriate for sale or use in all circumstances, or otherwise constitutes a personal recommendation
the highly differentiated strategies of our fixed-income, specialized jurisdictions or countries, or by all investors or counterparties. All to you. Neither Manulife Investment Management nor its affiliates
equity, multi-asset solutions, and private markets teams—along with recipients of this presentation are responsible for compliance with provide legal or tax advice, and you are encouraged to consult your
access to specialized, unaffiliated asset managers from around the applicable laws and regulations. own lawyer, accountant, or other advisor before making any
world through our multimanager model. This material is intended for the exclusive use of recipients in financial decision. Prospective investors should take appropriate
jurisdictions who are allowed to receive the material under their professional advice before making any investment decision. In all
This material has not been reviewed by, is not registered with any
applicable law. The opinions expressed are those of the author(s) cases where historical performance is presented, note that past
securities or other regulatory authority, and may, where appropriate,
and are subject to change without notice. Our investment teams performance does not guarantee future results and you should not
be distributed by the following Manulife entities in their respective
may hold different views and make different investment decisions. rely on it as the basis for making an investment decision.
jurisdictions. Additional information about Manulife Investment
Management may be found at manulifeim.com/institutional These opinions may not necessarily reflect the views of Manulife
Investment Management or its affiliates There can be no assurance
Australia: Manulife Investment Management Timberland and that actual outcomes will match the assumptions or that actual
Agriculture (Australasia) Pty Ltd, Manulife Investment Management returns will match any expected returns. The information and/or
(Hong Kong) Limited. Canada: Manulife Investment Management analysis contained in this material has been compiled or arrived at
Limited, Manulife Investment Management Distributors Inc., from sources believed to be reliable, but Manulife Investment
Manulife Investment Management (North America) Limited, Manulife Management does not make any representation as to their
Investment Management Private Markets (Canada) Corp. China: accuracy, correctness, usefulness or completeness and does not
Manulife Overseas Investment Fund Management (Shanghai) accept liability for any loss arising from the use of the information
Limited Company. European Economic Area: Manulife Investment and/or analysis contained here. Neither Manulife Investment
Management (Ireland) Ltd. which is authorised and regulated by the Management or its affiliates, nor any of their directors, officers or
Central Bank of Ireland Hong Kong: Manulife Investment employees shall assume any liability or responsibility for any direct
Management (Hong Kong) Limited. Indonesia: PT Manulife Aset or indirect loss or damage or any other consequence of any person
Manajemen Indonesia. Japan: Manulife Investment Management acting or not acting in reliance on the information contained here.
(Japan) Limited. Malaysia: Manulife Investment Management (M)
Berhad 200801033087 (834424-U) Philippines: Manulife
For Institutional/Investment Professional Use Only. Not for distribution to the public. 20Important Information (continued)
The distribution of the information contained in this presentation may Malaysia: This material was prepared solely for informational European Economic Area and United Kingdom: The data and
be restricted by law and persons who access it are required to purposes and is not an offer or solicitation by anyone in any information presented is directed solely at persons who are
comply with any such restrictions. The contents of this presentation jurisdictions or to any person to whom it is unlawful to make such an Professional Investors in accordance with the Markets in Financial
are not intended for distribution to, or use by, any person or entity in offer or solicitation. Instruments Directive (2004/39/EC) as transposed into the relevant
any jurisdiction or country in which such distribution or use would be jurisdiction. Further, the information and data presented does not
contrary to any applicable laws or regulations. By accepting this Singapore: This material is intended for Accredited Investors and constitute, and is not intended to constitute, "marketing" as defined
material you confirm that you are aware of the laws in your own Institutional Investors as defined in the Securities and Futures Act. in the Alternative Investment Fund Managers Directive.
jurisdiction relating to the provision and sale of the funds, portfolios South Korea: This material is intended for Qualified Professional
or other investments discussed in this presentation and you warrant United States: Manulife Investment Management (US) LLC
Investors under the Financial Investment Services and Capital (Manulife IM US) and Manulife Investment Management (North
and represent that you will not pass on or use the information Market Act ("FSCMA"). Manulife Investment Management does not
contained in this presentation in a manner that could constitute a America) Limited (Manulife IM NA) are indirect wholly owned
make any representation with respect to the eligibility of any subsidiaries of Manulife. John Hancock Investment Management
breach of such laws by any Manulife entity or any other person. recipient of these materials to acquire any interest in any security LLC and Manulife Investment Management (US) LLC are affiliated
Australia: Manulife Investment Management (Hong Kong) Limited under the laws of Korea, including, without limitation, the Foreign SEC-registered investment advisors using the brand name John
(Manulife IM (HK)) is exempt from the requirement to hold an Exchange Transaction Act and Regulations thereunder. An interest Hancock Investment Management. This material is not intended to
Australian financial services license under the Corporations Act in may not be offered, sold or delivered directly or indirectly, or offered, be, nor shall it be interpreted or construed as, a recommendation or
respect to the financial services being offered in this material. sold or delivered to any person for re-offering or resale, directly or providing advice, impartial or otherwise.
Manulife IM (HK) is regulated by the Securities and Futures indirectly, in Korea or to any resident of Korea, except in compliance
Commission of Hong Kong ("SFC") under Hong Kong laws, which with the FSCMA and any other applicable laws and regulations. The
differ from Australian laws. This presentation is directed at term “resident of Korea” means any natural person having his place
wholesale investors only. of domicile or residence in Korea, or any corporation or other entity
organized under the laws of Korea or having its main office in Korea.
China: No invitation to offer, or offer for, or sale of any security will
be made to the public in China (which, for the purposes of this Switzerland: This material is intended for Professional Clients,
paragraph, does not include the Hong Kong or Macau Special including Institutional Clients, as defined in the Federal Financial
Administrative Regions or Taiwan) or by any means that would be Services Act ("FinSA") and its implementing ordinance, at the
deemed public under the laws of China. The offering document of exclusion of Professional Clients with an opting-out pursuant to Art.
the subject fund(s) has not been submitted to or approved by the 5 (1) FinSA ("Opting-Out Clients"), and/or Qualified Investors
China Securities Regulatory Commission or other relevant pursuant to the Federal Collective Investment Schemes Act ("CISA")
governmental authorities in China. Securities may only be offered or and its implementing ordinances, at the exclusion of Opting-Out
sold to Chinese investors that are authorized to buy and sell Clients and Managed/Advisory Retail Clients pursuant to Art. 10
securities denominated in foreign exchange. Prospective investors (3ter) CISA where relevant. The information provided in this material
resident in China are responsible for obtaining all relevant approvals is for information purpose only and does not constitute an offer, a
from the Chinese government authorities, including but not limited to solicitation or a recommendation to contract a financial instrument or
the State Administration of Foreign Exchange, before investing. a financial service as defined under FinSA. This material does not
constitute an implicit or explicit investment advice. The information
Hong Kong: This material is provided to Professional Investors, as provided herein is general in nature and does not constitute an
defined in the Hong Kong Securities and Futures Ordinance and the advertisement of financial products in Switzerland pursuant to FinSA
Securities and Futures (Professional Investor) Rules, in Hong Kong and its implementing ordinance.
only. It is not intended for and should not be distributed to, or relied
upon, by members of the public or retail investors.
For Institutional/Investment Professional Use Only. Not for distribution to the public. 21You can also read