Characterisation of particulate matter and identification of emission sources in Greater Caracas, Venezuela
←
→
Page content transcription
If your browser does not render page correctly, please read the page content below
Air Quality, Atmosphere & Health
https://doi.org/10.1007/s11869-021-01070-2
Characterisation of particulate matter and identification of emission
sources in Greater Caracas, Venezuela
Giobertti Morantes1,2 · Jean Carlos González2 · Gladys Rincón2,3,4
Received: 5 April 2021 / Accepted: 28 July 2021
© The Author(s) 2021
Abstract
Between June and September 2018, particulate matter (PM) samples were taken in the Sartenejas Valley, southeast of Greater
Caracas, Venezuela. The aim was to evaluate the morphology and the elemental chemical composition of particulate matter
and establish possible emission sources during the rainy season. Functional groups were identified by FTIR spectroscopic
analysis, and morphology and elemental composition were obtained by SEM–EDX analysis. The sampling period coincided
with a Sahara dust storm. The SEM–EDX and FTIR analyses found evidence of mineral elements related to soil and crustal
origins. The presence of C-rich or C-containing aerosols is related to biological sources or mineral carbon. SEM–EDX
analysis of PM revealed the following particle groups: geogenic, metallic, C-rich, and secondary aerosols. Quantitative
source appointments through principal component analysis (PCA) corroborated PM sources, including soil dust, sea salts,
and reacted aerosols. According to the authors’ knowledge, this study represents the first report to indicate that an episode
of African dust could influence the particles collected in an intertropical continental sector in Venezuela, South America.
Keywords Particulate matter · SEM–EDX analysis · FTIR analysis · PCA · Emission sources · Venezuela
Introduction 2.5 < Dp ≤ 10 µm coarse fraction (WHO 2006). The most
petite particle sizes (including PM2.5) have the most negative
Particulate matter (PM) refers to any substance, except pure impacts on human health and climate change (Cohen et al.
water, that exists as a liquid or solid in the atmosphere under 2017; Yin et al. 2020; HEI 2019). In addition, PM may have
normal conditions and is microscopic or submicroscopic a natural or anthropogenic origin; particles of natural origin
but larger than molecular dimensions (Seinfeld and Pandis come from soil erosion, resuspended soil dust, sea salt trans-
2016). PM can be classified according to its aerodynamic port, forest fires, volcanic eruptions, and fractionated bio-
diameter (Dp) in P M2.5 (Dp ≤ 2.5 µm), PM10 (Dp ≤ 10 µm), logical material emissions. Particles of anthropogenic origin
and TSP (total suspended particles) (Dp ≤ 70 µm). The result from human activities as vehicular traffic (mainly from
PM2.5 is also called fine fraction and particles between vehicles with diesel engines), combustion and industrial pro-
cesses, mining-metallurgical activity, and biomass burning
(Aragón-Piña, 2011a, b).
* Giobertti Morantes Studies have been set to describe the Venezuelan air qual-
giobertti.morantesquintana@nottingham.ac.uk ity using PM as an indicator, including the research by Gua-
1
Department of Architecture and Built Environment, jardo et al. (2010) about PTS-annual in Caracas between
University of Nottingham, Nottingham NG7 2RD, UK 1981 and 2006, in six stations belonging to the Ministry
2
Departamento de Procesos y Sistemas, Universidad Simón of the Environment of that country. Venezuela exceeded
Bolívar, Laboratorio de Carbón y Residuales de Petróleo, its standard in two stations (PTS-annual < 75 μg m−3):
Caracas, Venezuela west industrial area and in the city’s downtown. The other
3
Facultad de Ingeniería Marítima y Ciencias del Mar, four stations met the country’s standard: Venezuela has not
Escuela Superior Politécnica del Litoral, ESPOL, Campus updated the environmental regulations on air quality since
Gustavo Galindo km 30.5 Vía Perimetral, P.O. Box 09, 1995, and they do not include PM10 or PM2.5 (Morantes et al.
01‑5863 Guayaquil, Ecuador
2016). Therefore, complying with Venezuelan environmen-
4
Pacific International Center for Disaster Risk Reduction, tal standards does not guarantee the protection of human
ESPOL, Guayaquil, Ecuador
13
Vol.:(0123456789)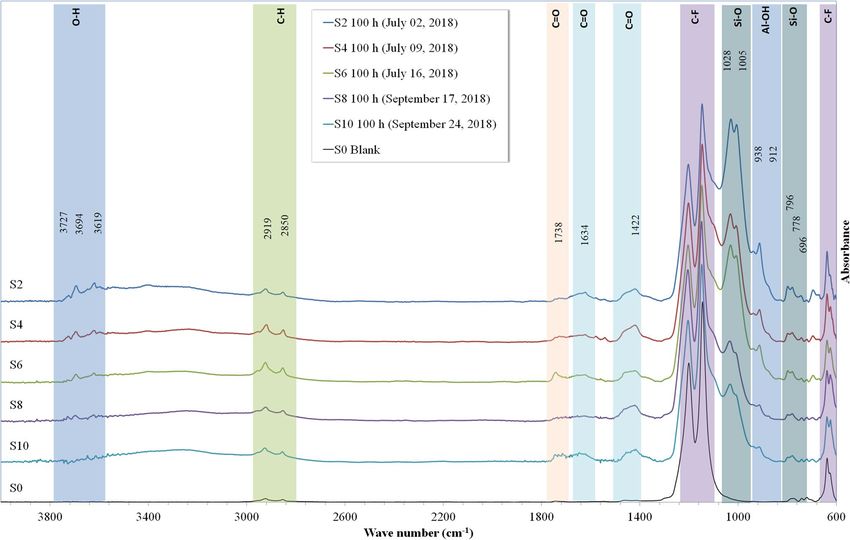
Air Quality, Atmosphere & Health
health. For Maracaibo, the second most important city in that Furthermore, PM composition is used for source appoint-
country, the TSP-annual concentrations between 2001 and ment. Therefore, knowing the composition of particles is
2008 remained above the Venezuelan regulation (between 75 becoming essential in recent research. Scanning electron
and 200 μg m−3). TSP concentration level was related to the microscopy coupled with energy-dispersive spectrometry
city’s industrial park, vehicular traffic, soils devoid of veg- (SEM–EDX) is an instrumental technique that allows the
etation, and buildings (Montes and Hurinson 2013). While characterisation via particles’ morphological and elemental
for 2009 in the same town, P M2.5-annual (36.2 µg m−3) and composition. Another method includes infrared spectros-
−3
PM10-annual (80.8 µg. m ) were reported to exceed the copy (FTIR) that identifies the functional groups in PM. The
then-current US EPA Standards, for P M2.5-annual (2009) authors had applied both techniques together to complement
and PM10-annual (1997) (Morales et al. 2012). In Valen- the findings of each independent analysis. SEM–EDX and
cia, in 1996, measured TSP in the rainy and dry seasons FTIR have been used to propose the presence of plausible
amounted to 75–200 μg m−3 (Martínez 1997). These levels particle groups in mixtures of sampled aerosols (Ochsen-
once again exceed the obsolete Venezuelan environmental kühn-Petropoulou et al. 2009; Bharti et al. 2017; Radulescu
standard. A PM dispersion modelling was developed for et al. 2017; Huda et al. 2018; Zeb et al. 2018).
an industrial oil area in the northeast of the country. The In Venezuela, there are limited studies on particulate mat-
authors concluded that under a conservative pollution sce- ter composition employing SEM–EDX and FTIR. However,
nario, people could live risk episodes for PM10 and SO2 other physicochemical techniques have been used. For a
(Rincón and Cremades 2012). These studies used data from locality near Maracaibo (during rain and drought), García
more than 10 years ago; nonetheless, they revealed that the et al. (2002) analysed TSP particles by atomic absorption
air quality in northern Venezuelan cities is compromised. spectroscopy. They found Pb, V, Ca, Ni, Fe, and Mn in the
In the Boreal summer (period June–August), African aerosols and associated them with emissions from a nearby
dust storms generated in the Saharan Desert annually reach cement factory and high vehicular traffic. Mn, Fe, and Ca
the American continent crossing the Atlantic and the Car- were related to resuspended dust. They also highlighted the
ibbean Sea (western Atlantic Ocean) (Euphrasie-Clotilde marked influence of the rain and drought on the concentra-
et al. 2021; Adams et al. 2012). During this period, there tion and composition of TSP. Machado et al. (2007, 2008)
is a continuous alternation between African Easterly Waves measured, in Maracaibo, the levels of metals (Pb, Ni, Zn,
and dust plumes. The most recently recorded event in June Cr, Al, Cu, V, Cd) in PM10 emitted from mobile sources
2020 refers to an extremely intense dust plume dubbed sites with high vehicular density in rain and drought. These
“Godzilla” reaching the Atlantic Ocean (Euphrasie-Clotilde researchers found significant differences between the meas-
et al. 2021). Trapp et al. (2010) reported that Boreal summer urement sites and the climatic seasons in P
M10 concentration
is the maximum African dust transport season to Miami and and metals. Duque et al. (2010), near Maracaibo in 2008,
Barbados. In the same lines, Engelstaedter et al. (2009) point evaluated PM10 using SEM–EDX in the dry and rainy sea-
out that the annual cycle of Sahara dust concentrations in sons. They grouped the analysed particles based on Si, Si-Al,
Barbados reaches the seasonal maximum in April–August. S-Ca, Cl-Na, Fe, S, and Cl contents. Sources were related
Muhs et al. (2007) studied African dust inputs to soils of to soil and the marine environment. The authors found a
western Atlantic islands (Barbados, Bahamas, and Flor- significant difference between the elemental composition
ida), being July the month with the most wind-transported of the wet and dry periods. PM studies for Venezuela are
dust from Africa. These authors and Prospero et al. (2014) not recent, and none has characterised aerosols in Caracas.
hypothesise that African clouds of dust may be significant Therefore, uncertainty remains about the PM characteristics
contributors to soils in northern South America (Cayenne, in this city and about the possible presence of aerosols from
French Guiana and Guadeloupe, Lesser Antilles). Reid et al. other latitudes.
(2003) also characterised African dust transported to Puerto Morantes et al. (2019), in a study in the Sartenejas Val-
Rico between June and July in 2000. Venezuela, located in ley (southeast of Greater Caracas), sampled different PM
the Tropical North Atlantic over the Caribbean, could also fractions between August 2014 and October 2015. The PM
receive Saharan dust. However, according to the authors’ concentrations were influenced by forest fire events (drought
knowledge, there are no known studies that inquire into the in Sartenejas Valley) and the rains. However, the morphol-
influence of African dust episodes in northern Venezuela. ogy and composition of PM were outside of the scope of
Although particle size determines PM ability to pen- that study.
etrate the respiratory system, the chemical composition Based on the influence of seasonality and Sahara storms
could accentuate its effects on mortality and morbidity: over the composition and concentration of PM and the lack
PM can be toxic, carcinogenic, mutagenic, and teratogenic of knowledge about the physicochemical characterisation of
due to the components in its mixture (Franklin et al. 2008; PM in Venezuela, the objective of this research is to evaluate
Atkinson et al. 2014; Apte et al. 2015; Wang et al. 2019). the morphology and the elemental chemical composition of
13Air Quality, Atmosphere & Health
particulate matter to establish possible sources of emission in sampling station (AireUSB) was installed at the height of
an urban sector of Greater Caracas in Venezuela, during the 9 m; this height ensures that the air is representative of the
rainy season between June and September 2018. sector (UTM coordinates, 10.412352; − 66.883558 m) (see
Fig. A1 in Online Resource 1). Sampling for PM2.5 was car-
Study area ried out with a dichotomous air sampler (Partisol 2000i-D
Dichotomous Air Samplers, THERMO Fischer Scientific,
The Sartenejas Valley is located in Greater Caracas, in a MA, US). The meteorological data was collected with Davis
continental area north of Venezuela (see Fig. A1 in Online Instruments 2010 equipment, which operated 24 h a day
Resource 1). It has an altitude between 1200 and 1400 m during the sampling period. The variables controlled with
above sea level and occupies 230 ha. In the flat part of the this meteorological station were punctual measurements, and
Valley is a university campus that occupies about 95 ha, of the nominal accuracy indicated on the equipment manual for
which 45 are plantations with a high density of pine forest, each variable is the temperature (± 3 °C), the solar radiation
native forest, secondary shrubland, and savanna with diverse (± 5%), wind direction (± 3°), wind speed (± 1 m ~ s−1), and
shrubs. In the green areas surrounding the campus, forest fires precipitation (± 0.02 mm) (Davis Instruments, 2020).
frequently occur during the dry season, with haze episodes The sampler operates by splitting PM sample streams into
(Foghin-Pillin 2012, 2015). The central position of Venezuela a fine and a coarse fraction using a virtual impactor. Sam-
in South America (in the middle of the northern intertropical plers are typically characterised by their cut point, which
zone, very close to the equator and open to the Caribbean Sea) defines the particle size for which the penetration is 50%
means that it has an intertropical climate. Its climate is charac- (the cut point D50). The partisol operates at a flow rate of
terised by a rainy season (May–November) and a dry season 15.0 L m in−1 to provide a D50 at 2.5 μm (Loo and Cork
(December–April). In Fig. A2_1 in Online Resource 1, the 1988; Thermo Fisher Scientific 2011). PTFE membrane fil-
historical climogram (1970–2000) is shown with data from La ters (polytetrafluoroethylene, known as Teflon-CF2) of 2-µm
Mariposa meteorological station administered by the National pore were used (46.2 mm in diameter with a support ring).
Institute of Meteorology and Hydrology (UTM coordinates The samples were put in aluminium foil, sealed with a plas-
10.40417; − 66.92500 m) located 5.6 km from the Sartenejas tic cover, and stored in a refrigerator until further analysis.
Valley. This figure clearly shows the two seasons that charac- The sampling campaign was carried out between June
terise the region (rain and drought). 30th and July 23rd, 2018 (S1–S7 samples) and September
Socioeconomically, the Sartenejas Valley’s surroundings 17th–October 6th, 2018 (S8–S13 samples). The period
show urban characteristics typical of Greater Caracas, where includes the Boreal summer and avoids the season of local
middle-class and upper-class urbanisations border with low- forest fires. Samples were collected twice a week for sam-
income urbanisations. Country-wise, there is a trend towards pling times of 48 h (Saturday–Sunday; i.e. weekends) and
a progressive increase in the population’s concentration in the 100 h (Monday–Friday; i.e. during the week) for a total of
lower social strata (Ramirez 2012). In these strata, public ser- thirteen samples: one sample (S12—01/10/2018) was dis-
vices are scarce, which affects the waste management system’s carded due to contamination during handling for physico-
functioning, leading to improper burning of garbage, causing chemical analysis. No samples were ruled out due to rain.
pollution and representing serious fire hazards (Ramos et al. Thus, the overall account of samples in this study comes to
2012). 12 samples. The sampling times were chosen to secure the
In this sector, people perceive good air quality despite necessary weight in the filters following a previous sampling
there being a highway with high vehicular traffic at a distance in the Valley Sartenejas (Morantes et al. 2019).
of 2 km to the northwest (exit to the country’s west). About Fig A2_2 in Online Resource 1 shows meteorology vari-
3.5 km to the southeast, there is an industrial-residential area. ables during the sampling period. Fig. A2_2 (b) presents
The Sartenejas Valley’s surroundings have presented an accel- the temperature and precipitation in the Sarteneja Valley;
erated urbanisation process that is causing high vehicular traf- the figure shows the dates of greatest precipitation (S9—
fic and an increase in low-income settlements. The university 09/22/2018: 24.10 mm and S10—09/24/2018: 9.00 mm),
campus dominates the urban landscape of the Valley. which coincide with the dates of highest temperature
(S8—09/18/2018: 25.1 °C and S9—09/22/2018: 23.5 °C).
Fig. A2_2 (c) shows that the predominant wind directions
Methods were East-Northeast and Northeast, with a predominant
speed lower than 8.12 m s−1 ± 1 m s−1 and 35% calm winds.
PM2.5 sampling From the table shown in Fig. A2_2 (a), the average monthly
temperature in the Sartenejas Valley remained between 17.9
A PM collection campaign was carried out on the university and 25.1 °C (Taverage ~ 19.4 ± 2.2 °C); the relative humidity
campus at the Sartenejas Valley. The particulate material varied between 85.3 and 98.0% (Hraverage ~ 88.5 ± 3.4%);
13Air Quality, Atmosphere & Health
average wind speed was ~ 2.50 ± 1.2 m s−1 (0.00–8.12 m s−1), PM physicochemical characterisation
with 5 samples recording no rainfall and 7 samples with
accumulated rainfall between 1.76 and 24.10 ± 0.2 mm. Sampled PM filters were divided into two sections: one was
analysed by Fourier transform infrared spectroscopy (FTIR)
to identify the functional groups present in particulate mate-
Analytical techniques rial (non-individual particulate analysis). Scanning electron
microscopy (SEM) was used to analyse the other section of
FTIR spectroscopic analysis the filter to know the particles’ morphology and elemental
composition (individual particle analysis).
Teflon filters were analysed by Fourier transform infrared FTIR was used to identify the possible sources of emis-
spectroscopy–attenuated total reflectance (ATR-FTIR). Fil- sion of the PM; for this, characteristic signals were identi-
ters were scanned 200 times at 4 cm−1 resolution, producing fied for the specific functional groups through their frequen-
an infrared absorbance spectrum from 600 to 4000 cm−1. cies. Sources were assigned through an exhaustive literature
Twelve samples (plus two filter blanks) were directly ana- review of previous research on spectroscopy of atmospheric
lysed by FTIR spectroscopy using Thermo Nicolet equip- aerosols. Like other authors, we try to relate functionality
ment, model iS5 with ZnSe crystal. A blank filter spectrum identified in airborne PM with its possible origin: Cunning-
was analysed to identify its characteristic signals and obtain ham et al. (1974); Allen et al. (1994); Blando et al. (1998);
the final sample’s spectrum. Maria et al. (2002, 2003); Shaka’ and Saliba (2004); Reff
Each spectrum was subsequently normalised to the high- et al. (2005); Senthil and Rajkumar (2013); Saikia et al.
est characteristic signal of the Teflon filter. Each spectrum (2016).
was taken in triplicate. The magnitude in the intensity of The SEM–EDX analysis provides information to design
the signals was measured from the baseline. The pre-scan clustering rules of the particles, through which categories,
spectrum was subtracted from the post-scan spectrum using groups and subgroups of particles with similarities will be
software Omnic 7.3 (Thermo Nicolet) and software Spec- identified, taking into account (i) the elements found and
tragryph 1.2. A mark was established on the filter holder to their %wt; (ii) morphology; and (iii) bibliographic review
ensure that the orientation of each filter was constant. to identify similarities based on the experience of the fol-
lowing authors: Matthias-Maser and Jaenicke (1991, 1994);
US-EPA (2002); Gao et al. (2007); Kandler et al. (2007);
SEM–EDX analysis Vester et al. (2007); Cong et al. (2009); Campos-Ramos
et al. (2010); Coz et al. (2010); Pachauri et al. (2013); Geng
The scanning electron microscopy (SEM) analysis was car- et al. (2014); Mico et al. (2015); Durdziński et al. (2015);
ried out with the help of a computer-controlled scanning Zeb et al. (2018); Eriksen Hammer et al. (2018). In addition,
electron microscope (JEOL model JSM6390) coupled with clustering rules allow us to assign possible sources of origin.
an energy-dispersive spectroscopy (EDX) (Inca software). Thus, both techniques together (FTIR and SEM–EDX) com-
The SEM working conditions were set at an accelerating plement the particles’ qualitative recognition information.
voltage of 30 kV. The images were recorded at two different
magnifications, 1000 × and 500 × .
Sections of ~ 2 cm2 of filters were cut for SEM–EDX sam- Saharan dust influence
ples. With a vacuum unit’s help, a skinny layer of gold (Au)
was put over each sample surface to achieve better conduc- To study the Saharan dust influence over the PM samples,
tivity and reduce electron charge. The sputter can prepare six we separated them according to the Boreal summer months
samples simultaneously. Microscope magnifications of 100, into S1–S7 (July) and S8–S13 (September). FTIR signals are
50, 20, and 10 µm were used. About fifteen random parti- qualitatively analysed to detect possible differences between
cles were selected on each field filter, giving approximately samples. A quantitative analysis is performed using the Stu-
fifteen manually characterised particles per filter. The EDX dent t-test and Mann–Whitney U test for mean differences.
spectra of blank filters were also measured and subtracted The Pearson correlation coefficient is used for assessing rela-
from the samples (see Fig. A3 in Online Resource 3). tionships among variables.
The blank filter’s elemental composition showed an
approximate 1C:2F ratio and was coated in gold. The con-
tributions of C, F, and Au were manually subtracted during PM quantitative source appointment
the EDX spectrum evaluation. The weight percent of each
element present in the spectrum was identified and normal- Principal component analysis (PCA) and hierarchical clus-
ised to 100%wt. ter analysis (HCA) have been widely used in the study of
13Air Quality, Atmosphere & Health
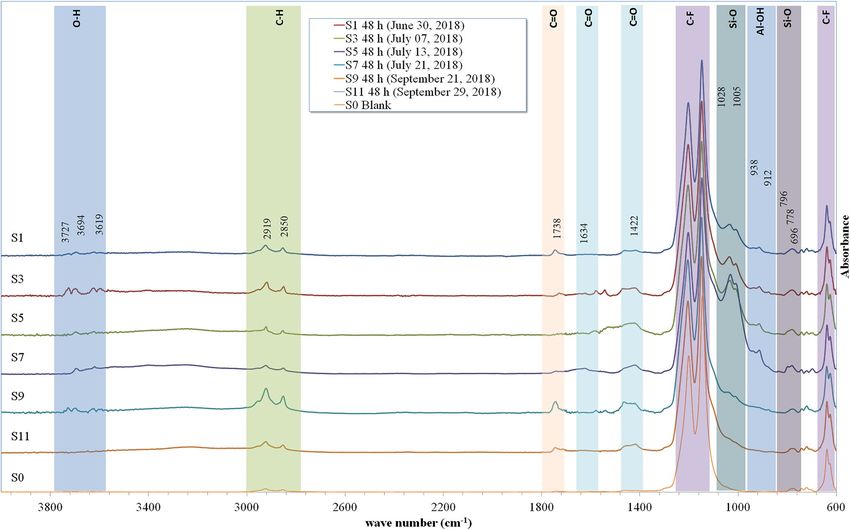
particulate matter for identifying the relationships between Figures 1 and 2 show the FTIR spectra taken for weekends
particles and their sources (Chavent et al. 2009; Kothai et al. (48 h) and during the week (100 h), respectively. Samples
2011; Genga et al. 2012; Tsitouridou et al. 2013; Błaszczak taken for 48 and 100 h had similar spectra trends, revealing
2018). The elemental composition of particles (%wt) that anthropogenic activity does not change during the week
obtained with SEM–EDX was used for source appointment and on weekends. Furthermore, samples taken for 100 h
applying PCA and HCA. Varimax rotation was used as the accumulated more mass resulting in higher FTIR absorp-
rotation method for PCA through the Spearman correlation. tion intensities (see Fig. A5 in Online Resource 1). Table 1
Likewise, HCA was used for comparing the results obtained shows the functional groups identified by ATR-FTIR.
from the PCA. XlSTAT statistical software was used. At different intensities, most spectra showed an absorp-
tion band located at 1031 cm−1, attributed to the asym-
metric stretching of the O-Si–O bonds in the silicate ion
SiO4− (Allen et al. 1994; Maria et al. 2002, 2003; Shaka’
Results and discussion and Saliba 2004). This ion also exhibits weaker absorptions
at 780 and 800 cm−1 due to the O-Si–O bond’s deforma-
FTIR spectroscopic analysis tion vibration (Cunningham et al. 1974; Shaka’ and Saliba
2004). The silicate minerals (like quartz) are considered
FTIR spectra showed numerous signals assigned to organic major inorganic constituents of particulate matter (Senthil
and inorganic functional groups such as carbonyls, aliphatic and Rajkumar 2013). The signal observed around 1006 cm−1
C–H bonds, hydroxyls, silicates, and nitrates. The blank corresponds to the Si–O stretches associated with alumi-
PTFE filter spectrum (see Fig. A4 in Online Resource 1) pre- nosilicates such as kaolinite [Al2(OH)4(Si2O5)]. Kaolinite
sented two intense bands in the region of 1000–1300 cm−1 has been found in PM samples and coarse fractions (Sen-
associated with the stretching of the C–F bonds, as well as thil and Rajkumar 2013; Reff et al. 2005). The absorption
two signals of less intensity around 640 cm−1. Additionally, bands in the range 3500–3750 cm−1 are also characteristic
it exhibited a pair of signals in the 2800–3000 cm−1 range of kaolinite due to OH’s stretching vibrations in the mineral
corresponding to the saturated C–H bonds. structure (Saikia and Parthasarathy 2010). The absorptions
Fig. 1 FTIR spectra: collection period 48h
13Air Quality, Atmosphere & Health Fig. 2 FTIR spectra: collection period 100h around 940–914 cm−1 can be associated with vibrations of 1422 cm−1. Another signal was also seen in 825–835 cm−1, hydroxyls and the Al–(OH) bond of kaolinite, respectively which corresponds to the absorption of the nitrate ion (Allen (Shaka’ and Saliba 2004; Saikia and Parthasarathy 2010; et al. 1994; Reff et al. 2005): nitrate ion is formed from Senthil and Rajkumar 2013; Anıl et al. 2014). the photo-oxidation of nitrogen oxides (NOx) and is related The signals in the range 2850–3000 cm−1 are character- to vehicle emissions (Senthil and Rajkumar 2013; Ji et al. istic of aliphatic hydrocarbons due to the symmetric and 2015). asymmetric stretching of the methyl (CH3) and methyl- Seinfeld and Pandis (2016) reported sulfates (SO4−2) ene (CH2) groups. They are represented by a pair of peaks in atmospheric aerosols formed from the photo-oxida- around 2924 and 2853 cm−1 (Allen et al. 1994; Maria et al. tion of sulfur dioxide. This ion is absorbed in the ranges 2002; Shaka’ and Saliba 2004; Reff et al. 2005). 612–618 cm−1 and 1103–1135 cm−1 (Allen et al. 1994; The vibrations observed in 1720–1760 cm−1 are attrib- Blando et al. 1998; Maria et al. 2002, 2003; Yu et al. 2018). uted to the carbonyl functional group present in aldehydes, The absorptions in both ranges could not be fully identified ketones, and carboxylic acids. Its absorption is reported in in this investigation because of the overlapping of the Teflon the range 1640–1850 cm−1, generally reaching a maximum filter signals; however, an interference was identified to the in 1714–1720 cm−1 (Allen et al. 1994; Reff et al. 2005; signal’s right at 1145 cm−1 of C–F bond of the Teflon, which Coury and Dillner 2009). could correspond to the 1100 cm−1 sulfate signal. The possible presence of nitrogen compounds was detected, such as aliphatic nitro groups that absorb more SEM–EDX analysis strongly around 1540–1570 cm−1. The aromatic nitro groups were observed in the band 1500–1530 cm−1 (Akhter et al. We analysed two hundred airborne particles from twelve 1984; Allen et al. 1994; Weakley et al. 2016). Ammonium samples collected by SEM–EDX. From this analysis, it salts’ absorptions are strong in the range of 1250–1540 cm−1, was established that the particles contain different ele- with peaks between 1410 and 1435 cm−1 (Allen et al. 1994). ments. Therefore, to analyse the PM, they are categorised In the samples, these salts were detected between 1417 and as geogenic, metallic, C-rich, and secondary aerosols; in 13
Air Quality, Atmosphere & Health
Table 1 Functional groups identified by ATR-FTIR
Frequency Mode of Vibration Functionality Possible source(s) Ref
Range
(cm−1)
3750–3995 Stretching –OH Kaolinite Soil related Senthil and Rajkumar (2013); Saikia
et al. (2016)
3670–3650 Stretching –OH Kaolinite Senthil and Rajkumar (2013); Saikia
et al. (2016)
3500–3300 Stretching –OH Alcohol and humidity Ambient humidity; mineral particles Allen et al. (1994); Reff et al. (2005)
2970–2850 Stretching C–H H. aliphatic ( CHx Saturated) Ambient humidity; mineral particles Allen et al. (1994); Maria et al. (2003)
1850–1640 Stretching C = O Carbonyl Combustion of fuel Allen et al. (1994); Maria et al. (2003)
1636 Stretching C = O Carbonate Senthil and Rajkumar (2013)
~ 1623 Deformation –OH Kaolinite Soil related Senthil and Rajkumar (2013); Saikia
et al. (2016)
1570–1540 R-NO2 Aliphatic nitro groups Vehicle emissions Allen et al. (1994)
1530–1540 NH4+ Ammonium ion Allen et al. (1994); Shaka’ and Saliba
(2004)
1422 Stretching C = O Carbonate Combustion of fuel Senthil and Rajkumar (2013)
1431 Stretching (CO3)−2 Carbonate Senthil and Rajkumar (2013)
~ 1030 Stretching Si–O Quartz/Kaolinite Soil related Cunningham et al. (1974); Maria et al.
(2002, 2003); Senthil and Rajkumar
(2013); Saikia et al. (2016)
~ 1006 Stretching Si–O Aluminosilicate Senthil and Rajkumar (2013)
~ 938 Deformation Al–OH Kaolinite Senthil and Rajkumar (2013); Saikia
et al. (2016)
~ 913 Deformation Al–OH Kaolinite Senthil and Rajkumar (2013); Saikia
et al. (2016)
825–835 NO3− Nitrates Vehicle emissions Allen et al. (1994); Blando et al. (1998)
~ 797 Bending Si–O Quartz/Kaolinite Soil related Cunningham et al. (1974); Maria et al.
(2002, 2003); Senthil and Rajkumar
(2013); Saikia et al. (2016)
~ 778 Stretching Si–O Quartz Senthil and Rajkumar (2013); Saikia
et al. (2016)
~ 745 Stretching Al–O–Si Kaolinite Saikia et al. (2016)
~ 718 Stretching Fe–O Magnetite Senthil and Rajkumar (2013)
~ 696 Stretching Si–O Quartz Saikia et al. (2016)
turn, the various categories were organised into groups and events that reached the sampling area on those dates. For
subgroups/possible compounds (see Fig. 3). the SEM–EDX analysis, particles were chosen at random
A visual scan of the SEM–EDX images of the filters regardless of their size.
showed a high presence of particles with Dp > 2.5 μm. The most abundant elements were C, O, and Si, and
Claiborn et al. (2000), in their study, found that in dust the least abundant were Ca, Al, Mg, S, Cl, Fe, K, and
storm transport events, P M2.5 correlates more favourably Ti. Based on the bibliographic review on elemental com-
with PM10 than with finer fractions ( PM1). On the other position, clustering rules, and morphology, the particles
hand, Wagner and Casuccio (2014), in a study of urban were classified in this investigation, as shown in Table 2.
desert regions in the USA, showed that in the filters with This table lists particles organised according to the rela-
greater accumulation of mass, there were a significant tive abundance, possible compounds, clustering rules, the
number of large particles; the particles of the P
M2.5 filter average elemental composition of each group/subgroup,
had diameters of up to 15 μm. Likewise, Wagner et al. and their morphology. Figure 4 shows the SEM photomi-
(2019) associated the presence of coarse particles with crographs representatives of all particle groups.
re-dragging and the action of strong winds. We detected
an abundance of large particles in the PM filters, espe- 1) Geogenic particles’ category (relative abundance
cially for July’s samples, resulting from dust transport 52.05%)
13Air Quality, Atmosphere & Health
Fig. 3 Overview of categorisation used for particles
Geogenic particles are natural or minerogenic of crustal Jung et al. 2012; Campos et al. 2009; Fišák et al. 2012;
origin. Elemental analysis has revealed particles contain- Cvetković et al. 2012; Huang et al. 2018).
ing at least one of the following elements: Na, Mg, Al, Si, This group is divided into five subgroups: one con-
Cl, K, Ca, and Fe, which are soil derived (mineral dust). taining only Mg-Fe (iron-magnesium aluminosilicates),
The geogenic category has the highest relative abundance, and another containing Mg-Fe plus other elements
indicating local and transported dust dominance. This group (montmorillonite or Mg-vermiculite). Fe and Mg cor-
comprises unreacted mineral dust, aluminosilicates, Si-rich, relate at r = 0.823 (p = 0.01) for both subgroups, which
Ti-containing, Ca-rich, Cl-rich, and Mg-rich particles. allow for differentiating these particles from others. Fur-
thermore, this type of particles is related to dust resus-
1.1) Unreacted mineral dust group (Fe-mixture) (relative pension; therefore, wind could have played an essential
abundance 23.93%) role in the heterogeneous mixing process of mineral
A mixture of aluminosilicate particles with iron, mag- dust.
nesium, and/or sodium and other soil-related compounds Other unreacted mineral dust particles contained
was observed. Particles containing Al-Si–O-Fe as major combinations of Fe-Na and K-Cl-Ca-Mg. These parti-
elements (%wt) plus Mg and/or Na were classified as cles were classified into three subgroups based on their
per the clustering rules shown in Table 2. These are elemental composition and/or particular morphology
unreacted mineral dust or mixtures of aluminosilicate (see Table 2). The Al-Si–O-Fe-Na subgroup’s mor-
particles with other crustal elements such as Fe, K, Ca, phology tended to go from round to sharp when NaCl
Na, and Mg, originating from the earth. This type of dust %wt increased in the mix, indicating that the NaCl par-
is mixed with various inorganic materials making their ticles came from various sources. The varying amounts
compositions complicated. Other authors have also char- of NaCl can result from mixing mechanisms in the air,
acterised these Fe-mixtures with analytical techniques including particle-to-particle collisions and coagulation
(i.e. EDX, XRD, XAFS) and morphology characteristics of mineral dust with Cl-rich aerosols.ww Na
(Geng et al. 2014; Mico et al. 2015; Boev et al. 2013; and Cl correlate (r = 0.498; p = 0.01) in one of the unre-
13Table 2 Classification of particle groups based on their SEM–EDS spectral data, major selection criteria, possible sources/explanations, and morphology
Category Source Particle Sub groups Possible minerals Selection criteriaa Elemental com- Morphology of References
groups (relative abun- position of each particles
(relative abun- dance) sub-type (%wt)b
dance)
Geogenic Windblown Un-reacted Al-Si–O-Mg- Iron magnesium Al-Si–O O 67.32; Al 9.97; Irregular aggregates Geng et al. 2014;
particles dust of local mineral dust. Fe aluminosilicates -Mg-Fe only Si 13.35; Mg Mico et al. 2015;
(52.05%) origin Fe-Mixture. (1.12%) 5.40; Fe 3.96 Boev et al. 2013;
Air Quality, Atmosphere & Health
(29.93%) Jung et al. 2012;
Campos et al. 2009;
Fišák et al. 2012;
Cvetković et al.
2012;
Huang et al. 2018
Al-Si–O-Fe– Iron-magnesium (Fe + Mg)/ Al 9.38; Si 16.08; FeMgNa + bright
Mg mixture aluminosilicates (Na + Cl + Ca + K + Fe + Mg) O 60.58; Fe irregular
(one, more mixture: most highest ratio 5.73; Mg 2.23;
or all: Na; K; likely montmoril- Na 1.76; K
Cl; Ca) lonite Mg-vermic- 0.93; Cl 0.91;
(6.18%) ulite Ca 0.77; C 1.63
Al 6.88; Si 16.68; FeMgCa + sharped
O 62.23; Fe and bright
6.15; Mg 3.56;
K 0.29; Cl 0.26;
Ca 2.05; C1.88
Al 9.48; Si 15.44; FeMgK + smooth
O 62.69; Fe and rounded
5.07; Mg 3.05;
Na 0.49; K
1.42; Cl 0.38;
Ca 2.05; C1.99
Al 8.83; Si 11.68; FeMgCl longed and
O 71.13; Fe irregular
4.87; Mg 2.48;
Cl 1.01
Al-Si–O Undefined (Fe + Na)/ Al 7.60; Si 15.01; Irregular and bright
Fe-Na mixture (Na + Cl + Ca + K + Fe + Mg) O 64.33; Fe
(one more or highest ratio without 3.03; Na 3.26;
all: K-Mg- Cl K 0.46; Ca
Ca) without 0.41; Mg 1.90;
Cl C 3.20
(2.81%)
13Table 2 (continued)
Category Source Particle Sub groups Possible minerals Selection criteriaa Elemental com- Morphology of References
groups (relative abun- position of each particles
13
(relative abun- dance) sub-type (%wt)b
dance)
Al-Si–O (Fe + Na)/ Al 9.14; Si 15.01; Rounded to sharped
Fe-Na mixture (Na + Cl + Ca + K + Fe + Mg) O 60.59; Fe as NaCl %wt.
g
(one, more highest ratio 5.47; Na 2.90; increases in the
or all: K-Cl- K 0.64; Cl 1.12; mix
Ca-Mg) Ca 0.45; Mg
(9.55%) 1.40; C 3.20
Al-Si–O (Fe + Na)/ Al 9.21; Si 16.89; Mostly irregular
Fe-Na mixture (Na + Cl + Ca + K + Fe + Mg) O 59.53; Fe agglomerates
(one more or highest ratio 3.84; Na 4.28;
all: K-Cl-Ca) without Mg K 0.63; Cl 1.47;
without Mgh Ca 0.71; C 2.64
(6.18%)
Natural. Aluminosili- Al-Si–O-Fe Almandine Al-Si–O + Fe (only) Al 10.63; Si Polygonal shapes (Wawros et al. 2003;
mineral par- cates (10.67%) Fe/Fe + K + Na 18.47; O 63.54; Xie et al. 2005;
ticles. soils [Al-Si–O] highest ratio Fe 5.16; K 0.31; Cong et al. 2009;
as major ele- Fe/Al-Si–O Ca 0.20; C 1.70 Sielicki et al. 2011;
ments highest ratio Jung et al. 2012;
(14.36%) Cvetković et al.
2012;
Pachauri et al. 2013;
Boev et al. 2013;
Pipal et al. 2014;
Mico et al. 2015;
Margiotta et al.
2015;
Zeb et al. 2018;
Eriksen Hammer
et al. 2018)
Al-Si–O-K- Biotite Al-Si–O + K + Mg + Fe (only) Al 9.19; Si 17.06; Triangular shapes
Mg-Fe O 60.46; K
(2.25%) 2.66; Mg 2.25;
Fe 4.11; C 4.27
Al-Si–O-K K-Feldspar Al-Si–O + K (only)d Al 11.82; Si Trapezium shapes
(1.12%) K/Fe + K + Na 18.46; O 59.59;
highest ratio K 3.42; Fe 2.03;
K/Al-Si–O Cl 0.64; C 2.83;
highest ratio Na 1.22
Air Quality, Atmosphere & HealthTable 2 (continued)
Category Source Particle Sub groups Possible minerals Selection criteriaa Elemental com- Morphology of References
groups (relative abun- position of each particles
(relative abun- dance) sub-type (%wt)b
dance)
Al-Si–O-Na Na-Feldspar Al-Si–O + Na (only)d Al 8.96; Si 16.07; Irregular shapes
(1.69%) Na/(Na + Fe + K) highest ratio O 65.55; Na
Na/Al-Si–O 5.57; Ca 0.24;
highest ratio Fe 2.29; C 1.21;
Air Quality, Atmosphere & Health
K 0.21
Al-Si–O Kaolinite Al-Si–O Al 11.94; Si Irregular shapes
(0.56%) (only) 11.09; O 76.97
Soils and Si-Rich [Si–O] Quartz d Si–O ~ 50%wt Si 34.78; O Tubular and bright (Xie et al. 2005;
construction (5.90%) (2.81%) 47.33; C 17.38 Cong et al. 2009;
activities Al 0.51 Boev et al. 2013;
Pachauri et al. 2013;
Geng et al. 2014;
Margiotta et al.
2015)
[Si–O] + oth- Quartz Si–O ~ 50%wt Si 30.30 O 57.79; Irregular bright
ers + traces C 4.78; Na 0.65; aggregates
(3.93%) Cl 0.35; K 0.52;
Ca 0.23; Fe
1.46
Soil related Ti-containing Different Aluminosilicates (Fe + Mg)/(Na + Cl + Ca + K + Al 12.05; Si Irregular and bright (Wawros et al. 2003;
(4.49%) mixes with Fe + Mg + Ti) highest ratio 18.03; O 53.90; Gao et al. 2007;
Ti Fe 6.64; Mg Campos et al. 2009;
(4.49%) 1.52; Na 1.72; Boev et al. 2013;
K 1.27; Cl 0.62; Pachauri et al. 2013;
Ti 1.10 Geng et al. 2014;
Mico et al. 2015;
Margiotta et al.
2015; Eriksen
Hammer et al.
2018;
Zeb et al. 2018)
Biological Carbonous mixture C %wt dominant C 49.27; O 39.01; Undefined (Cong et al. 2009;
Ti 1.87; Fe Pachauri et al. 2013;
1.87; Mg 1.02; Zeb et al. 2018)
Al 1.38; Si
2.82; Ca 2.19
13Table 2 (continued)
Category Source Particle Sub groups Possible minerals Selection criteriaa Elemental com- Morphology of References
groups (relative abun- position of each particles
13
(relative abun- dance) sub-type (%wt)b
dance)
Dust or Ti–rich C %wt dominant C 34.42; O 44.57; Smooth and bright (Cong et al. 2009;
metallurgic Peaks of Ti in X-ray spectrum Ti 12.72; Fe Geng et al. 2014;
activities 1.87; Mg 0.97; Zeb et al. 2018;
Al 0.67; Si Eriksen Hammer
3.05; Cl 0.20; et al. 2018)
Fe 1.51
Soils Ca-rich CaCO3 Calcite Ca-C-O as mayor elements Ca 17.76; C Irregular, bright with (Hoornaert et al.
(2.25%) (1.69%) Peaks of Ca in X-ray spectrum 27.68; O 48.81; defined edges 1996; Pachauri
Al 1.48; Si 1.78; et al. 2013;
Mg 1.49; Na Pipal et al. 2014;
0.49; Cl 0.20; Mishra et al. 2015;
Fe 0.32; Cu Mico et al. 2015;
0.24 Xie et al. 2005;
Margiotta et al.
2015;
Zeb et al. 2018)
CaMg(CO3)2 Dolomite Ca-Mg-C-O as mayor elements Ca 12.61; Mg Smooth, bight pen-
(0.56%) Peak of Ca-Mg in X-ray 12.47; C 11.3; tagon
spectrum O 61.56; Fe
1.48; Si 0.59
Marine aero- Cl-rich Cl-O Sea Spray or Peak of Cl in X-ray spectrumd Cl 11.42; O Well defined, (Gao et al. 2007)
sols (0.56%) (0.56%) Marine aerosol High Cl %wt 64.35; sharped brighten
Si 4.37; Al 1.37; particle
C 18.49
Mineral Mg-rich MgCO3 Magnesium carbon- strong C, O, Mg signals in Mg 30.19; C Rounded, smooth, (Cong et al. 2009;
(0.56%) (0.56%) ate X-ray spectrum 18.39; O 45.20; and bright Gao et al. 2007)
Na 2.73; Al 0.97;
Si 0.84; Cl 0.30;
K 0.52; Ca
0.34; Fe 0.53
C-rich Natural and Biogenic C-O plus Biogenic aero- C + O ~ 90%wt, pluses traces C 53.94; O 34.69; Big and long (Xie et al. 2005;
particle mineral. (16.29%) traces sols—type 1 Na-Al-Cl-K-Ca Na 4.75; Mg Cong et al. 2009;
(31.45%) biological (3.93%) Peculiar morphology 0.31; Al 1.31; Pachauri et al. 2013;
particles Si 0.06; Cl 2.04; Boev et al. 2013;
K 1.08; Ca Zeb et al. 2018)
1.31; S 0.06
C + O; Al and/ Biogenic aero- C + O ~ 90% wt plus, Al and/ C 55.67; O 37.40; Irregular
or Si sols—type 2 or Sid Al 2.42; Si If Si present, then
(6.18%) 3.18; Na 1.19; bright
K 0.08
Air Quality, Atmosphere & HealthTable 2 (continued)
Category Source Particle Sub groups Possible minerals Selection criteriaa Elemental com- Morphology of References
groups (relative abun- position of each particles
(relative abun- dance) sub-type (%wt)b
dance)
C + O; Al-Si Biogenic aero- [C + O ~ 90%wt Al-Si] as C 55.30; O 36.83; Variable morphol-
mixture sols—type 3 major elementes Al 1.63; Si 2.09; ogy. Mostly big
(5.06%) Na 1.30; Mg with aggregates
0.34; Cl 0.86; K
Air Quality, Atmosphere & Health
0.47; Ca 0.40;
Fe 0.79
C+O Biological-natural Peculiar morphology C 52.21; O 47.79 Undefined
(1.12%)
Carbonous CTable 2 (continued)
Category Source Particle Sub groups Possible minerals Selection criteriaa Elemental com- Morphology of References
groups (relative abun- position of each particles
13
(relative abun- dance) sub-type (%wt)b
dance)
Sea spray Reacted (or ClNaS-con- Aged sea salt with Na and/or Cl with S Cl 4.03; Na 3.31; Egg-shaped (Gao et al. 2007;
aerosols aged) taining mineral dust Cl/(Na + Cl + Ca + Mg + Fe) S 0.56; O 55.43; Vester et al. 2007;
reacted with sea spray (0.56%) Highest ratio C 11.75; Al Geng et al. 2014;
mineral aerosols NaCl/Al-Si–O-S 21.40; Si 2.27; Mico et al. 2015;
dust (2.24%) highest ratio Ca 0.33; Fe Li et al. 2016)
0.92
NaClS-Con- Na and/or Cl with S Cl 2.50; Na 7.31; Cloud-like
taining Na/(Na + Cl + Ca + Mg + Fe) S 0.88; O 59.07;
(1.12%) Highest ratio C 5.98; Al 7.08;
NaCl/Al-Si–O-S highest ratio Si 12.90; Ca
0.91; Fe 3.36
Na-rich-S Na with S Na 5.48; S 2.34; Irregular shaped
(0.56%) Na/(Na + Cl + Ca + Mg + Fe) O 60.64; C
highest ratio 10.87; Al 3.67;
Na/Al-Si–O-S Si 14.80; K
highest ratio 0.56; Ca 1.02;
Fe 1.35
Metallic Road dust Metals [Fe or Fe–O-Al-Si Iron oxide on sili- Fe–O as abundant elements Fe 25.64; O Irregular shaped (Campos-Ramos
particles and/or Cu or Nb or (0.56%) cate mineral peak of Fe in X-ray spectrum 54.63; Al 6.86; et al. 2010; Wein-
(2.80%) vehicle Cb]-contain- Si 9.15; C 3.72 bruch et al. 2010;
activities ing Sielicki et al.
(2.80%) 2011;
Pachauri et al. 2013;
Boev et al. 2013;
Geng et al. 2014;
Mico et al. 2015)
Co–O Cobalt oxide Co-containing Co 40.50; O Irregular shaped (Pandey et al. 2012;
(0.56%) 41.75; C 14.78; Pachauri et al. 2013;
Al 1.26; Ca Geng et al. 2014;
1.75 Das et al. 2015;
Elhadi et al. 2017;
Sah et al. 2019)
Cu-containinge Un-defined Al-Si-Cu not S Al 18.86; Si 6.47; Undefined
(0.56%) Cu 7.07; C
19.59; O 41.30;
Ca 3.61; K 3.11
Air Quality, Atmosphere & HealthTable 2 (continued)
Category Source Particle Sub groups Possible minerals Selection criteriaa Elemental com- Morphology of References
groups (relative abun- position of each particles
(relative abun- dance) sub-type (%wt)b
dance)
Metallurgic Al-Si–O-Nb Nb-aluminosilicate Nb-containing Al 6.62; Si 17.82; Triangular shaped (Pachauri et al.
activities (1.12%) O 58.96; Nb 2013)
3.17; C 4.20; Na
1.85; Mg 2.17;
Air Quality, Atmosphere & Health
K 0.15; Fe 4.19
a
All: meaning all other elements, excluding Al-Si–O-C.
b
Some samples had traces of C remaining after correction procedure.
d
Relatively clean X-ray spectrum.
e
Not able to characterize morphology from SEM image.
f
Samples containing F and Al have been compromise at handling or storage, probably.
g
Cl both from sea spray aerosol and/or burning waste.
h
Cl from sea spray aerosols.
13Air Quality, Atmosphere & Health
acted mineral dust subgroups, indicating NaCl particles’ was considered natural. The morphology of these par-
presence in the sampling site. In this subgroup, irregular ticles is sharpened with angular fragments, which indi-
aggregates are the predominant morphology. Figure 4a cates that it could be quartz of natural origin (Fig. 4c).
is an example of unreacted mineral dust (Fe-mixture Although atmospheric quartz dust can be in all particle
without Cl). size ranges (Eriksen Hammer et al. 2018), the Si-rich
1.2) Aluminosilicate group (relative abundance 14.36%) particles found in our study were in the coarse fraction.
Aluminosilicate particles have Al-Si–O as major ele- 1.4) Ti-containing group (relative abundance 4.49%)
ments (%wt) with varying amounts of K-Mg-Fe-Na. Ti was present in minor amounts in most particles.
Different kinds of aluminosilicates are proposed as sub- Based on EDX’s particle X-ray spectra, all particles con-
groups like almandine, biotite, Na-feldspar, K-feldspar, taining Ti were separated to be studied further. Three
and kaolinite, belonging to clay minerals. The most subgroups were identified (Table 2).
common source of these particles is the crustal origin. Particles abundant in Ti element (Ti > 10%wt) with
However, dust is the dominant source of aluminosili- Ti peaks in the X-ray spectrum are classified as Ti–rich.
cates due to eolian dispersion of soil particles or from This particle’s elemental composition shows high con-
resuspension of road dust caused by vehicles. tents of C and O plus traces of soil-related elements.
The size of aluminosilicate particles varied but is Ti oxide particles ( TiO2) have a natural and anthropo-
mainly Dp > 2.5 µm. Particle shapes in this group are genic origin, e.g. resuspended unreacted mineral, dust,
polygonal (almandine), triangular (biotite), trapezium and metallurgical activities. In our study, according to
(K-feldspar), and irregular shapes (Na-feldspar and its irregular morphology and size (coarse fraction), the
kaolinite) (Table 2). Figure 4b presents an example of Ti–rich particles come from crustal materials (Fig. 4d).
aluminosilicates (biotite). During the sampling period, metallurgical activities
Al-Si–O particles have two origins: natural (irregu- occurred around the sampling station: this activity type
larly shaped) and anthropogenic (fly ash with spherical cannot be discarded as Ti sources. However, the metal
shapes). From the morphologies found in the alumino- oxide particles emitted from the metallurgic industry
silicates of this study, we can suggest that they are soil usually present spherical shapes (Cong et al. 2009;
derived (Wawros et al. 2003; Xie et al. 2005; Cong et al. Geng et al. 2014; Zeb et al. 2018; Eriksen Hammer et al.
2009; Sielicki et al. 2011; Jung et al. 2012; Cvetković 2018).
et al. 2012; Pachauri et al. 2013; Boev et al. 2013; Pipal Ti signals can also be observed in soil-derived alumi-
et al. 2014; Mico et al. 2015; Margiotta et al. 2015; Zeb nosilicate particles as they can have varying amounts of
et al. 2018; Eriksen Hammer et al. 2018). Ti in the mixture (Wawros et al. 2003; Gao et al. 2007;
1.3) Si-rich group (relative abundance 5.90%) Campos et al. 2009; Boev et al. 2013; Pachauri et al.
Particles containing predominantly silicon are clas- 2013; Geng et al. 2014; Mico et al. 2015; Margiotta et al.
sified as quartz ( SiO2). These are identified by having 2015; Eriksen Hammer et al. 2018; Zeb et al. 2018). The
pronounced peaks of Si in the X-ray spectrum, high %wt particles in this subgroup had Mg and Fe and other soil-
of Si and O, with a proportion of ~ 50%wt between these related elements that could indicate that they are a Fe-
two elements (1Si:2O). This group is separated into two mixture, probably montmorillonite or Mg-vermiculite.
subgroups: particles with relatively clean X-ray spec- The morphology of these particles was coarse, irregular,
tra (Si and O with tubular and bright form) and parti- and bright, suggesting that they are soil-related aerosols.
cles with traces of other elements (irregular and bright The last subgroup is represented by C-rich particles
agglomerates) (Table 2). Si-rich particles with traces of containing traces of Ti with sizes larger than 5 μm. They
other elements could indicate that they come from long- appeared irregular and bright. Carbon-rich particles are
range transport processes or remained in the atmosphere usually described either as carbonous mixtures or bio-
long enough to mix with those elements. In this type of logical particles (Cong et al. 2009; Pachauri et al. 2013;
particle, Fe has the highest %wt (after Si and O). The Zeb et al. 2018). According to its morphology, one of
origin of Fe is associated with soil dust. Si-rich particles these particles appears to be a carbonous mixture, and
may have a natural origin (resuspension of soil dust and the others are biogenic aerosols mixed with Ti-contain-
earth’s crust) and anthropogenic (coal burning and con- ing aerosols like T iO2. C-rich particles are described in
struction activities), although their source is primarily more detail later in this paper.
associated with soil (Xie et al. 2005; Cong et al. 2009; 1.5) Ca-rich group (relative abundance 2.25%)
Boev et al. 2013; Geng et al. 2014; Pachauri et al. 2013; Particles composed of high content of Ca (> 10%
Margiotta et al. 2015;). relative contribution by weight) and high relative
Construction activities were not found near the sam- X-ray intensities for Ca are classified as Ca-rich. In
pling station during sampling, so these particles’ origin this group, there are two subgroups: calcite (CaCO3)
13Air Quality, Atmosphere & Health
and dolomite ( MgCO3.CaCO3), typical constituents of et al. (2015), fresh sea salt is presented in the form of
soils, often observed in aerosol/particle analysis. These crystals. Gao et al. (2007) demonstrated that a sea salt
particles were found in relatively low abundance (see (NaCl) particle with a similar shape that the one found
Table 2). Sources for Ca-rich particles (calcite and/or in this study was associated with SSA. Reviews have
dolomite) could be natural and anthropogenic like resus- mentioned that SSA can travel long trajectories becom-
pended dust, crustal material from paved and unpaved ing long-range atmospheric particles, and they can be
roads or windblown dust, and construction activities mixed or react with the components of the atmosphere
(i.e. building, construction, demolition, and cement) where they pass by (Mico et al. 2015; Weinbruch et al.
(Hoornaert et al. 1996; Pachauri et al. 2013; Pipal et al. 2010; Pipal et al. 2014; Geng et al. 2014).
2014; Mishra et al. 2015; Mico et al. 2015; Xie et al. Another source for Cl-rich particles is garbage burn-
2005; Margiotta et al. 2015; Zeb et al. 2018). Airborne ing, which contributes to high concentrations of HCl,
CaCO3 can be of marine origin as well (Hoornaert et al. mainly caused by the burning of polyvinyl chloride
1996). Morphology of calcite and dolomite has been (PVC) or paper or high contents of food wastes in the
described as irregular fragments with distinct rough garbage (Jiang et al. 2007; Moffet et al. 2008; Li et al.
surfaces (Pachauri et al. 2013), pentagon-shaped (Zeb 2012). Particles from garbage burning are usually in the
et al. 2018), irregular shape (Cong et al. 2009; Cam- fine fraction (Dp hundred nm), and they are rounded
pos-Ramos et al. 2010; Mico et al. 2015), irregular and (Zeuthen et al. 2007). Open garbage burning is a com-
bright (Geng et al. 2014), and irregular bright aggregates mon practice to dispose of solid waste in the poor com-
(Mishra et al. 2015). Sizes of carbonate particles could munities near the sampling station; therefore, it cannot
range from 0.5 to 20 μm (Wawros et al. 2003; Cong et al. be discarded as a possible source of Cl particles.
2009), meaning they are mainly in the coarse fraction Based on its physical–chemical and morphological
(Mishra et al. 2015). According to the shape and fraction information, Cl-rich aerosols in this study are classi-
size, our Ca-rich particles are assumed to be soil-related fied mainly as sea spray aerosols mixed with dust. Sea
calcium carbonates (Fig. 4e). salt could be related to long trajectories of transported
1.6) Cl-rich group (relative abundance 0.56%) aerosols within air masses from the Caribbean Sea. Fur-
A big, well-defined, sharped, bright, Cl-rich crystal thermore, Cl with more than 1%wt was present in ~ 22%
particle with a diameter bigger than 10 μm was found of all particles analysed (without considering biogenic
in this study (Table 2 and Fig. 4f). It is characterised by particles, as Cl is a tracer present in plants).
the high relative X-ray intensity of Cl. It has O and C 1.7) Mg-rich group (relative abundance 0.56%)
as major elements. Traces of Si and Al are present and
could be because the hygroscopic behaviour of NaCl can Aerosols containing a high %wt of Mg (> 20%wt) and
encourage aggregation with silicate particles (Margiotta pikes of Mg in the X-ray spectrum are described as Mg-
et al. 2015). rich (Table 2). These particles were magnesium carbonate
Cl aerosols can originate from industrial smokes, bio- (MgCO3: Mg, C, O as major elements). Other studies of
mass burning, or sea salts (Wang et al. 2017). Zeb et al. characterisation of atmospheric aerosols have found Mg-rich
(2018) found Cl-rich aerosols with tablet-like morphol- particles but have not described them (Sielicki et al. 2011;
ogy and sizes > 5 μm; they mention that natural parti- Geng et al. 2014; Eriksen Hammer et al. 2018). For Cong
cles tend to be big, like sea salts or sea spray aerosols et al. (2009), MgCO3 ranged up to 10 μm (coarse particles)
(SSA). Campos-Ramos et al. (2010) described the group and were assumed to be soil-related. For Geng et al. (2014),
of Cl-Na particles as well-defined crystals, with sizes MgCO3 appeared irregular and bright, with strong C, O, and
between 5 and 10 μm, which are related to SSA. Geng Mg signals in its X-ray spectrum. For this study, Mg-rich
et al. (2014) identified fresh SSA by the presence of Na particles were in the coarse fraction and are related to soil
and Cl peaks and often with minor C, O, Mg, and Ca dust resuspended by wind or vehicles. Their morphology
signals. Pipal et al. (2014) observed Cl-Na-rich aerosols was smooth edges and bright (Fig. 4g). The roundness of this
in coarse particles coming from sea spray. Ochsenkühn- spray could be due to erosion by wind transport.
Petropoulou et al. (2009) show sodium chloride crystals
as high brightness cubes in the coarse fraction originated 2) C-rich particles’ category (relative abundance 31.45%)
from sea spray. Weinbruch et al. (2010) studied parti-
cle’s characterisation on moss surfaces and interpreted C-rich particles were classified using clustering rules
Cl aerosols as marine. For Sielicki et al. (2011), Cl-rich proposed by Matthias-Maser and Jaenicke (1991, 1994)
particles are aerosols of sea salt brought with the wind to and Coz et al. (2010). This category was classified into two
where samples were collected. Salt particles showed the groups: carbonous and biogenic aerosols (see Table 2). The
typical cubic habit of regular square prisms. For Mico
13Air Quality, Atmosphere & Health
Fig. 4 SEM photomicrographs representing the different groups biological; (i) C-rich: non-biological; (j) reacted (or mixed) ferrous
of particles analysed. Note: (a) Unreacted mineral dust (Fe-mixture aluminosilicates; (k) reacted (or aged) sea spray aerosols; (l) metals
without Cl); (b) aluminosilicates (biotite); (c) Si-rich (quartz); (d) Ti- (Cu-containing). SEM photomicrographs representing the different
containing (Ti-rich); (e) Ca-rich; (f) Cl-rich; (g) Mg-rich; (h) C-rich: groups of particles analysed
subgroups are defined based on morphology and elemental composition and/or characteristic morphology into four
composition. subgroups (see Table 1). This category has sizes larger
than 10 μm and highly variable morphologies (Cong
2.1) Biogenic aerosols’ group (relative abundance et al. 2009; Pachauri et al. 2013; Zeb et al. 2018). The
16.29%) biological particles include microorganisms and organic
These other carbonaceous particles are dominated by fragments of all varieties of living matter, like viruses,
biological aerosols classified based on their chemical bacteria, fungal spores, pollen, plant debris, animal mat-
13Air Quality, Atmosphere & Health
ter, protozoa, fungi, and/or fragments of leaves) (Xie A subgroup was created to recognise the possible
et al. 2005; Cong et al. 2009; Pachauri et al. 2013; Boev presence of sulfur in the aerosols. This subgroup has a
et al. 2013; Zeb et al. 2018). higher carbon than oxygen ratio (%w) and the possible
Among the subgroups are the biogenic aerosols’ types presence of sulfur and traces of other elements. Authors
1, 2, and 3, containing minor amounts of Na, Mg, K, P, like Zeb et al. (2018) found a group of carbonaceous
Si, Fe, Cl, Al, and C, which are essential tracers present particles with S and traces of soil-related elements. Its
in plants. The subgroup of biogenic aerosols’ type 1 is morphology and elementary composition were similar
highly structured and has symmetrical shapes and sizes to those of our study. Pachauri et al. (2013) indicate that
(mainly coarse particles from 2 to 25 µm) and is classi- these particles’sources are fuel, biomass, agricultural
fied as a junk of plants. Biogenic aerosols’ types 2 and 3 burning, and waste incineration. Carbonaceous parti-
account for the other two subgroups. They have C and O cles’ morphology is influenced by the type of power,
as major amounts mixed with Al, Si, Na, Mg, K, Ca, and burning conditions, and atmospheric processes. The S
Cl; these are particles of biological nature, differentiated present in the particles is possible because S O2 can be
by their morphology. The last subgroup is biological- adsorbed over mineral particle surfaces (Zeb et al. 2018)
natural, in which the origins are various forms of plants or by adsorption and secondary phases from S O4 present
(leaf, flowers, branches) with C and O as only elements. in the environment (Boev et al. 2013). SO2 comes from
Figure 4h shows an example of a biological C-rich par- the burning of fossil fuel. The identification of S may be
ticle found in this study. due to signal interference of Au; this is further discussed
2.2) Carbonous group (relative abundance 15.16%). later in the paper.
2.2.1) High carbon aluminosilicates’ subgroup (relative The above subgroups can be described as carbonous
abundance 7.30%). mixtures with dust-soot aggregates, including alumi-
These are particles with C-O–Al-Si as major elements nosilicates, quartz, or Fe-mixtures that are externally
and a lower carbon and oxygen relation (%wt). These mixed with carbon (Quinn et al. 2004; Gao et al. 2007;
aerosols also present traces of Na, Mg, Cl, K, Ca, and Cvetković et al. 2012).
Fe. Zeb et al. (2018), Pachauri et al. (2013), and Wein- 2.2.3) High carbon and mineral subgroup (relative abun-
bruch et al. (2010) found similar particles, i.e. a mixture dance 3.93%)
of carbonaceous and inorganic elements with varying
amounts of soil-related components like Si, Na, Mg, This subgroup has high carbon (C > 50%wt), where the
K, Cl, Ca, and Al (as shown by their X-ray spectrum), sum of C and O is > 90%wt plus traces of mineral elements.
forming complex aggregates with sizes from a few nm The aerosols of this group were differentiated according to
to several μm and variable morphologies. the mineral elements’ content: C–Cl, C-Cr, C-K, C-AlCl,
2.2.2) Carbonaceous mixture with S subgroup (relative C-NaClCaK, each of which had a particular morphology.
abundance 3.93%). These particles are interpreted as inorganic carbon coming
from various sources (Fig. 4i).
Table 3 Factors of the main Element PC1 PC2 PC3 PC4 PC5 PC6
components of the composition
of particulate material rotated C − 0.93 0.01 0.05 0.15 − 0.16 0.05
by the Varimax method
O 0.82 − 0.08 − 0.07 − 0.29 0.23 − 0.18
Na 0.08 0.91 0.03 − 0.01 0.04 0.04
Mg 0.17 0.10 0.00 0.12 0.91 0.15
Al 0.86 0.06 − 0.05 0.10 − 0.04 0.03
Si 0.76 − 0.10 − 0.10 0.22 − 0.11 0.04
Cl − 0.13 0.81 0.16 0.22 0.07 − 0.10
K 0.10 0.16 0.06 0.92 0.12 0.02
Ti 0.00 − 0.04 − 0.03 0.02 0.13 0.96
Ca − 0.16 0.16 0.77 0.12 0.25 − 0.17
Fe 0.74 0.05 0.12 0.27 0.19 0.20
S 0.03 0.04 0.87 − 0.02 − 0.18 0.10
Variability (%) 29.20 13.07 11.77 9.67 9.07 8.88
Accummulated (%) 29.20 42.27 54.04 63.71 72.78 81.66
Bold indicates highest loading for each element
13You can also read