CARROLL FUND PERIOD 2 PERFORMANCE REPORT - Alyssa Thomas Brennon Gessner Eldon Lu Gabrielle Cyr Grant Kizer Jeremy Meanwell
←
→
Page content transcription
If your browser does not render page correctly, please read the page content below

CARROLL FUND PERIOD 2
 PERFORMANCE REPORT
  HASLAM COLLEGE OF BUSINESS

                    Alyssa Thomas
                   Brennon Gessner
                       Eldon Lu
                     Gabrielle Cyr
                      Grant Kizer
                   Jeremy Meanwell
TABLE OF CONTENTS
    Letter to the Carroll’s……..………………...…………………………………….……….. 3
    Economic Outlook………………………………………………………………………….. 4
    Performance Summary…………………………………………………………………….. 5
    Best & Worst Performers..…………...…...………………...………..………………….….. 5
    Period 2 Risk Metrics……………………………………………………………………….. 6
    Fund Returns……….……………………………………………………………….………..7
    Allocation of Funds………….…….……………………….…………………………...…….8
    Portfolio Breakdown………..…………………………...…………………………………..9

Communication Services………….….….…10-11            Industrials…………………………...………30-34
 Fidelity MSCI Communication Services ETF   11    Caterpillar, Inc.                                    31
Consumer Discretionary………….……..…12-14             FedEx Corporation                                    32
 Amazon, Inc.                               13    Jacobs Engineering Group, Inc.                       33
 Nike, Inc.                                 14    Lockheed Martin Corporation                          34
Consumer Staples……...………….……..…15-17             Information Technology.………….……..…35-40
 PepsiCo, Inc.                              16    Apple, Inc.                                          36
 Walmart, Inc.                              17    Amplify Transformational Data Sharing ETF            37
Energy…………...……...………….…..……18-19                 First Trust Nasdaq Cybersecurity ETF                 38
 ConocoPhillips                             19    Microsoft Corporation                                39
                                                  Taiwan Semiconductor Manufacturing Company           40
Financials………..……...………….……..…20-24
 J.P. Morgan Chase & Co.                    21
                                                 Materials……..……...………….…………...41-42
 PayPal Holdings, Inc.                      22     PotlatchDeltic                                      42
 S&P Global, Inc.                           23   Real Estate…………...……...…..….…….…43-44
 Visa, Inc.                                 24    Welltower, Inc.                                      44
Healthcare……………...…….…….…..……25-29               Utilities………..……...…….……….….……45-46
 ARK Genomic Revolution ETF                 26     Utilities Select Sector SPDR ETF                    46
 CVS Health Corporation                     27   Fixed Income…………...…….…….….……47-52
 Merck & Co.                                28    IShares Core U.S. Aggregate Bond ETF                 48
 Organon & Co.                              29    Innovator S&P 500 Power Buffer ETF                   49
                                                  Principal Spectrum Preferred Securities Active ETF   50
                                                  Schwab U.S. TIPS ETF                                 51
                                                  WisdomTree Floating Rate Treasury ETF                52

   Fund Managers……………………………………………………………………………. 53-54
   Works Cited……………………………………………….……………………………… 55-64

                                                                                                  2
Dear Mr. Larry and Mrs. Vivian Carroll,

We would like to express our utmost appreciation for allowing us to serve as wealth managers on
the Carroll Fund at The University of Tennessee. As we conclude another productive period of
enlightenment and growth, we cannot thank you enough for your selfless gift that has allowed us
to be a part of this unforgettable learning experience. This experience has transformed our
analytical, teamwork, project management, and communication skills significantly, further
preparing us for the professional world. Our duties include comprehensive economic discussions,
constant monitoring of the fund’s investments, thorough security analysis, and maintaining a
positive team dynamic that supports a strong work ethic. Through our duties we have developed
the mindset necessary to be able to fulfill future obligations. As our time on the Carroll Fund is
nearing the end, we are proud and excited to apply our skills and knowledge of financial markets
into our future endeavors.

During Period 2, January 1st to March 31st, the Carroll Fund returned -4.32%, outperforming the
S&P by 29 basis points. We also outperformed our primary and alternative benchmarks on a risk
adjusted basis as well. While a negative return was not our desired result, we believe it was
unavoidable as equities began Period 2 taking a rough hit due to Federal Reserve policy changes,
heightened inflation, and geopolitical events. Although, because of our weak performance, this
period has shown us how sensitive the markets are to economic conditions and tested our ability
to make critical decisions.

Furthermore, in Period 2, we decided to make a few changes to the portfolio that we felt was best
suited given the current market volatility. As we have taken a rather bearish stance on the state of
the economy, we thought it would be strategic to work towards rebalancing our portfolio while
also lowering our beta. Additionally, we wanted to increase our cash balance to facilitate
opportunities at lower prices. We realized profits on half of our ConocoPhillips (COP) position.
Additionally, we liquidated AMN Healthcare Services Inc. (AMN) and Blackrock (BLK) which
reduced the fund’s beta. We confidently believe these changes will improve the performance of
our fund.

Our gratitude for this opportunity to represent the Carroll Fund extends far beyond this letter;
without your generosity, none of this would have been possible. We have no doubt that we will
reflect on this experience one day and truly be able to say that our financial literacy began while
serving on the Carroll Fund.

Sincerely,

Alyssa Thomas, Brennon Gessner, Eldon Lu, Gabrielle Cyr, Grant Kizer, and Jeremy Meanwell

                                                                                                      3
ECONOMIC OUTLOOK
Summary
The economic environment has become more complex and uncertain over the course of Period 2.
As a result, the Carroll Fund managers have developed a more pessimistic view of markets in the
short-term. Period 2 was full of many different macroeconomic factors including the war
between Ukraine and Russia, record high inflation, the beginning of a rate hike cycle, and
increasingly tight credit spreads that are indicating a yield curve inversion. All of these have
contributed to elevated market volatility and even fears of a recessionary cycle ahead.

Domestic Economy
After an extended period of economic relief since the beginning of the pandemic, the Federal
Reserve finally raised the Federal Funds rate by 25 basis points in March and has signaled for
several more over the course of the next couple of years. Consumer sentiment and economic
conditions were already deteriorating, so it will be a delicate slow down process at the very least.
However, rate hikes are very much needed to combat some of the highest inflation on record. It
is possible that the Federal Reserve could raise rates higher than markets expect, which would
put a strain on markets and add to the already high volatility. Considering this, bond markets
continued to sell off over the period exhibiting excessive yield increases that have not been seen
in recent years.

Global Economy
Over the course of Period 2, the global economy and its prospects were tested by the war in
Ukraine. With the economy already feeling the effects of the pandemic, the war added flames to
the fire, sending the price of oil and commodities soaring in an already sticky supply chain. As a
result of the Russian invasion, the West applied many sanctions to Russia that have many
macroeconomic implications, raising questions about energy independence and even foreign
reliance on the U.S. dollar. Worth noting is China’s response to rising cases in certain regions
that may put further delays on supply chains.

Outlook
Carroll Fund managers will continue to monitor the Federal Reserve’s signals regarding rates.
While it is not likely that inflation will return to pre-pandemic levels any time soon, rate hikes
will be necessary to cool off the overheated economy. This would imply slower growth than in
recent years but would give the Federal Reserve room to provide stimulus in the event of
recession. Carroll managers will be maintaining a slightly pessimistic view until the current
domestic and global economic uncertainties are resolved.

                                                                                                     4
PERFORMANCE SUMMARY
Our Mission
To manage the funds provided to us by our benefactor in a way that displays fiduciary
responsibility and intellectual curiosity with the goal of outperforming our benchmark.

                                                 Our Goals
                           Objectives                               Period 1
              1. Achieve Positive Return
              2. Outperform Benchmark
              3. Outperform Competing Funds
              on Relative Basis
              4. Outperform Competing Funds
              on Absolute Basis

                                                                                 Spread
                               Carroll Fund        Benchmark     S&P 500                      Spread from
          Period                                                                  from
                                 Return              Return       Return                       S&P 500
                                                                               Benchmark
         Period 2                 -4.32%            -5.14%        -4.61%         0.82%           0.29%

   ➢   Period 2 (P2) date range is 01/01/2022 - 03/31/2022.
   ➢   Our benchmark is a weighted average of the S&P 500 Index and Bloomberg Barclays U.S. Aggregate Total
       Return Value Unhedged Index, weighted 60% and 40%, respectively.

                    BEST AND WORST PERFORMERS
                                 P2 Best & Worst Performers
                                Holding $ Return % Return
                               COP           $    3,968.44        40.43%
                               LMT           $    3,285.23        24.98%
                               WELL          $    2,448.54        12.80%
                               OGN           $    2,332.40        15.63%
                               MRK           $    1,714.10         7.96%
                               PYPL          $ (5,834.40)        -38.67%
                               FCOM          $ (4,681.07)        -11.32%
                               TSM           $ (3,632.51)        -13.01%
                               SPGI          $ (3,292.92)        -12.92%
                               MSFT          $ (2,711.61)          -8.14%

                                                                                                          5
PERIOD 2 RISK METRICS

                                            P2 Risk Metrics
Beta vs. Benchmark                   1.16        Standard Deviation                                    0.16
R2 of Beta                           0.94           Tracking Error                                    4.44%
Beta vs. S&P 500                     0.71         Information Ratio                                    0.73
R2 of Beta                           0.95

      Metric                  Portfolio                Benchmark                       S&P 500      BETFX
   Sharpe Ratio                -1.08                     -1.55                          -0.79        -1.38
   Treynor Ratio               -0.15                     -0.20                          -0.17        -0.19

             ➢   All metrics reported are annualized and use daily returns for their calculation.
             ➢   BETFX is the Morningstar Balanced ETF Asset Allocation Portfolio.

                                                                                                        6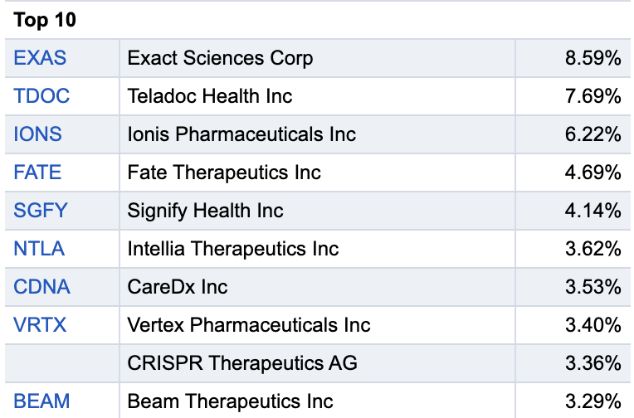
CARROLL FUND RETURNS

                                      Period 2 Carroll Fund Return
$780,000.00

$760,000.00

$740,000.00

$720,000.00

$700,000.00

$680,000.00

$660,000.00

$640,000.00
              1/3/22 1/10/22 1/17/22 1/24/22 1/31/22 2/7/22 2/14/22 2/21/22 2/28/22 3/7/22 3/14/22 3/21/22 3/28/22

                                        Carroll        BETFX           Benchmark

                                TORCH FUND RETURNS

                                 Torch Fund P2 Returns
                              Carroll                                        -4.32%
                              Haslam                                          -2.94%
                              LaPorte                                         -5.06%
                             McClain                                          -5.59%

                                                                                                                     7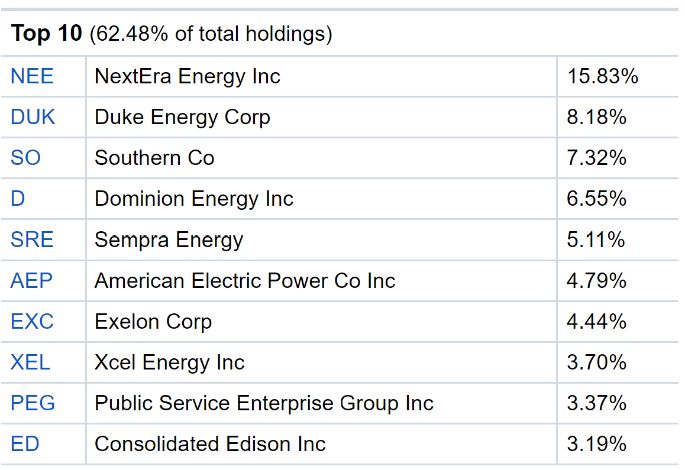
ALLOCATION OF FUNDS

                                         CARROLL FUND
                         Utilities, 2%
                                         Cash, 7%         Communication
                  Real Estate, 3%                                                   Consumer
                                                           Services, 5%
                                                                                Discretionary, 9%
          Materials, 2%                                                              Consumer Staples,
                                                                                             5%
  Information                                                                              Energy, 1%
Technology, 20%
                                                                                       Financials, 10%

  Industrials, 8%
                                                                                 Fixed Income, 26%

                     Healthcare, 9%

                                         BENCHMARK
                            Real Estate, 2%   Utilities, 2%     Communication
           Materials, 2%                                         Services, 5%     Consumer
        Information                                                           Discretionary, 7%
      Technology, 16%                                                                 Consumer Staples,
                                                                                              4%
                                                                                           Energy, 3%
Industrials, 5%                                                                          Financials, 7%

Healthcare, 8%

                                                                       Fixed Income, 40%

                                                                                                      8
PORTFOLIO BREAKDOWN

                        Value on
       Security                            % of Portfolio
                       03/31/2021
SPAXX             $           47,964.20              6.61%
                      Equity Holdings
AAPL              $           43,477.89              5.99%
AMZN              $           48,899.25              6.74%
ARKG              $             7,027.29             0.97%
BLOK              $             9,368.06             1.29%
CAT               $           14,037.66              1.93%
CIBR              $           31,228.68              4.30%
COP               $             6,800.00             0.94%
CVS               $           16,396.02              2.26%
FCOM              $           36,611.40              5.04%
FDX               $           11,569.50              1.59%
J                 $           13,367.57              1.84%
JPM               $           12,132.48              1.67%
LMT               $           16,331.80              2.25%
MRK               $           23,056.05              3.18%
MSFT              $           30,522.69              4.20%
NKE               $             8,880.96             1.22%
OGN               $           17,115.70              2.36%
PCH               $           12,338.82              1.70%
PEP               $           21,257.26              2.93%
PYPL              $             9,252.00             1.27%
SPGI              $           22,149.72              3.05%
TSM               $           24,188.32              3.33%
V                 $           21,289.92              2.93%
WELL              $           21,439.22              2.95%
WMT               $           11,764.68              1.62%
XLU               $           14,370.78              1.98%
                  Fixed Income Holdings
AGG               $           38,984.40              5.37%
PNOV              $           24,967.00              3.44%
PREF              $           41,094.36              5.66%
SCHP              $           13,599.04              1.87%
USFR              $           54,503.52              7.51%

                                                             9
COMMUNICATION SERVICES
                                    Manager: Brennon Gessner

Sector Overview
The Communication Services sector has become increasingly important as the world has shifted
to a lifestyle that is more reliant on communication, connectivity, and high-speed mobile services
than ever before. The Communication Services sector makes communication possible on a
global scale. The sector is made up of telephone, satellite, and cable companies, along with
internet service providers. These companies are focused on connectivity, data services, audio,
and video.1 The sector contains a mix between growth and value stocks, with the growth stocks
typically being involved in new and innovative ways of communication and the value stocks
often larger service providers with a steady income.2 The sector was once defensive due to its
steady demand, but with the introduction of media companies it has shifted to be more cyclical,
therefore, it is expected to outperform during the mid-cycle and underperform during periods of
recession.3

Impacts from Period 2
During Period 2, the rollout of 5G technology by major service providers such as AT&T,
Verizon, T-Mobile, etc. This 5G technology will continue to be a tailwind for the sector, as it is
faster, has more capacity and network capability, and allows people to increase the number of
connected devices.4 Over the period, the Carroll Fund saw the impacts of Apple’s new ad-
blocking feature that increases user privacy, as Facebook reported disappointing earnings that
caused their stock price to tumble more than 20% after earnings due to weakening guidance
regarding advertising revenue. The current period of high inflation has led to these companies
increasing their prices. For example, Comcast raised their rates for their various TV and internet
services by anywhere from 10%-27% over the period to combat rising costs.5

Performance
                  5.00%
                  0.00%
                 -5.00%
                -10.00%
                -15.00%
                -20.00%
                -25.00%

                                  S&P 500        Communication Services

                                                                                                 10
FIDELITY MSCI COMMUNICATION SERVES ETF (FCOM)
Holding Description
FCOM is an ETF that targets the broad U.S. Communication Services sector, which includes
Telecommunications, Media, and Entertainment companies. To ensure diversification, no entity
exceeds 25% weight within the fund and the combined weight of issuers over 5% within the
portfolio is capped at 50% of the portfolio. The index is rebalanced quarterly to ensure this holds
true. This fund has an expense ratio of .084%. The holdings are weighted by market cap and
largest holdings within the ETF are depicted below. 1
2
Impacts from Period 2
In April 2021, Apple released an update for iPhones that gave users the opportunity to opt out of
targeted advertisements. This has impacted search engine and social media companies that rely
on advertising for large portions of their revenue.2 Facebook, the largest holding within FCOM,
reported earnings that disappointed due to weakened advertising revenue forecasts, causing share
price to drop by 20%. The Russia-Ukraine conflict also had an impact on some of FCOM’s
holdings. For example, Netflix shut down its services in Russia and could lose one to two million
subscribers because of this.3
Future Outlook
The fund’s outlook for FCOM is bullish. FCOM’s diverse coverage of the
Communication Services sector that continues to develop into a necessity in our technology
driven world make it a strong holding for our portfolio. Potential headwinds such as the long-
term effects of Apple’s privacy changes along with the impacts of Russia-Ukraine conflict will
be worth monitoring in future periods but are not cause for concern when evaluating the overall
outlook of the ETF.
New Transactions
There were no transactions made involving FCOM during Period 2.
Dividends
Period Beginning Value Ending Value % Return
Received
Period 2 $ 41,666.80 $ 36,611.40 -11.32% $ 52.33
11CONSUMER DISCRETIONARY
Manager: Eldon Lu
Sector Overview
The Consumer Discretionary sector includes industries that are not essential for consumer’s basic
needs. High-end goods, luxury items, apparel, and others all fall under the discretionary label.1
Because the sector depends mostly on consumers having the disposable income to afford these
products, the sector performs best in economic expansion. In times of recession, discretionary
goods are the first to be cut out of consumer’s budget when earnings slow, but when conditions
are favorable, some firms can be amongst the highest performers in the entire market.2 During
the period, the Carroll portfolio held Nike (NKE) and Amazon (AMZN) for discretionary
holdings.
Impacts from Period 2
Major economic factors affecting the sector included increasingly high inflationary pressures and
continued shortages.3 Along with the rest of the market, discretionary firms saw decreased
performance as the Federal Reserve remained largely quiet during the first half of the period,
which only added to investors’ concerns as uncertainty grew. However, with the Federal Reserve
finally confirming their aggressive plan on controlling inflation, firms in the sector can expect
discretionary spending to decrease as consumers will begin to prioritize more essential goods.4
The Russia-Ukraine conflict was also a major driver in increasing concern for the overall market.
Multiple firms across all sectors, discontinued business within Russia as sanctions began to pile
on and delivery of products could not be guaranteed.5 Fortunately, both holdings had minimal
exposure in the area in comparison to others. However, with oil already at all time high prices,
the conflict and sanctions will only increase transportation and delivery further. Even with the
bull run towards the end of the period, the Discretionary sector is still down since the beginning
of the year.6 With a recessionary cycle looming, the sector will most likely see a significant
slowdown in the coming months.
Performance
5.00%
0.00%
-5.00%
-10.00%
-15.00%
-20.00%
-25.00%
S&P 500 Consumer Discretionary
12AMAZON, INC. (AMZN)
Holding Description
Mostly known for their ecommerce, Amazon is one of the most dominant firms in the market
due to their reach into adjacent technology spaces. With ecommerce accounting for over 50% of
their $469.8 billion revenue, Amazon also offers cloud computing services through AWS, which
has seen increasingly higher YoY growth.1 Amazon also employs a membership service, Prime,
that offers benefits from free priority shipping, streaming services, grocery delivery, and access
to exclusive brands that is now used by over 200 million active members in 2021.2 While the
Discretionary sector will be more susceptible to upcoming market fluctuations, Amazon already
has a large consumer base with more than enough diversified services to sustain themselves for
the foreseeable future.
Impacts from Period 2
Coming off a strong holiday season, Amazon’s price began to decline as Meta and other
technology firms saw the effects of weakening consumer confidence.3 However, Amazon’s
reported earnings in early February helped recoup losses momentarily before tensions in Ukraine
began to escalate to full conflicts. Early March saw a significant boost in price as Amazon
announced a major 20-to-1 stock split, effective on June 3 with $10 billion in share repurchases.4
Combined with Russia’s agreements to deescalate activity in key Ukraine areas, Amazon’s price
returned to just under its position at the beginning of the year.
Future Outlook
Major changes announced during their earnings report continue to positively impact Amazon’s
valuation as they continually seek to extend their market share across all industries. Reception of
the Prime membership increase went over well as Amazon promised expanded benefits to
compensate. One benefit will include increased content on streaming from their $8.5 billion
acquisition of MGM Studios, which will enable Amazon to compete against the likes of
Disney+, HBO Max, and Netflix.5 On top of this, Amazon’s cloud service, AWS, has also seen a
massive 40% increase in revenue, which only proves to add to Amazon’s resilience to any
coming recession.
New Transactions
There were no transactions made involving AMZN during Period 2.
Dividends
Period Beginning Value Ending Value % Return
Received
Period 2 $ 51,121.35 $ 48,899.25 -2.23% $ -
13NIKE, INC. (NKE)
Holding Description
Nike is currently the largest sports apparel developer in the world, specializing in design and
innovation.1 As the largest athletic shoe retailer in the world, Nike employs a unique production
process that has been able to maximize profit margins by not owning any production plants at all.
All production is outsourced through contracts with other companies.2 This method is now
largely employed through many of the top competitors, Adidas and Reebok.
Impacts from Period 2
Nike was one of the first large-cap firms to report earnings with some substantial time since the
beginning of the Russia-Ukraine conflict. Fortunately, Nike was still able to beat earnings as
retail demand remained strong in January and February.3 Nike’s new Direct business model will
shift focus to direct-to-consumer sales rather than through retailers.4 Another concern from the
previous period was the declining sales in the Greater China region. However, Nike only
reported a 5% decrease in sales compared to the prior 20% decrease. The Asia Pacific & Latin
America region also saw a significant rebound of 11% after a decrease in sales the prior period.
One major concern includes the resurgence of COVID in parts of Southeast Asia. With stricter
laws and mandates, Vietnam and China will possibly issue another lockdown mandate that will
close multiple Nike factory contractors, which is one of the main drivers of Nike’s decision to
push their Direct business model.5
Future Outlook
Nike Direct looks to be promising as revenues crossed $4.6 billion. With Nike’s aggressive shift
away from retail stores, Nike will be able to increase their gross margins. The real test for Nike’s
decision will be their performance as they remove their products from retailers. With recent
stock prices for Foot Locker, the market looks to believe that Nike will come out on top of this
move. However, with discretionary spending dramatically shifting with a more aggressive
Federal Reserve policy, Nike may see a significant decrease in sales as consumers begin
prioritizing spending. Although Nike does operate on all consumer economic levels, Nike has
benefited greatly from higher ticket items. With rollouts of the new vaccine boosters, Nike may
not have to worry about any more future shutdowns.
New Transactions
There were no transactions made involving NKE during Period 2.
Dividends
Period Beginning Value Ending Value % Return
Received
Period 2 $ 10,868.22 $ 8,880.96 -19.27% $ -
14CONSUMER STAPLES
Manager: Eldon Lu
Sector Overview
The Consumer Staples sector relates to all products deemed to be essential to consumers' well-
being. Industries in the sector include Food, Beverages, Household, and Personal Products.
Because of the importance of these products, the sector is non-cyclical in that the sector does not
react to general market fluctuations and changing economic cycles, a key factor for investors
looking to maintain their position for a nearing recessionary period.1 Generally, consumers are
willing to pay whatever price to obtain these products because of their essential nature. Due to
the many substitutes within each industry, consumers can easily modify their spending on higher
or lower quality products. Because of this, price elasticity remains relatively constant, thus
causing the sector to remain consistent.2 During the period, the Carroll Fund held two consumer
staples holdings, Walmart Inc. (WMT) and PepsiCo (PEP).
Impacts from Period 2
With a mostly bearish market this period, investors have already begun moving to more
defensive holdings where they were rewarded with continuous dividends and minimal
movements. Although inflation has become a major issue, demand for some products has
remained strong. Slowing and stagnant quarterly earnings can be expected during a full
recessionary period, but an opportunity could be with more discount stores as consumers may
shift spending towards cheaper products to maintain their standard of living. One major
consequence following Russia’s invasion of Ukraine will be commodity futures.2 As of now,
both countries supply around 25% of the wheat in the world with significant exports in corn,
soybeans, and fertilizer, all of which most production has already been halted as the conflict
continues.3 Firms reliant on agriculture will all see rising prices as outsourcing to other areas will
become even more expensive with current oil prices, and demand has skyrocketed due to
COVID-19 rebounds. Undoubtedly, firms can pass these increased costs to consumers, but there
still may be a notable shift in demand for other commodities to substitute, such as rice.
Performance
2.00%
0.00%
-2.00%
-4.00%
-6.00%
-8.00%
-10.00%
-12.00%
-14.00%
S&P 500 Consumer Staples
15PEPSICO, INC. (PEP)
Holding Description
PepsiCo specializes in the Food and Beverage industry as they have the second largest market
share for soft drinks in the U.S., second only to Coca-Cola. However, they differ from Coca-Cola
in their product line up that reaches in the packaged goods industry through their mergers with
Frito-Lay. By diversifying their portfolio, PepsiCo has been able to explore many more
opportunities than Coca-Cola and all other competitors.1
Impacts from Period 2
Continued increased costs from supply chain issues and inflationary pressures have begun to
start cutting into the bottom line of PepsiCo. CEO Hugh Johnston has already made plans to
increase prices to maintain margins.2 Some customers may shift spending to less expensive
options, but there most likely will not be any major changes that would shift a substantial
number of consumers away from PepsiCo products. The ongoing Russia and Ukraine conflict
may also prove to have some immediate effects as PepsiCo attributes roughly 4.3% of revenue
from both countries, which they have already stated they would be suspending business in
Russia.3
Future Outlook
Despite the increase in price for a large portion of their staple products, PepsiCo hopes to return
gross margins back to normal as increased input costs have been the main concern for most of
the period.4 Additionally, PepsiCo also expects to miss early revenue expectations with overall
expenses likely increasing further. The pullback from Russia only exacerbates this belief and
could be substantial. Regardless, PepsiCo also still plans on an end-to-end sustainable
transformation of their production process under the name “pep+”, which includes net-zero
emissions, reduction in plastic usage, and overall revitalization of current farmlands.5
New Transactions
There were no transactions made involving PEP during Period 2.
Dividends
Period Beginning Value Ending Value % Return
Received
Period 2 $ 21,968.46 $ 21,257.26 -2.41% $ 273.06
16WALMART, INC. (WMT)
Holding Description
Walmart is a retail corporation that specializes in general retail that spans across all industries
within the sector. Their goals from the very beginning have been to provide a one-stop place for
consumers to purchase all goods. Main competitive advantage includes being a cost-leader and
variety of options, which has led to their continued success despite economic fluctuations.1 Their
main sales come from traditional brick and mortar stores, but they also maintain a large presence
in ecommerce.2
Impacts from Period 2
Despite a turbulent period, Walmart beat expectations during their quarterly earnings, reported in
mid-February, a week before Russia’s invasion of Ukraine.3 Net international sales saw a
significant decrease of $7.9 billion, impacted by $10.1 billion divestures from the UK,
Argentina, and Japan areas. More importantly, operating expenses saw a notable increase from
shipping costs and inflation, but expenses remained neutral when compared to net sales.4
Walmart has specifically outlined that navigating increased expenditures was priority during the
period and will continue to be for the foreseeable future.
Future Outlook
Although the effects of the Ukraine-Russia conflict are not present in their earnings, Walmart
does not have any stores in Russia or have any large investment in the area. Walmart
International accounts for roughly $27 billion of their net sales compared to the overall $151.53
billion earned during the quarter. Strongest performers abroad were Mexico and China.
However, Walmart’s biggest driver looking forward is their ecommerce growth. With Walmart
already controlling most physical sales, Walmart has much more growth potential in the online
space. Competing against the likes of Amazon and Target, Walmart still employs their cost
saving methods for an advantage that has grown ecommerce revenue by 11% in 2021, and 90%
total over the past two years. Walmart expects stable sales growth of 5-6% heading into 2023.5
New Transactions
There were no transactions made involving WMT during Period 2.
Dividends
Period Beginning Value Ending Value % Return
Received
Period 2 $ 11,427.35 $ 11,764.68 3.30% $ 43.45
17ENERGY
Manager: Alyssa Thomas
Sector Overview
The Energy sector of the economy comprises companies that are involved with producing and
supplying energy.1 These companies are dominated by activities such as exploration, extraction,
refining, transporting, production, and distribution of energy. Energy companies are divided into
upstream, midstream, and downstream based on the activities they are involved in. Energy is
possibly the most important commodity, as it provides fuel to power all businesses around the
world and proves to be essential to daily life. Non-renewable energy is the most globally
consumed energy source.2 However, within the last few decades there has been an evident, and
continuously growing, trend of investing in renewable energy sources due to changing
environmental policies/concerns. Energy companies’ profits are driven by the overall global
demand and supply of oil. The Energy sector has a market weight of 3.89% and a market cap of
$3.69 trillion.
Impacts from Period 2
The Energy sector outperformed the S&P 500 in Period 2. Due to supply restrictions coupled
with strong demand, oil prices began rising steadily at the beginning of Period 2. From January
to February, Brent Crude averaged around $88 per barrel, while WTI Crude averaged about $81
per barrel. On February 24th, 2022, Russia invaded Ukraine. This invasion caused the prices of
energy sources, specifically crude oil and natural gas, to spike even higher. Brent Crude reached
a high of $127.98 per barrel. Similarly, WTI Crude rose to a high of $123.70 per barrel. The
United States, along with numerous European countries, placed sanctions on Russia, further
weakening the global oil supply. Furthermore, OPEC has decided to stick to their original plan of
modest oil production increases, despite critical strains on supply. However, the Biden
administration announced that beginning in May 2022, they would release 1 million barrels a day
from U.S. strategic reserves for the next six months. After this announcement on March 31st, oil
prices dropped about 6% on the day. With inflation still elevated, production levels remaining
low, and the continuation of the Russia-Ukraine war, the Energy sector may continue to achieve
outperformance for much of 2022.
Performance
50.00%
40.00%
30.00%
20.00%
10.00%
0.00%
-10.00%
-20.00%
S&P 500 Energy
18CONOCOPHILLIPS (COP)
Holding Description
ConocoPhillips is an independent exploration and production company.1 Based on reserves and
oil production, ConocoPhillips is the world’s largest upstream company.2 It is involved with the
exploration, production, transportation, and marketing of crude oil, natural gas, liquified natural
gas, and bitumen globally.3 ConocoPhillips is focused on sustainably meeting energy demand. It
has adopted strategies to become a net zero company by 2050. ConocoPhillips has six operating
segments: Alaska, Asia Pacific, Canada, Europe, Middle East and North Africa, and Lower 48
(North American regions). ConocoPhillips' mission is to power civilization.
Impacts from Period 2
ConocoPhillips had outstanding performance over Period 2, outperforming not only the S&P 500
but the industry as well. ConocoPhillips share price appreciated by about 50%, reaching a new
high of around $107 per share. Investors became more interested in COP during Period 2 due to
the steep rise in oil prices. Profit margins for upstream companies are directly tied to the price of
the underlying commodities they produce.4 Therefore, because of the surge in oil prices,
investors future expectations of COP’s profits increased, pushing the share price up.
Furthermore, to take advantage of the all-time high share price, at the end of Period 2, the Carroll
Fund sold half of the position in ConocoPhillips.
Future Outlook
ConocoPhillips should continue to outperform the market if oil prices stay elevated and investors
stay positive. COP is expected to post Period 2 earnings on May 5th, and analysts are expecting
the results to be superior. Analysts have published solid earnings estimate revisions, emphasizing
that they are becoming more bullish on COP’s short-term and long-term performance. In fact,
upcoming earnings estimates have risen from $2.46 per share to $2.53 per share.5 The Carroll
Fund has contemplated selling the other half of ConocoPhillips once a new energy company has
been proposed because COP is a very small percentage of the overall portfolio. However, we
will wait to see the results of COP’s Period 2 earnings before deciding.
New Transactions
The Carroll Fund sold 68 shares of COP at $101.40 per share on March 30th, 2022.
Dividends
Period Beginning Value Ending Value % Return
Received
Period 2 $ 10,032.72 $ 6,800.00 40.43% $ 89.76
19FINANCIALS
Manager: Grant Kizer
Sector Overview
The Financials sector is a crucial part of the domestic and global economies. Making up about
11.4% of the S&P 500, the sector is comprised of a variety of financial services that it offers to
institutional, corporate, and retail customers.1 The three primary industry groups within the
Financials sector are Banks, Diversified Financials, and Insurance Companies. Diversified
Financial companies could include traditional consumer finance, fintech companies, capital
markets, card issuers, and other specialized financial services.2 Usually indicative of the health of
the overall economy, the Financials sector facilitates growth and investment into the overall
economy. Outside of investment banking and M&A, a large portion of the sector generates
revenue from mortgages and loans, which grow inversely with interest rates. Meaning, if interest
rates are low, customers can more easily borrow to grow their businesses, finance their homes,
issue insurance policies, etc., implying economic growth. Conversely, if interest rates are rising
moderately, financial service companies stand to earn more on the credit they issue to
customers.3 The Carroll Fund currently holds four equities classified as financial companies.
They are JPMorgan Chase & Co (JPM), PayPal Holdings Inc (PYPL), S&P Global Inc (SPGI),
and Visa Inc (V).
Impacts from Period 2
Over the course of Period 2, inflation continued higher while the Federal Reserve made their first
rate hike, so bond markets continued to sell off contributing to the slowdown in M&A and
investment banking revenue so far in 2022.4 In sync with rising interest rates, mortgage rates
began to rapidly increase from their previously suppressed levels. As a result, demand for
mortgages is down more than 40% from a year ago.5 Consumer habits also began to shift from
heavy spending to being more conservative as prices rose. Ultimately the Federal Reserve’s plan
to raise rates is necessary to combat inflation, but it will come at a cost to the overall growth of
the economy. The only questions are how long and how much rates will be raised. Banks do
stand to gain from higher interest rate margins in a rising rate environment even though this is
unlikely to make up for the lower investment banking revenue.
Performance
10.00%
5.00%
0.00%
-5.00%
-10.00%
-15.00%
S&P 500 Financials
20J.P. MORGAN CHASE & CO. (JPM)
Holding Description
JPMorgan Chase & Co. provides global financial services and retail banking. They provide
services such as investment banking, treasury and security services, asset management, private
banking, card member services, commercial banking, and home finance, serving business
enterprises, institutions, and individuals. With $3.4 trillion in assets, it is the largest bank holding
company in the U.S.1 JPM’s primary revenue segments are Corporate and Investment Banking,
Consumer and Community Banking, Asset and Wealth Management, and Commercial
Banking.
Impacts from Period 2
Over the course of Period 2, there were many negative effects felt by JPM and the banking sector
in general. For starters, investment banking and M&A revenues have fallen off after a record
year for big banks. Capital market volatility has also put pressure on banks like JPM.2 In
addition, exposure to Russian reserves contributed to further losses. In January, JPM reported
$3.33 EPS still beating estimates but continuing the downward trend in growth seen in recent
quarters.3 Typically, a leader in investment banking activity, JPM stock underperformed nearly
every big bank, down around 15.67% over the period.4
Future Outlook
Moving Forward, JPM is without a doubt one of the most well-renowned banks in the history of
the United States, and the Carroll Fund has confidence that they will be able to weather any
challenges that are being faced. However, CEO, Jamie Dimon, did cite several causes for
concern in his annual letter to shareholders. He notes the unprecedented circumstances the world
finds themselves in regarding the direction of inflation, interest rates, and the end of quantitative
easing. In addition, the war in Ukraine and sanctions imposed by the West, have further limited
economic prospects. Dimon says the company is preparing for potential negative outcomes, but
he is also hopeful that the Federal Reserve will be able successfully maneuver a soft landing for
the economy.5
New Transactions
There were no transactions made involving JPM during Period 2.
Dividends
Period Beginning Value Ending Value % Return
Received
Period 2 $ 14,391.30 $ 12,132.48 -13.28% $ 89.00
21PAYPAL HOLDINGS, INC. (PYPL)
Holding Description
PayPal Holdings, Inc. operates as a technology platform company that enables digital and mobile
payments on behalf of consumers and merchants. The company offers online payment solutions
and serves customers all over the world. PayPal is a major player in the online payments
industry. The company has approximately 348 million active accounts and almost 30 million
merchant accounts across more than 200 markets.1 PayPal’s legacy revenue segment as a
payment processor has grown consistently for the last several years, targeting a 20% YoY
revenue growth. However, the tech platform has been more ambitious as of late, making
acquisitions that may better position them to become an all-in-one super app for financial
services. Venmo, a peer-to-peer mobile wallet service, is also owned by PayPal.
Impacts from Period 2
As the macro landscape shifted towards a rising rate environment, many tech stocks were sold
off in anticipation of the economic slowdown. However, PYPL was among the stocks that were
hit the hardest as many investors began to realize that the companies extremely high growth may
be harder to sustain than originally anticipated. The sell-off was triggered by an earnings release
in February at 10.1% YoY growth, much lower than previous periods.2 As a result, the stock is
now trading on par with its historical valuations as a payment processor. It is now trading at 31
P/E, well below its 5-year average of 59 P/E.3
Future Outlook
Moving forward, it will be important for PayPal to continue to innovate in the payment space if
they want to regain their high-growth status. Venmo is a massive prospect for PayPal as a
leading peer-to-peer payment service that should continue to grow. While the Carroll Fund
allocation to PYPL was mistimed, managers believe that the stock is at a much more attractive
level as a legacy payment processor. The space is highly competitive, and PayPal boasts close to
50.32% market share for online payment processing.4 They are also expanding to contactless
point of sale for in-store purchases, which could help achieve faster growth. Overall, the
prospects are there for PayPal, but it will be important for the company to keep growing user
activity amid the current economic environment.
New Transactions
There were no transactions made involving PYPL during Period 2.
Dividends
Period Beginning Value Ending Value % Return
Received
Period 2 $ 15,595.20 $ 9,252.00 -38.67% $ -
22S&P GLOBAL, INC. (SPGI)
Holding Description
S&P Global Inc. provides clients with financial information services. The company offers
information regarding ratings, benchmarks, and analytics in the global capital and commodity
markets, operating worldwide. SPGI serves the entire financial world, including but not limited
to institutional investors, investment banks, government agencies, exchanges, etc. SPGI’s four
primary revenue segments are S&P Global Ratings, Market and Commodities Intelligence, S&P
Dow Jones Indices, and S&P Global Platts. Most of these revenues are subscription-based.1 The
tools that SPGI offers are well known around the world and are used by a wide range of
customers.
Impacts from Period 2
On February 28th, SPGI announced that they had completed a merger with IHS Markit (INFO)
worth $140 billion. With the transaction complete, SPGI hopes to offer an enhanced value
proposition to its customers, offering a broader portfolio of products.2 This large deal along with
macroeconomic pressures most likely contributed to the firm’s negative performance over Period
2. They announced earnings in February at 18.8% YoY growth, down from 27.1% the prior
quarter.3
Future Outlook
Although SPGI will have some increase in capital expenditures due to its deal with INFO, the
long-term prospects for the company will benefit significantly. For starters, the company is
targeting revenue growth of over 40% in 2022, expecting organic growth of 6.5-8%. The deal
will lead to a bump in profit margins for the company as it expands its product offerings. The
company is already the leader in global market information, and the INFO deal has solidified this
for years to come.
New Transactions
There were no transactions made involving SPGI during Period 2.
Dividends
Period Beginning Value Ending Value % Return
Received
Period 2 $ 24,899.40 $ 22,149.72 -12.92% $ 41.58
23VISA, INC. (V)
Holding Description
Visa Inc. operates a retail electronic payments network and manages global financial services.
The company offers global commerce through the transfer of value and information among
financial institutions, merchants, consumers, businesses, and government entities. One of the
world’s leaders in digital payments, Visa also has around 3.7 billion credit and other payment
cards in circulation across more than 20 countries. VisaNet, its transaction processing network,
authorizes, clears, and settles payments. It also offers multiple products, payment platforms, and
value-added services and has the capacity to process an average of over 635 million transactions
per day. Visa’s three strategic areas of focus include investing and growing card-based
payments, accelerating its efforts in non-card, cross-border payments and digitizing domestic
accounts payable and receivable along with new flows and value-added services.1
Impacts from Period 2
As the largest payment processor in the world, Visa did not feel the downward pressure that most
tech stocks faced. Even though revenue growth did slow, EPS for their first quarter were $1.61, a
27% increase YoY.2 As a result, the stock outperformed most of the market. Inflation also
continued to increase over the period, triggering more swift Federal Reserve action regarding
interest rates. Consumer sentiment did begin to deteriorate over the period, but it didn’t seem to
sway investors away from the legacy payment processor.
Future Outlook
Like all payment processors, it will be important for Visa to continue to innovate in the space. If
they don’t use their vast resources to combat all the competition, they could be at risk of losing
their massive market share. Despite this, the Carroll Fund expects Visa to continue to dominate
the industry. In the short-term, as inflation continues higher and the Federal Reserve begins to
raise rates, consumer spending habits could begin to shift towards less spending. This could
dampen Visa’s revenue for the meantime, so it will be important to monitor the macroeconomic
landscape and how it will affect the average consumer.
New Transactions
There were no transactions made involving V during Period 2.
Dividends
Period Beginning Value Ending Value % Return
Received
Period 2 $ 21,257.28 $ 21,289.92 2.51% $ 36.00
24HEALTHCARE
Manager: Gabrielle Cyr
Sector Overview
The Healthcare sector has a market cap of $8.39 trillion and a market weight of 13.69%. The
sector is divided into two industry groups which are further divided into six industries.1
• Healthcare Equipment and Services: Healthcare Equipment and Supplies,
Healthcare Providers and Services, Healthcare Technology
• Pharmaceuticals, Biotechnology, and Life Sciences: Biotechnology, Life Sciences
Tools and Services, Pharmaceuticals
The sector is known to be a defensive sector, is highly price inelastic, and extensive government
regulation remains present.2 Cash flows are metrics to look at when determining if companies
can meet their debt obligations, given they generally have higher capital expenditures requiring
higher use of debt.3 The Carroll Fund currently holds four Healthcare holdings: ARK Genomic
Revolution ETF (ARKG), CVS Health Corporation (CVS), Merck and Co. (MRK), and Organon
and Co. (OGN).
Impacts from Period 2
Throughout Period 2, a second booster came out for high-risk individuals, following concerns of
new variants with COVID.4 Another round of lockdowns overseas due to an increased number of
COVID cases, specifically in the larger cities of China, raised concern for the global economy.5
Despite new variants emerging and shutdowns looming, elective care procedures continued to
regain strength, which has boosted performance for the Healthcare Equipment and Supplies
industry.6 Since the pandemic, the sector has become more technologically advanced and has
taken strides towards artificial intelligence.7 Like Period 1, there has continued to be shortages in
the Healthcare field, due to exhaustion and burnout leading to early retirement. Because there are
shortages, the sector has seen an increase in wages and a decrease in the quality of care
nationwide.8 Throughout the pandemic and into Period 1, telehealth companies flourished as the
nation moved towards decentralized healthcare for more flexibility and safety. This trend is
expected to continue throughout Period 2 and for years to come.9
Performance
2.00%
0.00%
-2.00%
-4.00%
-6.00%
-8.00%
-10.00%
-12.00%
-14.00%
S&P 500 Healthcare
25ARK GENOMIC REVOLUTION ETF (ARKG)
Holding Description
ARK Genomic Revolution is an actively managed ETF that aims for long-term growth through
investing in securities across multiple sectors that go along with the theme of genomics
revolution. Companies within the fund should benefit from “extending and enhancing the quality
of human and other life by incorporating technological and scientific developments and
advancements in genomics into their business.”1
Impact from Period 2
The top two holdings in the ETF contribute to the performance of the fund over Period 2. Exact
Sciences Corporation is a molecular diagnostics company that specializes in the detection of
early-stage cancers. They have seen positive revenue growth but still are not profitable. COVID
shifting to an endemic should be a tailwind for the company, but as investors shift to value stocks
during a rising interest rate environment, the firm may not be through their most difficult times.2
Teladoc Health is a virtual telehealth company that lost revenues over Period 2 as the country
began to recover from the pandemic. They are still not profitable, and may not be for a while, but
they do have positive free cash flows. In a rising interest rate environment, TDOC may see more
volatility throughout 2022.3 Since many stocks within ARKG are at the head of artificial
intelligence in the Healthcare sector, investors have shifted away from these holdings and
towards more value stocks.
Future Outlook
Artificial intelligence is the direction the Healthcare sector is moving to improve the way
healthcare professionals diagnose, treat, and manage disease. Out of the top holdings, numerous
are at the forefront of research for artificial intelligence in the industry, so strong returns are
predicted in the next 5-10 years. In the current economic environment, ARKG will likely
experience poor performance and volatility, but the Carroll Fund believes the ETF is a good
long-term hold.4
New Transactions
There were no transactions made involving ARKG during Period 2.
Dividends
Period Beginning Value Ending Value % Return
Received
Period 2 $ 9,678.78 $ 7,027.29 -25.00% $ -
26CVS HEALTH CORPORATION (CVS)
Holding Description
CVS (Consumer Value Stores) Health Corporation is a healthcare solutions company that aims
to assist people in navigating the healthcare system through improving access, lowering costs,
and becoming a trusted partner for every moment in health. They do this through a local
presence, digital channels, and colleagues such as physicians, pharmacists, nurses, and nurse
practitioners.1 Revenue segments include Pharmacy Services, Retail/LTC, Healthcare Benefits,
and Corporate/Other. They earn most of their revenues from the pharmacy and retail segments of
their business.2 They have over 9,900 retail locations in 49 states, the District of Columbia, and
Puerto Rico. They have had over 50 million visits to their minute clinics and have about 300,000
colleagues across all 50 states. CVS was also the first pharmacy retailer to stop selling tobacco,
consistent with their shift to a strict healthcare focus.3
Impacts from Period 2
In February of 2022, CVS announced their 2022 Supplier Diversity and Minority Summit. This
event goes along with their ongoing goal of bringing more diverse products and brands to their
customers through their retail operations. Branching out to more brands and groups in the
community should continue to increase their customer base, and therefore, their revenues as
well.4 COVID-19 vaccines and testing has begun to slow down, which has impacted retail sales
as well. Many shoppers bought other items in store as they went in for a shot, so retail sales have
taken some hits.5 Lastly, a new COVID booster shot has been released, which could maintain
some revenues and foot traffic stemming from the pandemic, even as things begin to slow back
down and return to normal.6
Future Outlook
Throughout 2022, CVS plans to shift the format of their stores, closing some in the process.
There will be three formats: stores for primary care services, enhanced HealthHUB services for
products focused on everyday health and wellness, and the traditional CVS pharmacy stores.
They plan to close about 300 locations over the next 3 years.7 CVS is projecting a drop in
vaccine sales of up to 80% throughout 2022 and a drop in COVID test sales of 40-50%.8
Effective July 2022, CVS will raise wages to $15/hour which will increase overhead costs for the
company, hurting the bottom line. This move will make the company more competitive in the
labor market, as many companies are moving towards the higher minimum wage.9 Overall, the
Carroll Fund is confident in the business model and prospects for CVS Health Corporation and
will continue to hold for the long-term.
New Transactions
There were no transactions made involving CVS during Period 2.
Dividends
Period Beginning Value Ending Value % Return
Received
Period 2 $ 16,873.92 $ 16,396.02 -1.36% $ 89.10
27MERCK & CO. (MRK)
Holding Description
MRK (Merck and Co.) is a multinational pharmaceutical company that aims to be at the forefront
of research to bring forward medicine and vaccines for the world’s most challenging diseases to
save people’s lives and improve health care. They focus on people and animals, with a larger
focus on their human health segment.1 A key driver of Merck is the FDA approval process. The
pipeline of approval directly correlates to their profits and points out where the company can
monetize their new drugs/treatments. Research and development plays a key role in the success
of the business. In 2021 alone, they invested $10.1 billion in research and development for their
new products. In 2021, the Keytruda revenue segment, a skin cancer treatment drug, accounted
for almost 45% of the company’s revenues.2
Impacts from Period 2
As of Period 2, the company currently has 75 products in phase two of the pipeline, 28 in phase
three, and three under review. Of the products under review, one of the drugs is made in
combination with Keytruda, the drug producing the most revenues for the company.3 The
company has many supply and purchase agreements in place for providing COVID therapy,
which is expected to contribute $5-$6 billion in revenues over the course of 2022. The anti-viral
pill in late-stage development will also contribute to COVID relief.4 MRK paid a first quarter
dividend in January and announced a second quarter dividend to be paid in April.5
Future Outlook
MRK currently has 75 products in phase two of the pipeline and 28 in phase three, so there are
many drugs with potential to be developed in the coming years. Many of the drugs in the pipeline
are developed with Keytruda which could pose issues at the drug nears expiration.6 The patent
for Keytruda is set to expire in 2028, which is coming close.8 It will be crucial for the company
to pivot some of their operations since their business is centered around Keytruda. If not, the
company could potentially take huge hits when the patent expires. Overall, Merck & Co. is a
profitable company with strong prospects, which makes the company a good long-term hold for
the Carroll Fund.
New Transactions
There were no transactions made involving MRK during Period 2.
Dividends
Period Beginning Value Ending Value % Return
Received
Period 2 $ 21,600.47 $ 23,056.05 7.96% $ 193.89
28ORGANON & CO. (OGN)
Holding Description
OGN (Organon & Co.) is a healthcare company focusing on the care of women at every stage of
their life. They spun off from Merck and Co. in June of 2021. OGN emphasizes reproductive
health, heart disease, dermatology, allergies, and asthma. A large part of their business are
biosimilars to treat disease.1 While they are a newer company, the FDA approval process will
continue to be crucial to their revenues. As they develop new medicines and treatments, the
pipeline of approval will determine how they are able to monetize their business. Revenues come
from Established Brands, Women’s Health, Biosimilars, Other Organon Products, and Merck
Retained Products. Established Brands accounts for almost 65% of revenues, Women’s Health
comprises about 26%, and biosimilars almost 7%.2
Impacts from Period 2
Throughout Period 2, OGN has been fairly quiet as they prepare for the Humira biosimilar
launch. The company entered into a global license agreement with Daré Bioscience, Inc. to
commercialize XACIATO, a drug to treat bacterial vaginosis. This move contributed to the
company’s goal of innovation in women’s care through using their strengths and expertise to
collaborate with other women’s health innovators.3
Future Outlook
OGN is a steadily growing firm with strong prospects. They acquired Forendo Pharma at the end
of 2021, which focuses on women’s health. Forendo Pharma has numerous products in
development closely tied to the treatment of endometriosis, metabolic issues, hyperandrogenism,
and infertility. Most notable treatments are in phase two of clinical development.4 Organon &
Co. has been preparing for the launch of their Samsung-partnered biosimilar, Humira, to come in
2022. The popular birth control implant, Nexplanon, is also expected to gain market share in the
following years.5 Overall, OGN is a resilient firm with room to grow. They are well diversified
within their business segments and do not display a large dependence on any one segment. With
a low multiple, the firm was able to offer dim 2022 guidance and not be penalized. OGN remains
a strong long-term hold for the Carroll Fund.
New Transactions
There were no transactions made involving OGN during Period 2.
Dividends
Period Beginning Value Ending Value % Return
Received
Period 2 $ 15,268.40 $ 17,115.70 15.63% $ 137.20
29You can also read