Capturing COVID-19-Like Symptoms at Scale Using Banner Ads on an Online News Platform: Pilot Survey Study
←
→
Page content transcription
If your browser does not render page correctly, please read the page content below
JOURNAL OF MEDICAL INTERNET RESEARCH                                                                                                          Dixon et al

     Original Paper

     Capturing COVID-19–Like Symptoms at Scale Using Banner Ads
     on an Online News Platform: Pilot Survey Study

     Brian E Dixon1,2, MPA, PhD; Sumit Mukherjee3, PhD; Ashley Wiensch2, MPH; Mary L Gray4,5, PhD; Juan M Lavista
     Ferres3, MSc; Shaun J Grannis2,6, MD, MSc
     1
      Department of Epidemiology, Richard M Fairbanks School of Public Health, Indiana University, Indianapolis, IN, United States
     2
      Center for Biomedical Informatics, Regenstrief Institute, Indianapolis, IN, United States
     3
      AI for Good Research Lab, Microsoft Corporation, Redmond, WA, United States
     4
      New England Lab, Microsoft Research, Cambridge, MA, United States
     5
      Luddy School of Informatics, Computing, and Engineering, Indiana University, Bloomington, IN, United States
     6
      Department of Family Medicine, Indiana University School of Medicine, Indianapolis, IN, United States

     Corresponding Author:
     Brian E Dixon, MPA, PhD
     Department of Epidemiology
     Richard M Fairbanks School of Public Health
     Indiana University
     1050 Wishard Boulevard, Floors 5 and 6
     Indianapolis, IN, 46202
     United States
     Phone: 1 317 278 3072
     Email: bedixon@regenstrief.org

     Abstract
     Background: Identifying new COVID-19 cases is challenging. Not every suspected case undergoes testing, because testing
     kits and other equipment are limited in many parts of the world. Yet populations increasingly use the internet to manage both
     home and work life during the pandemic, giving researchers mediated connections to millions of people sheltering in place.
     Objective: The goal of this study was to assess the feasibility of using an online news platform to recruit volunteers willing to
     report COVID-19–like symptoms and behaviors.
     Methods: An online epidemiologic survey captured COVID-19–related symptoms and behaviors from individuals recruited
     through banner ads offered through Microsoft News. Respondents indicated whether they were experiencing symptoms, whether
     they received COVID-19 testing, and whether they traveled outside of their local area.
     Results: A total of 87,322 respondents completed the survey across a 3-week span at the end of April 2020, with 54.3% of the
     responses from the United States and 32.0% from Japan. Of the total respondents, 19,631 (22.3%) reported at least one symptom
     associated with COVID-19. Nearly two-fifths of these respondents (39.1%) reported more than one COVID-19–like symptom.
     Individuals who reported being tested for COVID-19 were significantly more likely to report symptoms (47.7% vs 21.5%; P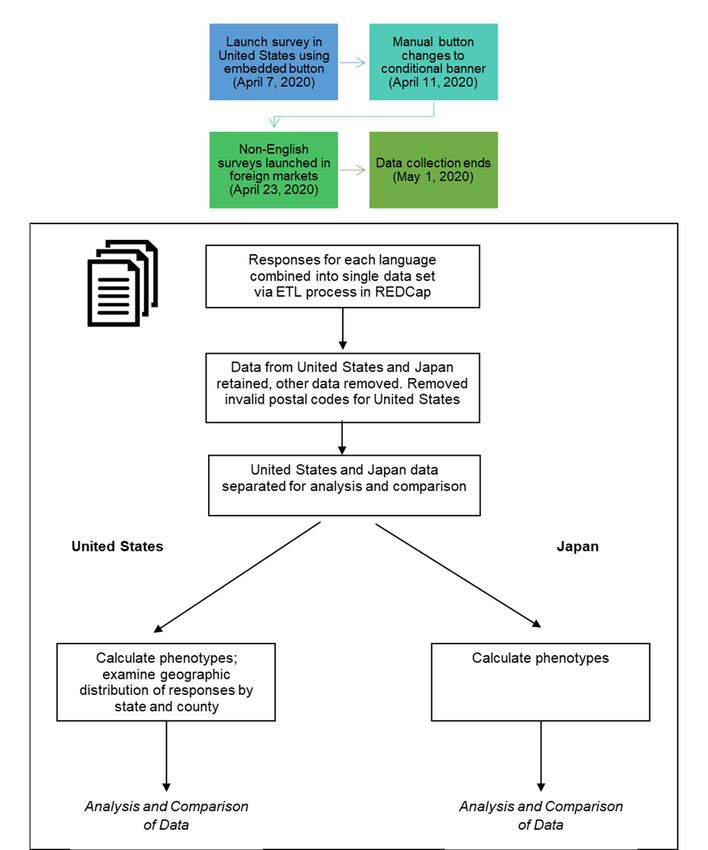
JOURNAL OF MEDICAL INTERNET RESEARCH                                                                                                  Dixon et al

                                                                         In this study, we sought to examine the feasibility of using an
     Introduction                                                        existing web-based news platform to recruit individuals willing
     The global outbreak of SARS-CoV-2 led the World Health              to self-report symptoms associated with COVID-19 as well as
     Organization (WHO) to declare a pandemic on March 11, 2020          health behaviors via a survey. We sought to recruit a diverse
     [1]. SARS-CoV-2 causes COVID-19, which has a range of               set of volunteers in a manner that can be scaled during a
     manifestations from asymptomatic infection to severe                pandemic.
     pneumonia, potentially leading to intensive care utilization and
     death. With over 34 million cases globally, COVID-19 has            Methods
     impacted health and health care in every country. Although
     COVID-19 spread has leveled off in some parts of the world
                                                                         Overview
     [2], public health experts anticipate future outbreaks given that   We employed an epidemiologic survey to collect COVID-19
     only a fraction of the population has been infected with the        symptoms and behaviors from individuals recruited using a
     disease [3].                                                        web-based news platform. Not knowing whether the method
                                                                         would be successful, we approached the project as a feasibility
     Given the need to isolate or quarantine infected individuals in     study. We collected data in multiple countries over 4 weeks to
     order to slow community-level spread, a key component of an         examine the platform’s ability to capture a representative sample
     effective response to COVID-19 is early identification of new       of the underlying population with internet access in order to
     cases. At the beginning of the pandemic, most nations lacked        detect suspected COVID-19 cases before individuals may have
     capacity to confirm positive cases, typically performed using a     sought diagnosis and treatment from the health system.
     real-time reverse transcription–polymerase chain reaction
     laboratory test. Over time, public health as well as hospital and   Survey Instrument
     commercial labs have expanded their abilities to perform            The survey primarily focused on capturing symptoms associated
     COVID-19 tests. However, COVID-19 is challenging to identify        with COVID-19. Using the best available data at the time (early
     because many cases are mild or asymptomatic. Between 40%            April 2020), the following symptoms were included in the
     and 45% of active viral cases do not exhibit symptoms [3,4].        survey: fever, cough, itchy or watery eyes, loss of sense of taste
     Other individuals experience more mild symptoms, such as            or smell, nasal congestion or runny nose, sore throat, and
     muscle aches, that may not prompt them to seek medical care.        shortness of breath or difficulty breathing. Our list was
     Individuals who do not feel sick are less likely to present to      principally based on the list published by the US Centers for
     hospital or clinic for testing. Therefore, many COVID-19 cases      Disease Control and Prevention, which recognized three main
     go unreported, making it challenging for epidemiologists to         symptoms for COVID-19: fever, cough, and shortness of breath
     track COVID-19 spread or model its future impact.                   [15]. An early systematic review, published in March 2020, that
     There exist several infodemiology [5,6] and digital surveillance    included 1576 early COVID-19 patients reported that the most
     tools to identify or estimate suspected COVID-19 cases in a         prevalent clinical symptom was fever, followed by cough,
     population. These tools seek to capture COVID-19 symptoms,          fatigue, and dyspnea [16]. A later review reported the main
     risks, and exposure information directly from consumers.            symptoms to be fever, cough, fatigue, slight dyspnea, sore throat,
     Several recent studies report efforts to capture COVID-19           headache, conjunctivitis, and gastrointestinal issues [17]. We
     symptom data from consumers using internet-based surveys            further included anosmia (loss of the sense of smell) and ageusia
     [7,8] or social media platforms [9,10]. Additional studies          (loss of the sense of taste), because early evidence [18] linking
     examine the use of mobile apps that allow patients to self-report   these symptoms was emerging from the literature around the
     symptoms; some are dedicated to COVID-19, while others are          time of survey development. Because these symptoms were
     extensions of existing platforms [11-13]. Further, some studies     only associated with COVID-19, and they are similar to
     explore the use of web search behaviors to detect potential         symptoms experienced by patients with other diseases, we
     clusters of COVID-19 [14].                                          considered these symptoms to indicate COVID-19–like illness
                                                                         rather than a definitive case of COVID-19, which is confirmed
     Existing COVID-19 surveillance tools tend to focus on tracking      through laboratory testing.
     COVID-19 cases in a localized geographic area. For example,
     a review of COVID-19 mobile apps found that more than half          In addition to symptoms, we asked respondents to report some
     were official apps managed by local health authorities              behaviors linked to COVID-19 risk. We specifically asked
     presumably focused in their local region [13]. Moreover, many       respondents to describe where they had spent time outside of
     reports on existing tools either lack details regarding users who   their home in the past 2 weeks, more than 18 miles from home
     provided information [12,14] or the population surveyed was         or fewer than 18 miles from home. We also asked if they had
     skewed, such as in Shen et al [9] where 85% of respondents          traveled outside of their home country in the previous 2 weeks.
     were between 19 and 40 years of age. To maximize efficacy,          We collected minimal demographics for respondents to protect
     digital public health surveillance tools should capture data from   privacy. The only demographics requested were age group (eg,
     a representative sample across local, state, and national levels    40-49 years) and gender. We further asked for respondents’
     to enable global outbreak identification and trend monitoring.      postal codes (eg, ZIP Code) to enable comparisons with
     Furthermore, public health authorities should use a variety of      localized outbreaks of COVID-19. We did not ask respondents
     surveillance tools to gather data from multiple sources to          to separately report their country of residence. We did not
     triangulate disease outbreaks and trends.

     https://www.jmir.org/2021/5/e24742                                                           J Med Internet Res 2021 | vol. 23 | iss. 5 | e24742 | p. 2
                                                                                                                (page number not for citation purposes)
XSL• FO
RenderX
JOURNAL OF MEDICAL INTERNET RESEARCH Dixon et al
capture race data as it is not customary to collect such COVID-19–related content to prevent oversampling people
information outside the United States. reading about COVID-19. Moreover, editors tried to ensure the
button was placed at a low profile (ie, “below the fold” of the
We created the survey in English and subsequently translated
news article).
it into 12 additional languages for release into 30 different
language markets. Languages included, among others, Mandarin, By April 10, 2020, COVID-19–related content accounted for
French, German, Japanese, Greek, and Spanish. 80% of US news traffic. This challenged the manual embedding
process, placing an unmanageable burden on the Microsoft
Subject Recruitment News editorial team. Therefore, in consultation with the research
To recruit participants, we placed banner ads on the Microsoft team, Microsoft News switched to a conditional banner method
News platform. Microsoft News delivers news from multiple, on April 11, 2020.
popular publishers across web and mobile experiences. The
service is used by nearly a half billion monthly users, making The conditional banner ad methodology involved automatically
it one of the largest audiences of news readers in the world [19]. rendering the ad (Figure 1) at the top of all news articles, but
with the condition that a user would only see the banner twice
The Microsoft News team embedded a link to the Regenstrief in 30 days. The conditional banner provided a gating effect so
Institute survey on its news sites in 31 global language markets that Microsoft News readers could only be served a total of two
to reach a large, general population sample for the survey. Each conditional banners calling for participants to complete the
language market directed users to a survey in that language. survey during any single month. For example, if a reader visited
Initially, Microsoft News editors manually embedded a a travel article and a politics article during the month, the reader
promotion button calling for survey participants that linked to had two opportunities to see the banner ad but would not see it
the survey. Editors randomly embedded the link in again until the next month. Furthermore, once a reader clicked
approximately 150 pieces of news content daily that were on a conditional banner ad, which took them to the survey, they
delivered to readers across the United States. Editors placed a would not receive another conditional banner ad calling for
button on news content at randomized time windows (eg, 5:36 participants until the next month. We offered users two banner
AM Pacific Time [PT]; 2:12 PM PT) to limit the time window ads per month until they completed the survey or until the survey
in an effort to deter malicious tampering (eg, bot attacks) during closed. Although Microsoft News tracked whether a user saw
a 1-week survey pilot period. Unique URLs for each the banner ad more than once, user identifiers were not provided
language-specific survey were also used to prevent bot attacks. to the research team, so we could not identify individuals or
Editors also attempted to avoid placing the button on link their multiple responses.
Figure 1. Screenshot of the Microsoft News platform showing the banner ad placed at the top of the screen that recruited participants to take a survey
about COVID-19 symptoms and behaviors.
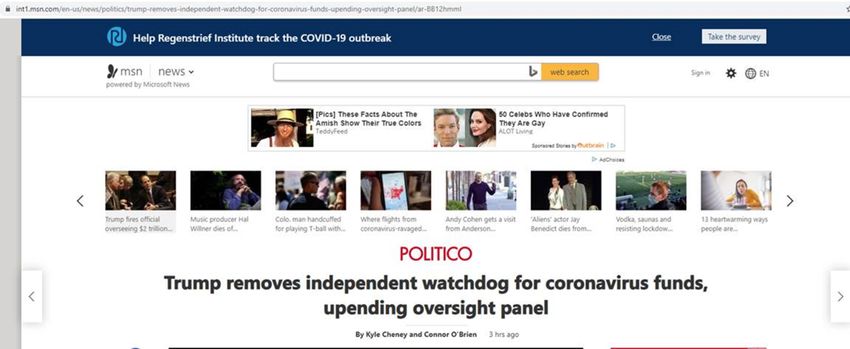
Importantly, Microsoft News readers who clicked on the banner Data Collection
ad always saw an initial screen on the survey site that prompted Surveys were developed and rolled out in two phases. We first
them for their explicit consent to participate, informed them of generated and published the US-based English survey. The
the risks of participating, and gave them a chance to leave the US-based English survey was published beginning on April 7,
survey and either return to Microsoft News or access COVID-19 2020. Beginning April 11, 2020, the conditional banner ad
information resources (eg, WHO site). No user data were replaced the manually embedded button. Non-English surveys
captured until participants consented. The Regenstrief Institute were published on April 23, 2020. All surveys closed on May
monitored referring websites to confirm that nearly all 1, 2020. Figure 2 depicts the overall flow for collection and
respondents came to the survey from Microsoft News. analysis of data.
https://www.jmir.org/2021/5/e24742 J Med Internet Res 2021 | vol. 23 | iss. 5 | e24742 | p. 3
(page number not for citation purposes)
XSL• FO
RenderXJOURNAL OF MEDICAL INTERNET RESEARCH Dixon et al
Figure 2. Overview of data collection and analysis processes. ETL: extract, transform, load; REDCap: Research Electronic Data Capture.
Survey responses were collected and managed in collaboration respondent was captured as a distinct field in the combined data
with Research Technologies, a Pervasive Technology Institute set.
Center at Indiana University (IU) [20], using Research
REDCap is a secure, web-based software platform designed to
Electronic Data Capture (REDCap) tools [21,22]. Data from
support data capture for research studies, providing (1) an
each language-based survey were stored in separate tables on
intuitive interface for validated data capture, (2) audit trails for
the REDCap server, then extracted into a combined data set for
tracking data manipulation and export procedures, (3) automated
analysis using REDCap-ETL (extract, transform, load) and the
export procedures for seamless data downloads to common
IU REDCap-ETL Gateway [23,24]. The language of the
statistical packages, and (4) procedures for data integration and
interoperability with external sources. REDCap-ETL extracts
https://www.jmir.org/2021/5/e24742 J Med Internet Res 2021 | vol. 23 | iss. 5 | e24742 | p. 4
(page number not for citation purposes)
XSL• FO
RenderXJOURNAL OF MEDICAL INTERNET RESEARCH Dixon et al
data from REDCap, transforms the extracted data, and loads We next summarized responses based on respondents’ reported
the transformed data into a database. The IU REDCap-ETL symptoms and behaviors that might contribute to COVID-19
Gateway enables high-throughput data transfer between exposure. We asked respondents to indicate the presence of one
REDCap and multiple endpoints by allowing REDCap-ETL to or more current symptoms, including symptoms believed to be
scale to many simultaneous runs using the job scheduler of a associated with COVID-19 infection and those not shown to be
high-performance computer. associated. The symptoms believed to be more common among
patients testing positive for COVID-19 include fever, cough,
Analytical Methods shortness of breath, loss of sense of taste or smell, and sore
We used descriptive statistics to summarize responses overall throat [7,17,18,25].
and by country to examine patterns. We further employed
ecological methods to compare prevalence by country as well Symptoms associated with COVID-19 were grouped into various
as association methods to examine differences in responses by phenotypes for COVID-19–like illness. We defined four
country. Moreover, we employed correlation methods to different COVID-19 phenotypes for analysis, summarized in
compare symptom responses to standard outbreak measures. Table 1. We examined a variety of phenotypes to explore
More than 85% of responses were received from residents in symptom combinations associated with COVID-19. We
the United States and Japan. Therefore, we only included these examined multiple phenotypes since evidence suggests that
responses in the analysis. many COVID-19 patients experience more than one symptom,
but a specific set of symptoms is not yet definitive. Phenotype
We first examined patterns regarding the limited demographics 3 is the broadest definition for a potential case, as individuals
captured in the survey. Descriptive statistics provide a sense could report any of the symptoms previously known to be
for the representativeness of the respondents. We calculated associated with COVID-19 infection. Phenotype 4 is the most
summary statistics for respondent demographics after removing restrictive phenotype, as it requires indication of fever or loss
all entries that did not provide informed consent, indicated by of taste or smell plus one of the other symptoms associated with
failing to click Next. In all demographic categories, we restricted infection. All phenotypes were informed by available evidence
our summarization to those individuals who did not select prefer [26] indicating which symptoms or combinations are associated
not to say. with infection.
Table 1. Phenotypes for suspected COVID-19 cases.
Symptoms Phenotype 1 Phenotype 2 (one or the other) Phenotype 3 Phenotype 4 (both must apply)
Individual reports Individual reports Individual reports Individual reports Individual reports Individual reports
at least 2 of the any 1 of the fol- at least 2 of the any 1 of the fol- at least 1 of the any 1 of the fol-
following lowing following lowing following lowing
Fever ✓ ✓ ✓ ✓
Cough ✓ ✓ ✓ ✓
Loss of sense of taste or smell ✓ ✓ ✓ ✓
Sore throat ✓ ✓ ✓ ✓
Shortness of breath or difficulty ✓ ✓ ✓ ✓
breathing
To visualize the distribution of respondents in the United States, capita testing rate in each state, since individuals with symptoms
we restricted the data to valid US ZIP Codes. The text field used are theoretically more likely to seek out testing. Second, we
by respondents to enter their postal code was unrestricted, given correlated phenotypes with the reported per capita case rate,
the lack of global conventions for representing residential area. which represents the positive case volume in a given state. These
Invalid ZIP Code entries were ignored when generating maps metrics were obtained from The Atlantic application
of US respondents. States were assigned based on published programming interface [27], which are aggregated from a variety
ZIP Code values associated with each state. To map ZIP Code of sources.
values to US counties, we leveraged a crosswalk between county
Federal Information Processing System codes and ZIP Code.
Ethics Approval
This study was approved by the Institutional Review Board at
Chi-square tests of independence were used to examine whether IU as exempt research.
responses differed significantly between the United States and
Japan. We further compared responses between respondents Results
indicating that they received testing versus those reporting that
they did not receive laboratory testing for COVID-19. We We received a total of 87,322 valid responses. Of these, 47,424
employed correlation to compare the proportion of respondents (54.3%) were from the United States and 27,936 (32.0%) were
meeting various phenotype definitions in a given state to existing from Japan. Table 2 summarizes responses and the
surveillance per capita metrics reported in the same state during demographics of respondents. Responses from Japan are skewed
the study period. First, we correlated phenotypes with the per toward male gender (21,220/27,936, 77.0%), whereas the US
https://www.jmir.org/2021/5/e24742 J Med Internet Res 2021 | vol. 23 | iss. 5 | e24742 | p. 5
(page number not for citation purposes)
XSL• FO
RenderXJOURNAL OF MEDICAL INTERNET RESEARCH Dixon et al
responses are more balanced (male: 25,787/47,424, 57.0%). of respondents from each state and ZIP Code (Figures S1 and
With respect to age, more than half of the respondents from S2 in Multimedia Appendix 1) show broad geographical
both countries were over 50 years of age. Chi-square analysis distribution of responses across the nation. Higher numbers of
found the rates of responses in Japan were significantly different responses were generally observed in areas with higher
from those in the United States. populations. When normalized by state population, responses
were greatest in the northern states, especially the extreme
The distribution of respondents in the United States is depicted
northeastern states and the states in the Upper Plains region.
in Figure 3 as well as in Multimedia Appendix 1. The raw counts
Table 2. Demographics of all respondents (who completed the consent portion) of a web-based questionnaire about COVID-19 symptoms recruited
through the Microsoft News platform.
Demographic All respondents, n (%)a Respondents from the United Respondents from Japan, n P valueb
States, n (%)a (%)a
Age (years) (all: n=83,901; United States: n=45,050; Japan: n=27,536)
80+ 2672 (3.2) 2202 (4.9) 252 (0.9)JOURNAL OF MEDICAL INTERNET RESEARCH Dixon et al
Responses over time are summarized in Figure 4, stratified by The Japanese survey was launched 16 days after the English
the location of the response. Cumulative responses increased survey, yet responses followed a similar pattern with respect to
rapidly in the days immediately after the survey launch followed rapid increase following the launch.
by a continued, steady increase in the weeks after the launch.
Figure 4. Cumulative responses over time, stratified by location of respondent, to a survey on COVID-19 symptoms. The survey was offered in Japan
16 days after it was introduced in the United States.
In Table 3 we summarize the responses with respect to sense of taste or smell, 4820 out of 30,771 individuals with
COVID-19 symptoms, phenotypes, and behaviors. Most symptoms (15.7%) reported at least one of these symptoms in
respondents (56,551/87,322, 64.8%) reported no symptoms. combination with one of the other symptoms (Phenotype 4).
Among those reporting at least one symptom (30,771/87,322, Reported symptoms met phenotype definitions at higher rates
35.2%), a total of 19,631 respondents (63.8%) reported at least among respondents from the United States compared to
one of the following symptoms associated with COVID-19: respondents from Japan (PJOURNAL OF MEDICAL INTERNET RESEARCH Dixon et al
Table 3. Symptoms, phenotypes, and behaviors reported by respondents using a web-based questionnaire recruited through the Microsoft News platform.
Symptoms, phenotypes, and behaviors All respondents (N=87,322), Respondents in the United Respondents in Japan P valuea
n (%) States (n=47,424), n (%) (n=27,936), n (%)
Individual symptom
Fever 3308 (3.8) 2428 (5.1) 527 (1.9)JOURNAL OF MEDICAL INTERNET RESEARCH Dixon et al
Table 4. Symptom combinations and phenotypes among respondents, stratified by whether or not they reported getting tested for COVID-19.
Symptom combinations and phenotypes All respondents (N=87,322), Respondents tested for Respondents not tested for P valuea
n (%) COVID-19 (n=1967), n (%) COVID-19 (n=84,498), n (%)
Individual symptom combination
Fever and cough 2268 (2.4) 318 (16.2) 1895 (2.2)JOURNAL OF MEDICAL INTERNET RESEARCH Dixon et al
draws primarily from populations at least 50 years of age. Both
Discussion findings have implications for future surveillance efforts in
Principal Findings public health.
In this study, we recruited tens of thousands of respondents At time of the survey, Japan’s epidemic curve had started to
within 3 weeks to an online survey asking questions about flatten, with daily increases in new cases between 3% and 5%,
symptoms associated with a novel infectious disease quickly whereas the curve in the United States continued its upward
spreading across the globe using banner ads on an online news trajectory, with daily increases between 10% and 20% (Figure
platform. A principal finding is that an internet news platform 5 [26,28]). On April 30, 2020, the United States reported a daily
is feasible for quickly collecting large-scale data from rate of new infections of 8.26 per 100,000 population. On the
individuals across local, state, and national areas. Furthermore, same date, Japan reported a daily rate of 0.19 new infections
this recruitment method reached an older population at greater per 100,000 population. In this study, rates of reported
risk of complications from COVID-19, distinguishing our study symptoms in Japan were significantly lower than in the United
from prior research. Whereas many infodemiology studies States, providing face validity for respondents’ self-reported
recruit subjects from social media platforms where users are data. This further builds the case for an online news platform
primarily under 40 years of age, the news platform we leveraged as a reliable method for recruiting survey respondents.
Figure 5. COVID-19 epidemic curves for the United States and Japan through May 1, 2020 [26]. The plot shows cumulative confirmed COVID-19
cases. The number of confirmed cases is lower than the number of actual cases; the main reason for that is limited testing. The source of this data is the
European Centre for Disease Prevention and Control, Situation Update Worldwide, last updated August 31, 2020, 10:34 AM (London time). Official
data were collated by Our World in Data [28].
The survey data further yielded interesting insights about the having been tested for COVID-19 than those without symptoms,
pattern of symptoms reported by respondents. First, nearly and those reporting symptoms were significantly associated
two-thirds of those reporting at least one symptom reported at with testing rates. Yet the rates of individuals reporting
least two symptoms. Emerging evidence suggests that symptom symptoms were not significantly associated with positive case
combinations may be predictive of COVID-19 infection [26]. rates, which were admittedly hindered due to limited testing
The fact that most individuals reporting COVID-19–like infrastructure in the United States at the time of the survey [30].
symptoms reported more than one symptom provides further These findings are novel, given the data were captured from
evidence that exploring specific phenotypes might be fruitful community residents rather than individuals hospitalized from
for future research. Second, the constellation of symptoms COVID-19, which is the population most prior studies used to
involving loss of taste or smell with fever appears more often report common symptoms reported by individuals infected with
among individuals who reported that they received testing for SARS-CoV-2.
COVID-19. Several studies report loss of taste and smell as
common among COVID-19 patients [18,26,29], suggesting that
Implications of Findings
these symptoms cause individuals to seek out medical care or Based on these findings, we encourage further study of online
indicate an association with infection. Moreover, those reporting news platforms as a tool for reaching broad and diverse
at least one symptom were significantly more likely to report populations by public health agencies during emerging
outbreaks. Although the news platform was male dominated
https://www.jmir.org/2021/5/e24742 J Med Internet Res 2021 | vol. 23 | iss. 5 | e24742 | p. 10
(page number not for citation purposes)
XSL• FO
RenderXJOURNAL OF MEDICAL INTERNET RESEARCH Dixon et al
and skewed older with respect to population, we recommend and other infodemiology methods to inform public health action.
its use in combination with other epidemiologic methods, Given limited testing infrastructure in many states, analysis of
including infodemiology, random selection, and contact tracing. survey data in comparison with later waves of the pandemic
Only by using multiple methods will public health organizations might better show how survey data correlate with standard
successfully achieve diverse representation in the total set of epidemiologic metrics, such as testing rates, case rates, and
data used to inform disease tracking efforts. Surveying only mortality. Furthermore, the descriptive nature of this study
young, healthy populations is not sufficient for ascertaining prevented examination of potential sampling bias in respondents.
prevalence of diseases like COVID-19. Yet inclusion of younger We observed some skewing related to gender and age. Further
population data is important to understand disease spread during exploration of the methods for ad placement would be necessary
a crisis. It is possible that other news platforms may have to establish news platforms as a reliable method for
younger audiences or cater to specific audiences that would infodemiology.
improve diversity. Capturing data across platforms and methods
The study was further limited by the location data being
to integrate findings would benefit future infodemiology
restricted to postal codes. Postal code structures are not
research.
standardized globally. Some postal codes repeat in the world,
The methods used in this study go beyond the typical methods which prevented accurate mapping of some responses to a
used in public health to ascertain symptoms among individuals correct country or province. Furthermore, some entries in the
who present at clinical or public health sites. Relying on data postal code field were unintelligible. It is also possible that some
from individuals who present physically for treatment or testing of the Japanese responses occurred outside Japan, as postal code
alone is not sufficient to generate population-level information information was self-reported rather than verified with location
about the epidemiology of an emerging infectious disease, as services within the web browser or mobile device. Moreover,
only some individuals present for care or testing. Recall that the survey did not ask whether those tested for SARS-CoV-2
approximately 40% of individuals with COVID-19 are virus tested positive or negative. Therefore, we considered
asymptomatic [3], and many experience mild symptoms that individuals reporting symptoms to have a COVID-19–like
do not require clinical intervention. Moreover, we received illness, recognizing that COVID-19 symptoms are similar to
responses from individuals in small towns and rural several respiratory diseases, such as influenza. The symptom
communities, areas that are often medically underserved, thereby list was further restricted to the best available evidence at the
limiting patients’ ability to present for care. Furthermore, rural time of survey development.
areas often lack robust laboratory testing infrastructures, a broad
In the future, we plan to expand our work to extend the survey
challenge that COVID-19 illuminated. Finally, the methods
to additional audiences and in combination with other methods
used here allowed for at-scale collection of data in a way that
for reaching broader audiences. We further plan to update the
respects individuals’ privacy, as respondents did not need to
symptom list and capture additional details about an individual
provide any data that might otherwise be used to link back to
and their health history that could be correlated with COVID-19
medical records or sensitive information.
cases and/or known risk factors for infection as well as
Internet-based survey methods are needed to gather data quickly hospitalization and death. In addition, because severely ill
during a crisis to inform where the disease might be present or patients may not be able to complete an online survey, we will
where it might be headed next. Modeling efforts at the start of also explore whether our survey might be adapted to allow
the COVID-19 pandemic were limited by a paucity of input respondents to report information on family members who may
data as well as a priori assumptions that drive model parameters. be experiencing COVID-19–like symptoms.
Having intelligence on symptoms from a broad population as
well as behaviors (eg, those travelling >30 km from home) could
Conclusions
better inform model development. Moreover, understanding News platforms can be used to quickly recruit study participants,
which populations have received testing, and which ones do enabling collection of infectious disease symptoms at scale and
not appear to have access to testing, can inform deployment of with populations that are distinct from those found through
test kits by national and/or state public health agencies. Finally, social media platforms. Such platforms could enable
identification of symptom hot spots could help drive deployment epidemiologists and researchers to quickly assess trends in
of personal protective equipment as well as health care workers. emerging infections potentially before individuals present to
clinics and hospitals for testing and/or treatment.
Limitations and Future Directions
Despite the promise of the methods described in this study,
there remain many challenges for using internet news platforms
Acknowledgments
The authors would like to thank the REDCap support team, part of Research Technologies at IU, especially Andrew Arenson,
for their assistance with configuring our REDCap surveys as well as their support with data management. We further acknowledge
the Regenstrief Institute, Inc for its support of this nonfunded research project during the pandemic and the assistance provided
by Megan Hall and Cindi Hart, RN, in creating the REDCap surveys. From the Microsoft team, we thank Jeri Condit, Dr Ahmed
https://www.jmir.org/2021/5/e24742 J Med Internet Res 2021 | vol. 23 | iss. 5 | e24742 | p. 11
(page number not for citation purposes)
XSL• FO
RenderXJOURNAL OF MEDICAL INTERNET RESEARCH Dixon et al
Elshafei, and Carmen O’Toole for their support in developing and implementing the survey. We also appreciate the support of
Fred Cate, Vice President of Research at IU.
Authors' Contributions
The study was conceived by authors BD, MG, and SG. The coauthors SM, JF, and AW contributed significantly to the acquisition,
analysis, and interpretation of data as well as the rigor of the methodology and analysis. The primary author BD drafted the
manuscript, and all coauthors significantly contributed to revising the manuscript. All authors reviewed and approved the final
version of the manuscript.
Conflicts of Interest
MLG, SM, and JMLF are employees of the Microsoft Corporation. The other authors have no conflicts to declare.
Multimedia Appendix 1
Distribution of responses by US state and county.
[DOCX File , 300 KB-Multimedia Appendix 1]
Multimedia Appendix 2
Correlations of individuals meeting phenotype definitions with existing surveillance metrics.
[DOCX File , 132 KB-Multimedia Appendix 2]
References
1. Coronavirus disease (COVID-19) pandemic. World Health Organization. URL: https://www.who.int/emergencies/diseases/
novel-coronavirus-2019 [accessed 2021-04-29]
2. Adeline S, Hanzhang JC, Hurt A, Wilburn T, Wood D, Talbot R. Tracking coronavirus around the US: See how your state
is doing. NPR. URL: https://www.npr.org/sections/health-shots/2020/03/16/816707182/
map-tracking-the-spread-of-the-coronavirus-in-the-u-s [accessed 2021-04-29]
3. Menachemi N, Yiannoutsos CT, Dixon BE, Duszynski TJ, Fadel WF, Wools-Kaloustian KK, et al. Population point
prevalence of SARS-CoV-2 infection based on a statewide random sample - Indiana, April 25-29, 2020. MMWR Morb
Mortal Wkly Rep 2020 Jul 24;69(29):960-964 [FREE Full text] [doi: 10.15585/mmwr.mm6929e1] [Medline: 32701938]
4. Lavezzo E, Franchin E, Ciavarella C, Cuomo-Dannenburg G, Barzon L, Del Vecchio C, Imperial College COVID-19
Response Team, Imperial College COVID-19 Response Team. Suppression of a SARS-CoV-2 outbreak in the Italian
municipality of Vo'. Nature 2020 Aug;584(7821):425-429. [doi: 10.1038/s41586-020-2488-1] [Medline: 32604404]
5. Mavragani A. Infodemiology and infoveillance: Scoping review. J Med Internet Res 2020 Apr 28;22(4):e16206 [FREE
Full text] [doi: 10.2196/16206] [Medline: 32310818]
6. Eysenbach G. Infodemiology and infoveillance: Framework for an emerging set of public health informatics methods to
analyze search, communication and publication behavior on the internet. J Med Internet Res 2009 Mar 27;11(1):e11 [FREE
Full text] [doi: 10.2196/jmir.1157] [Medline: 19329408]
7. Denis F, Galmiche S, Dinh A, Fontanet A, Scherpereel A, Benezit F, et al. Epidemiological observations on the association
between anosmia and COVID-19 infection: Analysis of data from a self-assessment web application. J Med Internet Res
2020 Jun 11;22(6):e19855 [FREE Full text] [doi: 10.2196/19855] [Medline: 32496206]
8. Luo H, Lie Y, Prinzen FW. Surveillance of COVID-19 in the general population using an online questionnaire: Report
from 18,161 respondents in China. JMIR Public Health Surveill 2020 Apr 27;6(2):e18576 [FREE Full text] [doi:
10.2196/18576] [Medline: 32319956]
9. Shen C, Chen A, Luo C, Zhang J, Feng B, Liao W. Using reports of symptoms and diagnoses on social media to predict
COVID-19 case counts in mainland China: Observational infoveillance study. J Med Internet Res 2020 May 28;22(5):e19421
[FREE Full text] [doi: 10.2196/19421] [Medline: 32452804]
10. Mackey T, Purushothaman V, Li J, Shah N, Nali M, Bardier C, et al. Machine learning to detect self-reporting of symptoms,
testing access, and recovery associated with COVID-19 on Twitter: Retrospective big data infoveillance study. JMIR Public
Health Surveill 2020 Jun 08;6(2):e19509 [FREE Full text] [doi: 10.2196/19509] [Medline: 32490846]
11. Timmers T, Janssen L, Stohr J, Murk JL, Berrevoets MAH. Using eHealth to support COVID-19 education, self-assessment,
and symptom monitoring in the Netherlands: Observational study. JMIR Mhealth Uhealth 2020 Jun 23;8(6):e19822 [FREE
Full text] [doi: 10.2196/19822] [Medline: 32516750]
12. Yamamoto K, Takahashi T, Urasaki M, Nagayasu Y, Shimamoto T, Tateyama Y, et al. Health observation app for COVID-19
symptom tracking integrated with personal health records: Proof of concept and practical use study. JMIR Mhealth Uhealth
2020 Jul 06;8(7):e19902 [FREE Full text] [doi: 10.2196/19902] [Medline: 32568728]
https://www.jmir.org/2021/5/e24742 J Med Internet Res 2021 | vol. 23 | iss. 5 | e24742 | p. 12
(page number not for citation purposes)
XSL• FO
RenderXJOURNAL OF MEDICAL INTERNET RESEARCH Dixon et al
13. Ming LC, Untong N, Aliudin NA, Osili N, Kifli N, Tan CS, et al. Mobile health apps on COVID-19 launched in the early
days of the pandemic: Content analysis and review. JMIR Mhealth Uhealth 2020 Sep 16;8(9):e19796 [FREE Full text]
[doi: 10.2196/19796] [Medline: 32609622]
14. Rovetta A, Bhagavathula AS. COVID-19-related web search behaviors and infodemic attitudes in Italy: Infodemiological
study. JMIR Public Health Surveill 2020 May 05;6(2):e19374 [FREE Full text] [doi: 10.2196/19374] [Medline: 32338613]
15. Symptoms of COVID-19. US Centers for Disease Control and Prevention. URL: https://www.cdc.gov/coronavirus/2019-ncov/
symptoms-testing/symptoms.html [accessed 2021-04-29]
16. Yang J, Zheng Y, Gou X, Pu K, Chen Z, Guo Q, et al. Prevalence of comorbidities and its effects in patients infected with
SARS-CoV-2: A systematic review and meta-analysis. Int J Infect Dis 2020 May;94:91-95 [FREE Full text] [doi:
10.1016/j.ijid.2020.03.017] [Medline: 32173574]
17. Pascarella G, Strumia A, Piliego C, Bruno F, Del Buono R, Costa F, et al. COVID-19 diagnosis and management: A
comprehensive review. J Intern Med 2020 Aug;288(2):192-206 [FREE Full text] [doi: 10.1111/joim.13091] [Medline:
32348588]
18. Lechien JR, Chiesa-Estomba CM, De Siati DR, Horoi M, Le Bon SD, Rodriguez A, et al. Olfactory and gustatory dysfunctions
as a clinical presentation of mild-to-moderate forms of the coronavirus disease (COVID-19): A multicenter European study.
Eur Arch Otorhinolaryngol 2020 Aug;277(8):2251-2261 [FREE Full text] [doi: 10.1007/s00405-020-05965-1] [Medline:
32253535]
19. Microsoft News. URL: https://www.microsoft.com/en-us/microsoftnews [accessed 2021-04-29]
20. Pervasive Technology Institute, Indiana University. URL: https://pti.iu.edu/ [accessed 2021-04-29]
21. Harris PA, Taylor R, Minor BL, Elliott V, Fernandez M, O'Neal L, REDCap Consortium. The REDCap consortium: Building
an international community of software platform partners. J Biomed Inform 2019 Jul;95:103208. [doi:
10.1016/j.jbi.2019.103208] [Medline: 31078660]
22. Harris PA, Taylor R, Thielke R, Payne J, Gonzalez N, Conde JG. Research electronic data capture (REDCap)--A
metadata-driven methodology and workflow process for providing translational research informatics support. J Biomed
Inform 2009 Apr;42(2):377-381. [doi: 10.1016/j.jbi.2008.08.010] [Medline: 18929686]
23. Arenson A, Mullen J. The REDCap-ETL external module. In: Proceedings of the 2019 REDCap Conference. 2019 Presented
at: 2019 REDCap Conference; September 16-19, 2019; Vancouver, BC URL: http://hdl.handle.net/2022/24650
24. Arenson A, Mullen J. REDCap-ETL Gateway: Using a supercomputer to run REDCap-ETL. In: Proceedings of the 2019
REDCap Conference. 2019 Presented at: 2019 REDCap Conference; September 16-19, 2019; Vancouver, BC URL: http:/
/hdl.handle.net/2022/24649
25. Chow EJ, Schwartz NG, Tobolowsky FA, Zacks RLT, Huntington-Frazier M, Reddy SC, et al. Symptom screening at
illness onset of health care personnel with SARS-CoV-2 infection in King County, Washington. JAMA 2020 May
26;323(20):2087-2089 [FREE Full text] [doi: 10.1001/jama.2020.6637] [Medline: 32301962]
26. Dixon BE, Wools-Kaloustian K, Fadel WF, Duszynski TJ, Yiannoutsos C, Halverson PK, et al. Symptoms and symptom
clusters associated with SARS-CoV-2 infection in community-based populations: Results from a statewide epidemiological
study. PLoS One 2021;16(3):e0241875 [FREE Full text] [doi: 10.1371/journal.pone.0241875] [Medline: 33760821]
27. Data API. The COVID Tracking Project. URL: https://covidtracking.com/data/api [accessed 2021-04-29]
28. Roser M, Ritchie H, Ortiz-Ospina E, Hasell J. Coronavirus pandemic (COVID-19). Our World in Data. 2020. URL: https:/
/ourworldindata.org/coronavirus [accessed 2021-04-29]
29. Menni C, Valdes AM, Freidin MB, Sudre CH, Nguyen LH, Drew DA, et al. Real-time tracking of self-reported symptoms
to predict potential COVID-19. Nat Med 2020 Jul;26(7):1037-1040 [FREE Full text] [doi: 10.1038/s41591-020-0916-2]
[Medline: 32393804]
30. Dixon BE, Caine VA, Halverson PK. Deficient response to COVID-19 makes the case for evolving the public health system.
Am J Prev Med 2020 Dec;59(6):887-891 [FREE Full text] [doi: 10.1016/j.amepre.2020.07.024] [Medline: 32978011]
Abbreviations
ETL: extract, transform, load
IU: Indiana University
PT: Pacific Time
REDCap: Research Electronic Data Capture
WHO: World Health Organization
https://www.jmir.org/2021/5/e24742 J Med Internet Res 2021 | vol. 23 | iss. 5 | e24742 | p. 13
(page number not for citation purposes)
XSL• FO
RenderXJOURNAL OF MEDICAL INTERNET RESEARCH Dixon et al
Edited by G Eysenbach; submitted 05.10.20; peer-reviewed by H Luo, A Chen; comments to author 10.11.20; revised version received
14.12.20; accepted 14.04.21; published 20.05.21
Please cite as:
Dixon BE, Mukherjee S, Wiensch A, Gray ML, Ferres JML, Grannis SJ
Capturing COVID-19–Like Symptoms at Scale Using Banner Ads on an Online News Platform: Pilot Survey Study
J Med Internet Res 2021;23(5):e24742
URL: https://www.jmir.org/2021/5/e24742
doi: 10.2196/24742
PMID: 33872190
©Brian E Dixon, Sumit Mukherjee, Ashley Wiensch, Mary L Gray, Juan M Lavista Ferres, Shaun J Grannis. Originally published
in the Journal of Medical Internet Research (https://www.jmir.org), 20.05.2021. This is an open-access article distributed under
the terms of the Creative Commons Attribution License (https://creativecommons.org/licenses/by/4.0/), which permits unrestricted
use, distribution, and reproduction in any medium, provided the original work, first published in the Journal of Medical Internet
Research, is properly cited. The complete bibliographic information, a link to the original publication on https://www.jmir.org/,
as well as this copyright and license information must be included.
https://www.jmir.org/2021/5/e24742 J Med Internet Res 2021 | vol. 23 | iss. 5 | e24742 | p. 14
(page number not for citation purposes)
XSL• FO
RenderXYou can also read