Business Update February 26, 2021 - Edison International
←
→
Page content transcription
If your browser does not render page correctly, please read the page content below

Business Update February 26, 2021
Forward-Looking Statements
Statements contained in this presentation about future performance, including, without limitation, operating results, capital expenditures, rate base growth, dividend policy,
financial outlook, and other statements that are not purely historical, are forward-looking statements. These forward-looking statements reflect our current expectations;
however, such statements involve risks and uncertainties. Actual results could differ materially from current expectations. These forward-looking statements represent our
expectations only as of the date of this presentation, and Edison International assumes no duty to update them to reflect new information, events or circumstances. Important
factors that could cause different results include, but are not limited to the:
•   ability of SCE to recover its costs through regulated rates, including uninsured wildfire-related and debris flow-related costs, costs incurred to mitigate the risk of utility
    equipment causing future wildfires, costs incurred to implement SCE's new customer service system and costs incurred as a result of the COVID-19 pandemic;
•   ability of SCE to implement its Wildfire Mitigation Plan;
•   risks of regulatory or legislative restrictions that would limit SCE’s ability to implement Public Safety Power Shutoff (“PSPS”) when conditions warrant or would otherwise
    limit SCE’s operational PSPS practices;
•   risks associated with implementing PSPS, including regulatory fines and penalties, claims for damages and reputational harm;
•   ability of SCE to maintain a valid safety certification;
•   ability to obtain sufficient insurance at a reasonable cost, including insurance relating to SCE's nuclear facilities and wildfire-related claims, and to recover the costs of such
    insurance or, in the event liabilities exceed insured amounts, the ability to recover uninsured losses from customers or other parties;
•   extreme weather-related incidents (including events caused, or exacerbated, by climate change, such as wildfires, debris flows, high wind events and extreme heat events)
    and other natural disasters (such as earthquakes), which could cause, among other things, public safety issues, property damage, operational issues (such as rotating
    outages and issues due to damaged infrastructure), PSPS activations and unanticipated costs;
•   risks associated with California Assembly Bill 1054 (“AB 1054”) effectively mitigating the significant risk faced by California investor-owned utilities related to liability for
    damages arising from catastrophic wildfires where utility facilities are alleged to be a substantial cause, including the longevity of the Wildfire Insurance Fund and the
    CPUC's interpretation of and actions under AB 1054, including its interpretation of the new prudency standard established under AB 1054;
•   decisions and other actions by the California Public Utilities Commission, the Federal Energy Regulatory Commission, the Nuclear Regulatory Commission and other
    governmental authorities, including decisions and actions related to nationwide or statewide crisis, determinations of authorized rates of return or return on equity, the
    recoverability of wildfire-related and debris-flow-related costs, issuance of SCE's wildfire safety certification, wildfire mitigation efforts, and delays in executive, regulatory
    and legislative actions;
•   ability of Edison International or SCE to borrow funds and access bank and capital markets on reasonable terms;
•   risks associated with the decommissioning of San Onofre, including those related to worker and public safety, public opposition, permitting, governmental approvals, on-
    site storage of spent nuclear fuel, delays, contractual disputes, and cost overruns;
•   pandemics, such as COVID-19, and other events that cause regional, statewide, national or global disruption, which could impact, among other things, Edison
    International's and SCE's business, operations, cash flows, liquidity and/or financial results and cause Edison International and SCE to incur unanticipated costs;
•   physical security of Edison International's and SCE's critical assets and personnel and the cybersecurity of Edison International's and SCE's critical information technology
    systems for grid control, and business, employee and customer data;
•   risks associated with cost allocation resulting in higher rates for utility bundled service customers because of possible customer bypass or departure for other electricity
    providers such as Community Choice Aggregators (“CCA,” which are cities, counties, and certain other public agencies with the authority to generate and/or purchase
    electricity for their local residents and businesses) and Electric Service Providers (entities that offer electric power and ancillary services to retail customers, other than
    electrical corporations (like SCE) and CCAs);
•   risks inherent in SCE's transmission and distribution infrastructure investment program, including those related to project site identification, public opposition,
    environmental mitigation, construction, permitting, power curtailment costs (payments due under power contracts in the event there is insufficient transmission to enable
    acceptance of power delivery), changes in the California Independent System Operator’s transmission plans, and governmental approvals; and
•   risks associated with the operation of transmission and distribution assets and power generating facilities, including worker and public safety issues, the risk of utility assets
    causing or contributing to wildfires, failure, availability, efficiency, and output of equipment and facilities, and availability and cost of spare parts.
Other important factors are discussed under the headings “Forward-Looking Statements”, “Risk Factors” and “Management’s Discussion and Analysis” in Edison International’s
Form 10-K and other reports filed with the Securities and Exchange Commission, which are available on our website: www.edisoninvestor.com. These filings also provide
additional information on historical and other factual data contained in this presentation.

February 26, 2021                                                                                                                                                                         1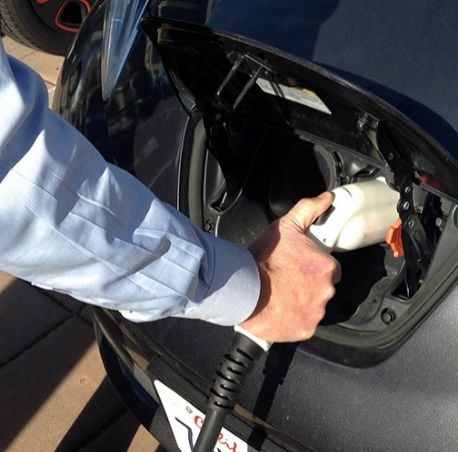
Edison International is leading the transformation of the
electric power industry

                    Holding company focused on opportunities in clean energy,
                    efficient electrification, grid of the future, and customer choice

                    One of the nation’s largest electric-only utilities, serving over
                    15 million residents

                    EIX’s principal subsidiary, with ~$5 billion annual electric
                    infrastructure investment opportunity

                    Growth driven by investment in modernizing the grid and
                    advancing California’s ambitious low carbon objectives

                    Wires-focused rate base of ~$36 billion, with limited
                    ownership of power generation capacity (
Sustainability is central to Edison’s vision to lead the
transformation of the electric power industry
                 We have made long-term, public commitments related to
       clean energy, transportation electrification, diversity and inclusion, and safety1
Environmental                                               Social                                                    Governance
Targeting 100% carbon-free                                  Swift COVID-19 response as                                Highest level governance scores
power delivered by 2045; ~43%                               essential services provider                               from ISS and Moody’s
carbon-free power in 20202
                                                            $5 billion annually in safe,                              Board oversight of ESG risks
Over $800 million in approved                               reliable, clean energy grid3,5                            such as safety, climate change
funding to expand                                                                                                     impacts, and cybersecurity
transportation electrification3                             Long-standing community
                                                                                                                      7 of 11 directors diverse by
                                                            partnerships, including $2.2B
                                                                                                                      gender, race/ethnicity, and
Named leader in solar for 12th                              spend with diverse suppliers1,3
                                                                                                                      LGBTQ identification, including
year and #1 utility nationally in                                                                                     four women
                                                            Publish transparent data on
energy storage for 2nd year3,4
                                                            workforce, supplier, and                                  50% of executive annual
                                                            community investment diversity                            incentive pay tied to safety-
Committing to vehicle fleet
electrification goals by 20303                                                                                        related metrics for 2021
                                                            Committed to gender parity in
                                                            senior roles by 2030 and                                  10 of 11 directors are
                                                            broader DEI actions                                       independent, including chair
1.   We publish detailed information on our Sustainability site found here: https://www.edison.com/home/investors/sustainability.html
2.   Percentages refer to power delivered to SCE customers. Reflects no coal generation of delivered electricity
3.   Refers to SCE only
4.   Based on Smart Electric Power Alliance (SEPA) rankings published in 2019, which can be found here: https://sepapower.org/2019-top-10-winners/
5.   Subject to regulatory approval

February 26, 2021                                                                                                                                       3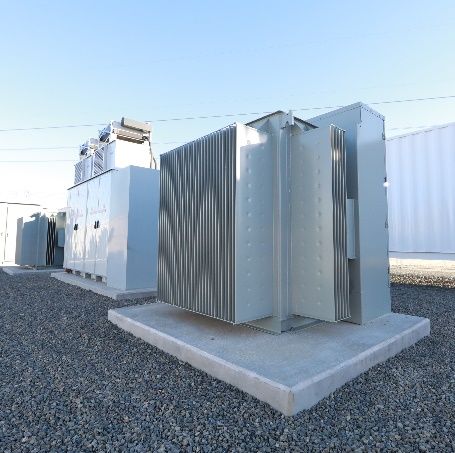
Investment thesis: Strong alignment between California’s
clean energy goals and EIX’s business drivers

                                                       Decoupling of sales
                    Constructive California and        Forward-looking ratemaking
                    Federal regulatory structures      Premium California ROE
                                                       Wildfire prudency standard

                    Aggressive climate goals met       California GHG reduction
                    with clean, efficient, economy-    Helping customers make
                    wide electrification               clean energy choices

                                                       Address wildfire risk
                    Significant investment required    Infrastructure replacement
                    to strengthen and modernize
                                                       Grid modernization
                    the electric grid
                                                       Electrification infrastructure
                                                       6.7–7.6% average annual rate
                    Investment in electric-led clean   base growth through 2023
                    energy future results in strong
                    rate base and dividend growth      Target dividend payout of
                                                       45–55% of SCE earnings
February 26, 2021                                                                       4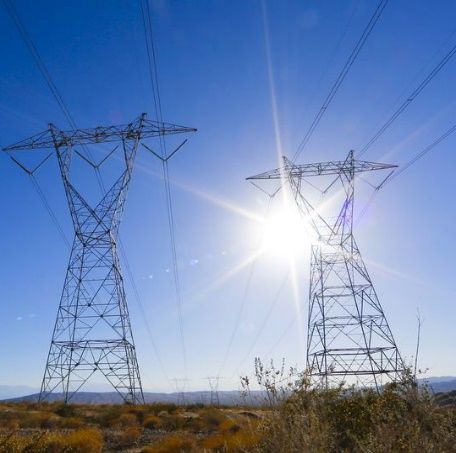
California’s regulatory mechanisms provide revenue certainty,
even as load and payment patterns change

 Revenue Decoupling Long-standing regulatory mechanism that breaks the link between retail
     means earnings aren’t electricity sales and revenue; promotes energy efficiency, helps stabilize
     affected by changes in customer bills, and supports environmental goals
             electricity sales
                               Changes in sales only affect timing of cash collection

   Balancing Accounts SCE has several balancing accounts, including one for variances in sales
   allow SCE to collect and volume, such as those related to COVID-19
       refund differences to
         authorized revenue Balancing account established for residential uncollectibles

      COVID-19 Related CPUC approved COVID-19 Pandemic Protections Memo Account
       Memo Accounts (CPPMA) where SCE will track non-payment and non-recovery of billed
  allow SCE to track cost amounts for residential and small business customers
                                                                               1

and payment changes for
                          COVID-19 related costs will record to Catastrophic Event Memo Account
  cost recovery requests
                                              Both require seeking approval to recover costs recorded to them

1. Residential bad debt expense records to the Residential Uncollectibles Balancing Account (RUBA) and not the CPPMA

February 26, 2021                                                                                                      5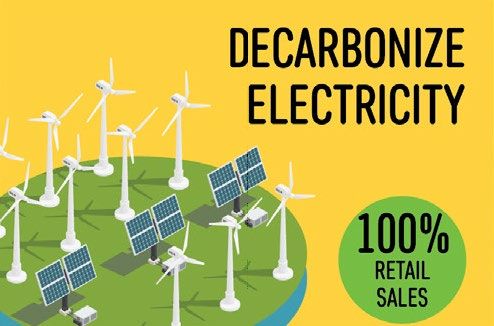
Reaching California’s 2045 GHG goals requires a near-
complete transformation of energy use economy wide

“Adaptation to climate change must begin in earnest — which SCE is doing in part with our grid hardening,
   situational awareness, and operational changes — but we must act on longer term solutions as well.”
                               – Pedro Pizarro, CEO of Edison International
Pathway 2045: Key steps California must take to reach carbon neutrality
                       100% of grid sales with                                76% of light-duty vehicles
                       carbon-free electricity                                need to be electric
                       80 GW of utility-scale clean                           67% of medium-duty vehicles
                       generation                                             need to be electric
                       30 GW of utility-scale energy                          38% of heavy-duty vehicles
                       storage                                                need to be electric

                       30% of space and water                                 Until there is an alternative,
                       heating to be electrified by                           natural gas generation
                       2030                                                   capacity provides a crucial
                                                                              role for reliability and
                       70% of space and water
                                                                              affordability, but declining by
                       heating to be electrified by
                                                                              50% by 2045
                       2045
                                                                              40% of natural gas that
                       Building electrification will
                                                                              remains will be decarbonized
                       increase load significantly by
                                                                              through the addition of
                       2045—representing 15% of
                                                                              biomethane and hydrogen
                       the total load

February 26, 2021                                                                                               6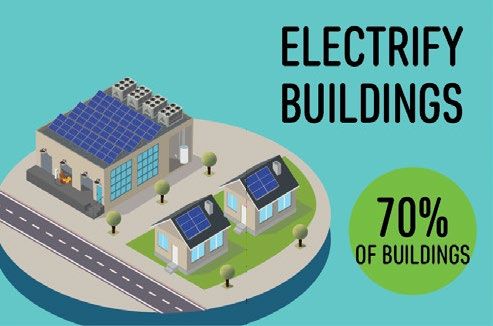
SCE is a catalyst for achieving California’s aggressive GHG
and clean energy goals via economy-wide electrification

Achieving 80% GHG reduction by 2050 will require fuel                                                     SCE delivered ~43% carbon-free
use changes in all sectors                                                                                electricity to customers in 2020
State Carbon Emissions Reduction Pathway
California GHG Emissions, Annual million metric tons (MMT)                                                Decarbonizing transportation
                                                                                                          sector, ~40% of GHG emissions,
                                                                                                          requires widespread vehicle
400
         Electricity                                                                                      electrification

                                                                                                          State’s commitment highlighted by
300                                             40% by 2030
                                                (260 MMT)                                                 requiring all new passenger
                                                                                                          vehicles sold to be zero-emission
                                                                                                          by 2035 and operations of MD/HD
200      Transportation                                                 Carbon Neutrality
                                                                                                          vehicles2 be zero-emission by 2045
                                                                        by 2045
                                                                        (108 MMT)
                                                                                       80% by 2050        Electricity required to be 100%
         Industrial                                                                    (86 MMT)
100                                                                                                       carbon-free by 2045

                                                                                                          Electrification of buildings and
         Buildings and Other1
    –                                                                                                     industrial processes also a key
     2015         2020        2025         2030         2035        2040         2045        2050         factor
1. Buildings and Other includes residential, commercial, and agriculture
2. Medium- and heavy-duty (MD/HD) vehicles shall be 100% zero-emission by 2045 where feasible, with the mandate going into effect by 2035 for drayage trucks
Source: SCE’s Pathway 2045 analysis

February 26, 2021                                                                                                                                              7
A decarbonized, electrified world produces energy savings
for an average household

Total energy cost for an average household decreases                                                      By 2045, a greater reliance on
by about one-third by 2045                                                                                electricity, combined with
Annual residential household energy costs (2019$)1
                                                                                                          population and economic growth,
                                $4,550                                                                    will result in a 60% increase in
   Home Solar                                                                                             electricity sales from the grid
Electricity Bill
                                                                                                          Household savings driven by
Home Gas Bill
                                                                         $3,130                           reduced gasoline consumption
                                                                                                          due to high market penetration of
                                                                                                          electric vehicles

        Gasoline                                                                                          Improvements in equipment
                                                                                                          efficiency, energy efficiency, and
                                                                                                          demand response programs
                                                                                                          further reduce consumption

                                 2019                                      2045
1. Reflects annual energy costs using SCE data and does not account for the cost of equipment. Electricity bill based on delivery and generation charges for weighted average
   of CARE (California Alternate Rates for Energy) and non-CARE customers. Gas prices reflect declining residential gas consumption impact on remaining customers. Utility
   and transportation fuel costs in 2019 dollars. Average customer in 2045 would have electric vehicle, solar, and electric water and space heating
Source: SCE’s Pathway 2045 analysis

February 26, 2021                                                                                                                                                               8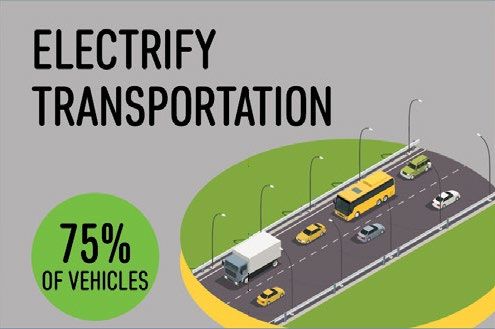
Significant incremental grid investments required by 2045 to
serve load growth and integrate renewables and storage
At least a third of incremental grid investment fits                                                      CAISO-wide investment required at
squarely within IOU jurisdictions                                                                         various voltage levels and to address
CAISO-wide grid investment under Pathway 2045 Balanced Scenario                                           specific system needs
             ~$75 billion
                   (2019$)                                                                                Upgrades at lower voltages are
                                                                                                          clearly utility-owned; transmission
                                                                                                          projects may be competitively bid
                                               Infrastructure to interconnect
            Transmission for                   and integrate resources
              Out-of-State                                                                                Potential additional utility investment
                Imports                        May be mix of investment by                                upside from storage
                                               utilities, generators, and other                                   – Pathway 2045 analysis showed
                                               market participants                                                  ~$54 billion1 need for battery
         ISO Interconnections
                                                                                                                    storage CAISO-wide
              Local Capacity
                                               Utility infrastructure additions                                   – May be opportunity where
            Subtransmission                    and upgrades                                                         utilities are natural owners
                                               Predominantly investments by                               SCE continues to refine estimates,
               Distribution
                                               utilities in their service areas
                                                                                                          evaluate required future capabilities
       CAISO Grid Investment                                                                              and technologies, and develop
            2031–2045                                                                                     roadmap for achieving 2045 goals2
1. In 2019 dollars under Balanced Scenario
2. See SCE’s Reimagining the Grid white paper for additional information
Source: SCE’s Pathway 2045 analysis. See Pathway 2045 Appendices for additional information on the analysis and its methodology

February 26, 2021                                                                                                                                    9
Foundational strategy for mitigating wildfire risk continues;
increased focus on risk-prioritization and customer impacts
2020–2022 Wildfire Mitigation Plan1
Hardening Covered ~4,000 circuit miles by end of 2022
the Grid Conductor 2020: 965 | 2021: 1,000-1,400 | 2022: 1,600
Undergrounding Considering ~17 miles of undergrounding
Enhanced Inspections Risk-informed ground & aerial inspection program
Operational covering ~50% of HFRA structures annually; option for
Practices additional inspections for potential areas of concern
Vegetation Continue expanded line clearances; focus on hazard tree
Management assessments and timely removal; expand brush clearing
at base of poles to 200,000–300,000 per year
Public Safety De-energization based on circuit-specific wind speed
Power Shutoff thresholds, with new circuit-specific mitigation plans and
(PSPS) customer care programs to reduce customer impacts
Situational Weather Stations 375–475 weather stations per year
Awareness Deployment complete as coverage in high fire risk areas
HD Cameras
effectively maximized
1. Cost recovery above GS&RP settlement is subject to CPUC approval
February 26, 2021 10SCE is exceeding many benchmarks established in its
2020–2022 Wildfire Mitigation Plan to reduce wildfire risk1
Miles of covered conductor installed since 2018,
1,400+ accounting for ~15% of lines in SCE’s high fire risk areas;
plan to install ~6,000 miles by end of 2023
Cameras installed provide visual coverage of >90% of SCE’s
166 high fire risk areas, reaching practical saturation point2
Click here to view in real-time: Fire Alert Cameras
1,000+ Weather stations installed by the end of 20203
Click here to view in real-time: Weather Stations
Enhanced inspections of distribution and transmission
650,000+ lines to address wildfire risks since end of 2018
Fuses and remote-controlled sectionalizing devices
12,900+ applied to interrupt electrical current more quickly and
boost reliability by segmenting circuits to isolate problems
1. Data as of December 31, 2020
2. Cameras stream live images on the ALERT Wildfire network can be found here: http://www.alertwildfire.org/orangecoca/index.html
3. Links to weather station data and the Santa Ana Wildfire Threat Index can be found here: https://www.sce.com/wildfire/fire-weather
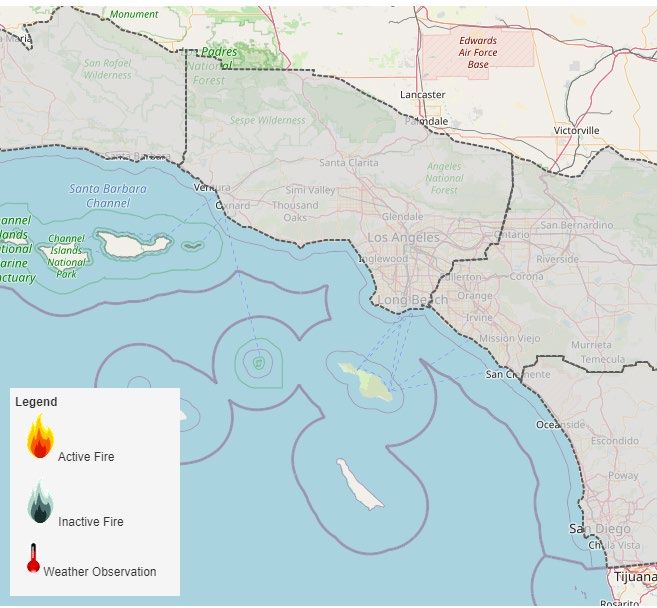
February 26, 2021 11SCE’s publicly available real-time data enhances situational
awareness and informs critical operational decisions
Cameras on ALERT Wildfire Threat Index Emergency Operations
Wildfire Network HD Weather Stations Predictive Model Center (EOC)
Live HD camera feeds Provide real-time weather Helps fire agencies and the SCE’s Emergency Operations
provide critical information data, including wind speed public prepare for a wildfire Center acts as the
to fire agencies for and gust, temperature, and threat during a high wind company’s nerve center for
effectively deploying air humidity event 24/7 planning and
and ground resources emergency response
Enables circuit-level Users can see this
monitoring to inform information in real-time to
critical operational decisions help understand threat of
wind-driven wildfires
RELATED LINKS FOR VIEWING
Cameras Weather Stations Threat Index EOC Virtual Tour
February 26, 2021 12SCE has strong rate base growth driven by significant electric
infrastructure investment opportunities
SCE forecasts deploying significant capital in …resulting in strong rate base growth over
2021–2023… two rate case cycles
Capital Expenditures, $ in Billions Rate Base2,3, $ in Billions
~$16 billion 7.6%
2021–2023 CAGR 41.1
38.4
5.5 5.5 5.4 36.3
5.3 33.8
Wildfire1 30.8
28.5
Generation
Transmission
Distribution
2020 2021 2022 2023 Range 2018 2019 2020 2021 2022 2023 CAGR
Range Case4 (Actual) 5.4 4.6 4.7 Case4 36.2 37.6 39.5 6.7%
1. In accordance with Assembly Bill (AB) 1054, ~$1.6 billion of wildfire mitigation-related spend shall not earn an equity return
2. Morongo Transmission holds an option to invest up to $400 million in the West of Devers Transmission Project at the in-service date, estimated to be 2021. In the chart,
rate base has been reduced to reflect this option. Capital forecast includes 100% of the project spend
3. Weighted-average year basis. Excludes rate base associated with ~$1.6 billion of capital referred to in footnote 1 and projects or programs not yet approved
4. For 2021–2023 capital, reflects a 10% reduction of the total capital forecast over the 3-year GRC cycle using management judgment based on experience of previously
authorized amounts and potential for permitting delays and other operational considerations. For rate base, range case reflects capital expenditure forecast range case
February 26, 2021 13SCE’s long-term growth drivers are highly aligned with
California’s public policy goals
Overarching Goals SCE Growth Drivers
Sustained investment required to reach
Infrastructure
and maintain equilibrium replacement
Safe, Reliable, and Replacement
rate
Affordable
Electricity Service Significant investment in infrastructure
Wildfire
and practices that mitigate wildfire risk,
Mitigation
and bolster prevention and response
Accelerate the adoption and
Grid
integration of renewables and other
Modernization
distributed energy resources
Electrification of Investments to support electrification
Transportation of light-, medium-, and heavy-duty
Decarbonization and Other Sectors vehicles and other sectors
of California
Energy storage essential to increasing
Energy Storage
carbon-free generation
Future needs to meet renewables and
Transmission clean energy mandates driven by
CAISO planning process
February 26, 2021 14EIX has a strong track record of meeting or exceeding EPS
guidance and growing its dividend
EIX has consistently met or
exceeded Core EPS guidance… …and has 17 consecutive years of dividend growth2
Core EPS Relative to Guidance Range Dividends per Share (in Dollars)
2004 Exceeded
2005 Exceeded
2.65
2006 Exceeded
2007 Exceeded
2008 In-line 7.3%
2009 Exceeded CAGR
2010 In-line
2011 Exceeded
2012 N/A1
2013 Exceeded
2014 Exceeded
0.80
2015 Exceeded
2016 In-line
2017 Exceeded
2018 N/A1
2019 In-line
2020 In-line 2004 2021
1. EPS guidance was not provided in 2012 or 2018 because of the timing of final decisions in SCE’s 2012 and 2018 General Rate Cases, respectively
2. 2021 dividend annualized based on December 10, 2020 declaration
February 26, 2021 15EIX and SCE are committed to maintaining their investment
grade credit ratings
Long-term Issuer Rating and Outlook1 Investment grade ratings at SCE and EIX,
As of February 25, 2021 targeting EIX long-term FFO-to-Debt ratio
SCE EIX of 15–17%
Moody’s Baa2 Baa3 Total liquidity of $5.4 billion2
Stable Stable
Debt maturities in 2021:
S&P BBB BBB – SCE: ~$1 billion
Negative Negative – EIX: None
Credit strengths include3:
Fitch BBB- BBB-
– Stable, regulated T&D operations
Stable Stable
– Extensive cost recovery mechanisms
– Credit supportive measures under
AB 1054
– Wildfire mitigation investments
1. During the third quarter of 2020, S&P revised its rating outlooks for all three investor-owned utilities in California to negative due to unprecedented wildfire activity
throughout California in August and September 2020. EIX and SCE's ratings outlooks from Moody's and Fitch have remained stable, despite 2020 wildfire activity due to
the reduced financial risk that wildfires pose to SCE following enactment of AB 1054
2. As of December 31, 2020, $1.4 billion at EIX and $4.0 billion at SCE
3. As described by S&P in its report dated July 7, 2020, and Moody’s in its reports dated April 2, 2020, and October 20, 2020
February 26, 2021 162017/2018 Wildfire/Mudslide Events Update
Remaining expected potential losses Resolved approximately 2/3rds of best estimate
$ in Billions Settlement progress as a proportion of best estimate
Best estimate of potential losses 6.2
Resolved
Settlement progress: claims Remaining
34% alleged and
Local Public Entities (0.4) potential claims
(4Q 2019) 66%
TKM1 Subrogation Plaintiffs2 (1.2)
(3Q 2020)
Individual Plaintiffs (0.4)
(Through February 18, 2021)
Settlement program and bellwether trial dates
Woolsey Subrogation Plaintiffs3 (2.2)
(1Q 2021)
• For TKM, established settlement program
providing for efficient and orderly process to
Loss estimate balance at Feb. 18, 2021 2.1 pursue settlement of individual plaintiff claims4
• Insurance expected to be exhausted after – Court may continue to defer trial date if
recoveries for Woolsey Subro. Settlement sufficient settlement progress made
• SCE will seek CPUC recovery of prudently- • Thomas bellwether trial5 July 19, 2021
incurred, actual losses in excess of insurance • Woolsey bellwether trial5 June 1, 2021
1. Thomas Fire, Koenigstein Fire, and Montecito Mudslides
2. Under the terms of the TKM Subrogation Settlement, SCE paid the TKM Subrogation Plaintiffs an aggregate of $1.2 billion in October 2020, and also agreed to pay $0.555
for each dollar in claims to be paid by the TKM Subrogation Plaintiffs to their policy holders on or before July 15, 2023, up to an agreed upon cap
3. Under the terms of the Woolsey Subrogation Settlement, SCE agreed to pay the Woolsey Subrogation Plaintiffs an aggregate of $2.2 billion by April 22, 2021, and also
agreed to pay $0.67 for each dollar in claims to be paid by the Woolsey Subrogation Plaintiffs to their policy holders on or before July 15, 2023, up to an agreed upon cap
4. Target participating in non-binding mediation or informal negotiations with at least 150 households per month
5. Scheduled dates as of February 18, 2021. Subject to change at discretion of the court
February 26, 2021 17Edison Energy empowers organizations to conquer biggest
challenges in energy today: Cost. Carbon. Complex Choices.
Partners with market leaders to align energy spend with
strategic, financial, and sustainability goals
Provide independent, Using an integrated approach, provides energy solutions for clients
expert advice and designed to achieve the right cost, performance, and sustainability
services outcomes for their organizations
Deliver comprehensive Provides suite of specialized services across sustainability, analytics,
data-driven renewables, supply, and energy optimization
portfolio solutions
Serve large-scale, Clients include 15 of the Fortune 50
global customer base Offices in North America and Europe
Helped customers execute renewable energy agreements totaling
2.2 GW in 2020
Provide insights for Supports Edison International’s clean energy, electrification, and
clean energy efforts sustainability efforts
February 26, 2021 18Appendix
SCE has delivered 7.2% annualized rate base growth since
2015, driven by growing capital investment

Historical Capital Expenditures                                Historical Recorded Rate Base1
$ in Billions                                                  $ in Billions, Weighted-average basis

                             ~$25.9 billion
                              2015–2020                                                7.2%                   33.8
                                                        5.5                            CAGR
                                                                                                       30.8
                                                 4.8                                         28.5
                                                                                    26.6
                                          4.4                              25.1
                                                                  23.9
      3.9                       3.8
                   3.5

     2015        2016         2017        2018   2019   2020      2015     2016     2017    2018       2019   2020

1. Since 2015, rate base excludes SONGS

February 26, 2021                                                                                                    20
The bulk of SCE’s investments are in its distribution system,
consistent with wires-focused strategy
SCE forecasts investing $13.7 billion from 2021 to 2023 in its Investments will upgrade and
distribution system, ~85% of total ~$16 billion capital plan1 modernize World War II-era
$ in Billions infrastructure
Infrastructure Replacement Distribution grid requires
Includes poles, circuit breakers, $4.2 upgrades to support grid
transformers, and relays
resiliency and reliability, and
Wildfire2 increased use of distributed
Includes covered conductor, $3.2
preventative maintenance
energy resources
General Plant Certain programs deferred as
General projects and work $3.2
supporting distribution
resources reallocated to wildfire
mitigation4
Other3
Includes grid mod, transportation $1.9 – Investment level for these
electrification, among others programs will increase
Load Growth beyond 2023 to resume
Upgrades to ensure reliability $0.7 trajectory toward
where system capacity exceeded equilibrium replacement rate
New Service Connections
Dependent on customer growth $0.5
in service territory
1. Forecast based on 2021 GRC rebuttal levels. Numbers may not add due to rounding
2. Excludes overheads
3. Other includes, among other things, grid modernization, transportation electrification programs, emergency management, and customer requested system modifications
4. Deferrals required with infrastructure replacement, load growth, and grid modernization programs
February 26, 2021 21Increased energy storage is essential as we expand the share
of intermittent renewable electricity sources
690 MW SCE exceeded 2020
Already state-mandated
procured or storage target1
installed
SCE estimates that California
will need 10 GW of utility-
1,360 MW Incremental capacity
scale energy storage by
Additional to be online 2021–
battery storage
2023 to meet system 2030 and 30 GW by 2045 to
reliability needs
procured support the transition to
during 20202
100% carbon-free power
2,050 MW Installed or procured
Total storage to-date
capacity
1. SCE exceeded the 580 MW target set by AB 2514
2. 770 MW were approved by the CPUC on August 27, 2020. 590 MW are pending CPUC approval
February 26, 2021 22CPUC cost of capital mechanism current measurement
period is October 1, 2020 through September 30, 2021
CPUC Cost of Capital Adjustment Mechanism
Moody’s Baa Utility Index Rate (%)
6.0
5.5
Mechanism did not trigger
5.0 a change to 2021 ROE
Starting Value – 4.50% because average for Dead-
4.5 band
period was above 3.5%
4.0
3.5 Current Spot Rate1: 3.38%
Current Period Average1: 3.19%
3.0
2.5
Oct. 1, 2019 Apr. 1, 2020 Oct. 1, 2020 Apr. 1, 2021 Oct. 1, 2021
Cost of Capital Mechanism Features CPUC Authorized Cost of Capital
ROE adjustment based on 12-month average of Moody’s Baa Capital
utility bond rates, measured October 1 to September 30 Structure Rate
If index exceeds 100 bps deadband from starting index Common Equity 52% 10.30%
value, authorized ROE changes by half the difference, and
Preferred 5% 5.70%
preferred and long-term debt rates are reset to the latest
forecast values for the following year Long-term Debt 43% 4.74%
SCE required to file its next cost of capital application by Weighted Average Cost of Capital 7.68%
April 2022 for rates effective beginning January 2023
1. As of February 18, 2021
February 26, 2021 23SCE Key Regulatory Proceedings
Proceeding Description and Next Steps
Base 2021 GRC Tracks 1 and 4 Set CPUC base revenue requirement for 2021–2024
Rates (A.19-08-013) Track 1 decision pending. Track 4 to be filed Q2 2022
Wildfire1 2021 GRC Track 3 Incremental 2020 wildfire mitigation costs and GS&RP costs above settled
(A.19-08-013) amounts2. Through Dec. 31, 2020, approximately $680 million capital and
$475 million O&M spent3
Submit testimony Q1 2021
Application for Recovery of Requesting reasonableness review of $139 million in costs and revenue
CEMA costs req. of $88 million for drought-related work and work related to 2017 fires
(A.19-07-021) Proposed decision expected Q3 2021
Insurance WEMA2 Approx. $215 million for wildfire insurance-related costs for July–Dec. 2020
(A.20-12-010) SCE proposed schedule would allow for recovery beginning January 2022
2021 Wildfire Mitigation Update to 2020–2022 WMP outlining continued efforts
Plan Update
Stakeholders submit comments due in March
COVID-19 COVID-19 Pandemic Record non-payment and non-recovery of billed amounts for residential
Protections Memo Account and small business customers and later seek recovery. Proceeding TBD
CEMA for COVID-19 Costs Activated to track COVID-19-related costs since March 2020
1. 2021 GRC track 2 also covered wildfire-related spending. A settlement agreement was approved by the CPUC in January 2021
2. GRC track 3 cost recovery request will not include any revenue requirement associated with 2020 capital expenditures, as those capital expenditures are subject to the AB
1054 exclusion from equity rate base and will be recovered through a separate financing order. Includes Wildfire Mitigation Plan Memo Account, Fire Hazard Prevention
Memo Account, and Fire Risk Mitigation Memo Account, and 2018–2020 GS&RP costs above settlement amount
3. Numbers rounded. Reflects direct capital costs. Includes spending through 2020 and certain costs deferred for review as part of SCE’s GRC track 2 settlement
February 26, 2021 24Recent CPUC approvals improve cash flow; pending decisions
will generate additional cash
$ in Millions
Application
Approval/
Request1 Additional Information
GRC track 2 settlement 391 Settlement approved unmodified; $401 million of
approved in Jan. 2021 O&M and reasonableness of $302 million of capital2
505 CPUC recognized wildfire liability insurance is an
WEMA1 approved in
September 2020 important protection for customers and a normal
utility cost-of-service
GS&RP settlement 159 Approved $476 million capital and $123 million O&M
approved in April 20203
Total Approved Rev. Req. 1,055
Pending
CEMA decision 88 Requests cost recovery related to 2017–2018 drought
expected in Q3 2021 and 2017 firestorms
WEMA2 application 215 Requests cost recovery of July–December 2020
filed in Q4 2020 wildfire insurance premiums4
1. Amounts refer to approvals for GS&RP, WEMA1, and GRC track 2, and applications for CEMA and WEMA2. Total Application/Request refers to revenue requirement
2. Cost recovery in revenue requirement is lower than total O&M and reviewed capital because of flow through tax effects and excluded revenue requirement associated with
AB 1054 Excluded Capital Expenditures
3. Approved amounts found reasonable by the Settlement Agreement. The Settlement Agreement finds reasonable an additional $13 million in O&M that has not yet been
spent as of December 31, 2020. The Application Request of $159 million is the 2018–2020 revenue requirement for amounts found reasonable by the Settlement
Agreement. The revenue requirement for the AB 1054 Capital Expenditures is the subject of a separate Application for Financing Order approved November 2020
4. Request also includes financing costs and memorandum account interest
February 26, 2021 25SCE’s 2021 General Rate Case request balances foundational
work with advancing ambitious State public policy goals
In 2021 GRC, SCE GRC addresses major portion of CPUC-jurisdictional revenue requirement
requests Test Year for 2021–2024, including operating costs and capital investment
revenue requirement – Excludes costs such as fuel and purchased power and other discrete
of ~$7.6 billion , or
1
projects and programs with separate cost recovery applications
12.5% increase – Excludes FERC-jurisdictional transmission revenue requirement
over total rates
Requests increases of $452 million for 2022 and $524 million for 2023
Increase driven by Continuing critical wildfire mitigation activities and appropriate insurance
wildfire mitigation,
Depreciation proposal more closely aligns customer cost responsibility
depreciation, and
normal growth Vast majority of total revenues are central to our core functions
Multi-track schedule Components reviewed and approved in four tracks, including 2018–2020
to approve revenue costs associated with Fire Memorandum Accounts2
In mid-April 2020, CPUC issued ruling requiring SCE to file RAMP and 2024
annual proposed revenue requirement in track 4
1. Includes all updates to the GRC revenue requirement filed with the CPUC as of September 29, 2020
2. Includes Wildfire Mitigation Plan Memo Account, Fire Hazard Prevention Memo Account, Grid Safety and Resiliency Program Memo Account, and Fire Risk Mitigation
Memo Account
February 26, 2021 26SCE’s 2021 General Rate Case will be approved in four tracks
over 2021–2023
Estimated timeline for 2021 General Rate Case tracks and milestones1
Opening CPUC
SCE Intervenor SCE & Reply Proposed
Testimony Testimony Rebuttal Briefs Decision
Track 1: 2021–2023 GRC
Pending
Revenue Requirement
Track 2: 2018–2019 FMA N/A due to
Update2 settlement (Approved3)
Track 3: 2020 FMA Update2;
Q1 ’21 Q3 ’21 Q3 ’21 Q4 ’21 Q1 ’22
2018–2020 GS&RP4
Track 4: RAMP and 2024
Q2 ‘22 Q1 ‘23 Q1 ‘23 Q3 ’23 Q4 ‘23
Attrition Year
1. The schedule is subject to change over the course of the proceeding
2. Includes Wildfire Mitigation Plan Memo Account, Fire Hazard Prevention Memo Account, and Fire Risk Mitigation Memo Account
3. Proposed Decision was approved by the CPUC in January 2021
4. 2018–2020 Grid Safety and Resiliency Program (GS&RP) costs above settlement amount
February 26, 2021 27GRC track 1: Represents rate base CAGR of 7.6% over two
rate case periods1
SCE’s request would result in 2018–2023 rate SCE requests 2021 revenue requirement
base growth of 7.6% increase of ~$1.3 billion4
Rate Base CAGR, 2018–2023 2021 GRC Revenue Requirement, $ in Billions
7.6% 7.6
6.9
6.7
6.4% 2020
6.1% Authorized
($6.4)
SCE Rebuttal 1 CalPA 2 TURN 3 SCE Rebuttal CalPA TURN
1. SCE Rebuttal rate base forecast reflects 2021–2023 rebuttal and latest Non-GRC and FERC estimates
2. CalPA rate base forecast assumes CPUC GRC rate base attrition year increases for 2022 and 2023 of 3.5%, consistent with CalPA’s attrition mechanism proposal
3. TURN rate base forecast assumes TURN’s CPUC GRC rate base attrition proposal of budget-based capital additions for wildfire and new service connections, 0% increase
on all other capital additions
4. Change in authorized base revenue requirement after adjusting for post-test year ratemaking changes of $0.1 billion
February 26, 2021 28GRC track 2 update: Settlement allowing recovery of $391
million for wildfire mitigation approved by CPUC
GRC track 2 Agreement reached with Cal Advocates, TURN, and SBUA to resolve all
settlement reached issues pending in track 2 of the 2021 GRC
with intervenors
Covers Wildfire Mitigation Plan MA (WMPMA), Fire Hazard Prevention
MA (FHPMA), and Fire Risk Mitigation MA (FRMMA)
Approved settlement Summary of settlement vs. request
authorizes ~82% of ($ in Millions) Request1 Settlement
O&M and Approval of O&M 491 401
100% of capital Reasonableness of Capital2 302 302
Revenue Requirement3 482 391
Decision requires amortization period of not less than 12 months
Settlement approved CPUC approved settlement without modifications in January 2021
by CPUC
Decision received in line with original scoping memo schedule
1. Request reflects updates made in rebuttal testimony served on September 25, 2020. SCE’s rebuttal testimony defers recovery of approximately $16 million of O&M and
SCE reserves the right to seek recovery of that amount in track 3 of the 2021 GRC
2. Capital expenditures after August 1, 2019, totaling $204 million, are subject to the AB 1054 exclusion from equity rate base and may be recovered through a separate
financing order
3. Revenue requirement lower than total approval primarily because of flow through tax benefits from certain capital expenditures. Capital revenue requirement included
mainly represents depreciation, taxes, and return, and excludes the revenue requirement for any capital subject to AB 1054 (approximately $204 million of the $302 million
(excluding overheads))
February 26, 2021 29SCE’s average residential bills lower than national average
because higher rates more than offset by lower usage
SCE’s residential usage and …which offset above- Within California, PG&E and
bills are lower than national average residential rates that SDG&E’s system average
average due to milder reflect a cleaner fuel mix, rates are 13% and 19%
climate and higher energy higher cost of living, and higher, respectively, than
efficiency standards… lower system utilization SCE’s
Residential Electricity Bill, Average Residential Rate, System Average Rate1
Dollars per Month Cents per kWh Cents per kWh
129 23.5
18.1 22.3
+19%
(17%) 19.7 +13% vs SCE
107
38% vs SCE
13.1
US Average SCE US Average SCE SCE PG&E SDG&E
Source: EIA's Form 861M (formerly Form 826) Data Monthly Electric Utility Sales and Revenue Data (12-Months 1. Rates include California Climate Credit
Ending November 2020) https://www.eia.gov/electricity/data/eia861m/index.html Sources: SCE Advice 4377-E-A effective Feb. 1, 2021
PG&E Advice 6004-E-C effective Jan. 1, 2021
SDG&E Advice 3620-E effective Jan. 1, 2021
February 26, 2021 30SCE’s system average rate has grown less than inflation over
the last 31 years, with some ups and downs along the way
SCE’s system average rate has grown at an annualized ~2.2% as compared to
local inflation of ~2.4% since 1990
Cents per kWh
25
Los Angeles Area
20 Inflation
15
SCE System
Average Rate
10
5
0
1990 '95 '00 '05 '10 '15 2020
February 26, 2021 31Use of Non-GAAP Financial Measures
Edison International's earnings are prepared in accordance with generally accepted
accounting principles used in the United States. Management uses core earnings
(losses) internally for financial planning and for analysis of performance. Core earnings
(losses) are also used when communicating with investors and analysts regarding Edison
International's earnings results to facilitate comparisons of the company's performance
from period to period. Core earnings (losses) are a non-GAAP financial measure and
may not be comparable to those of other companies. Core earnings (losses) are defined
as earnings attributable to Edison International shareholders less non-core items. Non-
core items include income or loss from discontinued operations and income or loss
from significant discrete items that management does not consider representative of
ongoing earnings, such as write downs, asset impairments and other income and
expense related to changes in law, outcomes in tax, regulatory or legal proceedings, and
exit activities, including sale of certain assets and other activities that are no longer
continuing.
A reconciliation of Non-GAAP information to GAAP information is included either on
the slide where the information appears or on another slide referenced in this
presentation.
EIX Investor Relations Contact
Sam Ramraj, Vice President (626) 302-2540 sam.ramraj@edisonintl.com
February 26, 2021 32You can also read