Budget 2023 Beyond GDP - Quality of Life Assessment
←
→
Page content transcription
If your browser does not render page correctly, please read the page content below
Budget 2023
Beyond GDP - Quality of Life Assessment

 Prepared by the Department of Finance
 gov.ie/budget | #Budget2023
Beyond GDP - quality of life assessment page ii
Budget 2023
 Beyond GDP – quality of life assessment
    (Including Distributional Analysis of Tax and Welfare Changes in Budget 2023)

Beyond GDP - quality of life assessment                                       page iii
Beyond GDP - quality of life assessment page iv
SUMMARY AND KEY MESSAGES
Considerable progress has been made in developing new measures of well-being

˃   The Programme for Government 2020 committed to developing new measures of well-being in
    order to create a broader context for policy-making.

˃   The First Report on a Well-being Framework for Ireland, released last year, introduced the
    Framework as an important cross-government initiative seeking to provide a multi-dimensional
    approach for understanding the impact of public policy.

˃   An annual high-level analysis of the well-being dashboard is now conduced at an early stage of the
    budget process. This was presented and discussed at the National Economic Dialogue in June
    2022.

The package of combined tax and welfare measures in Budget 2023 is strongly progressive

˃   Analysis of Budget 2023 shows that, in net terms, households experience an average gain in
    weekly disposable equivalised income of 3 per cent from the Budget package and 1.6 per cent
    from the Cost of Living package in nominal terms.

˃   In 2023, disposable income of households in income deciles 6 – 10 improve mainly because of
    direct and indirect tax measures. For households in income deciles 1 – 5, welfare measures and
    the energy credit are responsible for most of the gain in disposable income.

˃   Overall, the distributional impact of Budget 2023 is strongly progressive.

The Irish tax system does the most of any tax system in the OECD to reduce income inequality

˃   Ireland’s taxation system is amongst the most progressive in the OECD.

˃   The latest OECD data show that Ireland recorded the third largest absolute reduction in the Gini
    coefficient between market and disposable income.

˃   Looking purely at taxation of labour income, as measured by the tax wedge, Ireland has the most
    progressive system in the EU and third most progressive in the OECD.

Equality budgeting – analysis highlights the distributional impact of the Age Tax Credit

˃   The design of the tax system and individual tax policies can have a significant impact on societal
    outcomes and can alter significantly the outcomes for different groups.

˃   The Department has undertaken a review of recent international and domestic developments in
    equality budgeting and analysed updated PAYE statistics by age and gender.

˃   A distributional analysis of the age tax credit shows the measure has positive income effects for
    10.3 per cent of all households with middle income deciles benefitting the most.

The tax system consistently provides strong support for climate positive tax measures

˃   Ireland is one of the first OECD or EU countries to have undertaken green budgeting tax analysis
    and is at the forefront of such analysis.

˃   The Department’s analysis examines existing tax measures and incremental budgetary measures.

˃   The analysis concludes that the tax system as a whole is climate positive, from a monetary
    perspective.

˃   This climate positive monetary balance has grown significantly over time, from €1.4 billion in 2011
    to €2.5 billion in 2020.

Beyond GDP - quality of life assessment                                                         page v
Beyond GDP - quality of life assessment page vi
Contents1
                                                                                                                        page
               Summary and main messages                                                                                   iii

1              Introduction                                                                                                  1

2              Well-being                                                                                                    3
2.1            The well-being agenda                                                                                         3
2.2            Ireland’s well-being framework                                                                                3
2.3            Analysis of the well-being dashboard                                                                          4
2.4            Policy through a well-being lens                                                                              5
2.5            Embedding and implementation                                                                                  8
2.6            Summary                                                                                                       9

3              Distributional analysis of Budget 2023                                                                       10
3.1            Introduction                                                                                                 10
3.2            Methodology and policies analysed                                                                            10
3.3            Estimated distributional impact                                                                              12
3.4            Summary                                                                                                      13

4              Progressivity of the Irish income tax system                                                                 14
4.1            Introduction                                                                                                 14
4.2            Income distribution in Ireland                                                                               14
4.3            Impact of the tax and welfare system                                                                         15
4.4            Income tax progressivity through the prism of the ‘tax wedge’                                                16
4.5            Summary                                                                                                      17

5              Equality budgeting analysis                                                                                  18
5.1            Introduction                                                                                                 18
5.2            Recent international developments                                                                            18
5.3            National developments                                                                                        19
5.4            PAYE taxpayer data                                                                                           19
5.5            Distributional analysis of age tax credit                                                                    21
5.6            Summary                                                                                                      23

6              Green budgeting analysis                                                                                     24
6.1            Introduction                                                                                                 24
6.2            Green budgeting analysis – existing tax measures and Budget 2023                                             24
6.3            Green budgeting analysis of 2022 in-year tax changes                                                         26
6.4            Green budgeting analysis of Budget 2023 – tax perspective                                                    27
6.5            Summary                                                                                                      28

7              Conclusion                                                                                                   29

Tables
Table 1        Measures included / excluded in the microsimulation                                                          11
Table 2        Tax credit claimants, by personal status and gender (2019)                                                   21
Table 3        Tax credit claimants, by age range (2019)                                                                    21

1
 The material set out in this document is based on data available to September 2022. It was compiled by staff in the Departments
of Finance and Public Expenditure and Reform, and every effort is made to ensure accuracy and completeness. When errors
are discovered, corrections and revisions are incorporated into the digital edition available on the website of the Department of
Finance. Any substantive change is detailed in the on-line version.

Beyond GDP - quality of life assessment                                                                                 page vii
Table 4 Balance of climate focused tax revenues and tax expenditures, in €m 26 Table 5 Climate impact of Budget 2023 tax measures, €m 28 Figures Figure 1 Ireland’s well-being framework 4 Figure 2 Change in household disposable income due to CoL measures, per cent 12 Figure 3 Change in household disposable income due to Budget 2023 measures, per cent 13 Figure 4 Gini coefficient in Ireland and the OECD, 2008 - 2018 15 Figure 5 The composition of the Gini coefficient 16 Figure 6 The tax wedge, Ireland and the OECD 17 Figure 7 PAYE taxpayers in 2021 20 Figure 8 PAYE taxpayer data by gender, 2019 and 2021 comparison 20 Figure 9 Change in disposable income among households eligible for the credit 22 Figure 10 Green budgeting analysis – climate tax measures, €m 25 Figure 11 In-year tax changes in 2022 and Inflation data 27 Annexes 30 Annex 1 Green budgeting climate positive tax revenue 31 Annex 2 Green budgeting climate negative tax expenditures 32 Annex 3 Green budgeting climate positive tax expenditures 34 Beyond GDP - quality of life assessment page viii
Chapter 1
                                                 Introduction

In recent years, there has been a renewed focus from economists on the shortcomings of gross
domestic product (GDP) and other economic variables in terms of understanding and monitoring issues
such as well-being of the population. In other words, while GDP measures what it is supposed to
measure (the production of goods and services in a particular period), it does not incorporate the many
variables that support the ‘quality of life’ of citizens.

To probe further into this issue, the Organisation for Economic Co-Operation and Development (OECD)
organised a group of experts (2013-2018) to undertake an in-depth study and to make
recommendations. Among the group’s findings were that the overreliance on GDP as the yardstick of
economic performance resulted in a failure to foresee the Global Financial Crisis.2 Following these
findings, the OECD has since constructed a Better Life Index, containing a range of metrics that better
reflect what constitutes and leads to well-being.

Reflecting international developments in this area, the Programme for Government 2020 – Our Shared
Future (hereafter, ‘PfG’), set out a commitment to develop new measures of wellbeing and progress.3

In July 2021, the Government approved the First Report on a Well-being Framework for Ireland (the
Framework).4 This framework is being developed over time to provide a “comprehensive set of well-
being measures to create a well-rounded, holistic view of how our society is fairing, as an important
complement to existing economic measurement tools.” It is a cross-government initiative that seeks to
develop a multi-dimensional approach to understanding the impact of public policy, and the conceptual
framework considers several different dimensions.5

The Department of Finance has already begun incorporating several well-being metrics into the
budgetary process and further progress is envisaged in the coming years. As set out in its Statement
of Strategy 2021-2023, the Department’s main goals are to ensure a balanced and sustainable
economic recovery and to promote environmentally sustainable economic progress. 6 These
commitments incorporate several actions, including:

    ˃    To advise and implement economic policies that promote improved living standards, stability
         and job creation;
    ˃    Continue to develop the process of budget and policy proofing as a means of advancing
         equality, reducing poverty and strengthening economic and social rights;
    ˃    The development and promotion of economic, fiscal and financial policy advice in support of
         the Government’s policy on climate action and climate finance.

Against this background, the purpose of this paper is to document the well-being implications from
policy developments under the remit of the Department of Finance. It is a ‘living’ document and it will
be updated for each annual Budget. To that end, the traditional budgetary analysis has been expanded

2
  Available at: https://www.oecd.org/social/beyond-gdp-9789264307292-en.htm
3
  Available at: https://www.gov.ie/en/publication/7e05d-programme-for-government-our-shared-future/
4
  Available at: https://www.gov.ie/en/press-release/fb19a-first-report-on-well-being-framework-for-ireland-july-2021/
5
  Namely: Subjective Well-being; Mental and Physical Health; Income and Wealth; Knowledge, Skills and Innovation; Housing
and Built Environment; Environment, Climate and Biodiversity; Safety and Security; Work and Job Quality; Time Use;
Connections, Community and Participation; Civic Engagement, Trust and Cultural Expression.
6
  See Statement of Strategy 2021-2023, Department of Finance, available at:
https://assets.gov.ie/122270/1d8bd1ca-295f-42b2-9998-1c83ae04e716.pdf

Beyond GDP - quality of life assessment                                                                          page 1
to assess how the Budget is contributing to wider societal goals, in particular enhancing equality, supporting climate action and improvements in quality of life. The remainder of the document proceeds as follows. Chapter 2 presents the well-being framework. In chapter 3, the estimated distributional impacts of tax and welfare measures in Budget 2023 are presented, while the analysis in chapter 4 takes a strategic look at the role of the income tax system in Ireland in reducing inequality. Chapter 5 turns to equality budgeting, analysing the effects of incremental budgetary policy and tax policy on a range of equality related metrics and societal groups. Chapter 6 summarises the green budgeting analysis, elaborating on the climate impacts of tax policy, considering both incremental budgetary policy and the entirety of the tax system, and, finally, chapter 7 concludes. Beyond GDP - quality of life assessment page 2
Chapter 2
Well-being
2.1 The well-being agenda
In recent years, a consensus has emerged that traditional economic indicators, such as GDP, do not
capture the true, or underlying, living standards of the population, as they cannot account for issues
such as environmental sustainability, inequality of outcomes, and the lived experience of citizens.
The multi-dimensional concept of well-being has emerged in recognition of the need to move beyond
macroeconomic measures such as GDP to encapsulate all of what matters for people to “live fulfilled
lives now and into the future”.7
This ‘Beyond GDP’ agenda was established in 2008, with the creation of the Stiglitz-Sen-Fitoussi
Commission by the French Government. The Commission was set up to identify the limits of GDP and
to consider alternative measurement tools and indicators. The key finding in the Commission’s report
was the need for the “measurement system to shift emphasis from measuring economic production to
measuring people’s well-being”.8
Since then, the concept of well-being has moved up the international policy agenda. From a multilateral
perspective, the OECD has been a global leader in advancing and communicating the well-being
approach to policy and, in 2011, introduced a framework for measuring a country’s progress. Progress
is assessed via biennial reports on the well-being of OECD countries.9
On a unilateral basis, a large number of OECD countries have developed their own internal frameworks
for well-being. One of the more developed frameworks is that of New Zealand, which produced its first
‘Well-being Budget’ in 2019. New Zealand is also a member of the Well-being Economy Governments
partnership,10 along with Iceland, Scotland, Wales and Finland. This group is a collaboration of national
and regional governments, founded on a joint understanding of the importance of human and ecological
well-being.
2.2 Ireland’s well-being framework
In recognition of the need for a broader perspective on progress, the PfG committed to developing new
measures of well-being in order to create a more well-rounded context for policy-making. Considerable
progress has been made towards achieving this commitment. The First Report on a Well-being
Framework for Ireland, published last year, introduced the Framework as an important cross-
government initiative seeking to provide a multi-dimensional approach for understanding the impact of
public policy. The report set out an overarching vision, a conceptual framework and an accompanying
dashboard of well-being indicators, which together constitute Ireland’s Well-being Framework. The
Second Report, published in June of this year, detailed further progress and refined the conceptual
framework in light of the outcomes of a comprehensive ‘Public Conversation’ and research
programme.11
7
See The Well-Being Framework’s Vision and Goals: https://www.gov.ie/en/publication/545b7-the-frameworks-vision-and-goals/
8
The Report of the Stiglitz-Sen-Fitoussi Commission is available at:
https://ec.europa.eu/eurostat/documents/8131721/8131772/Stiglitz-Sen-Fitoussi-Commission-report.pdf
9
More information on this work is accessible from the OECD’s WISE centre, available at:
https://www.oecd.org/wise/
10
More information on the Well-being Economy Governments Partnership is available at:
https://weall.org/wego
11
Including a Department of Finance paper on sustainability in the Irish Well-being Framework, available at:
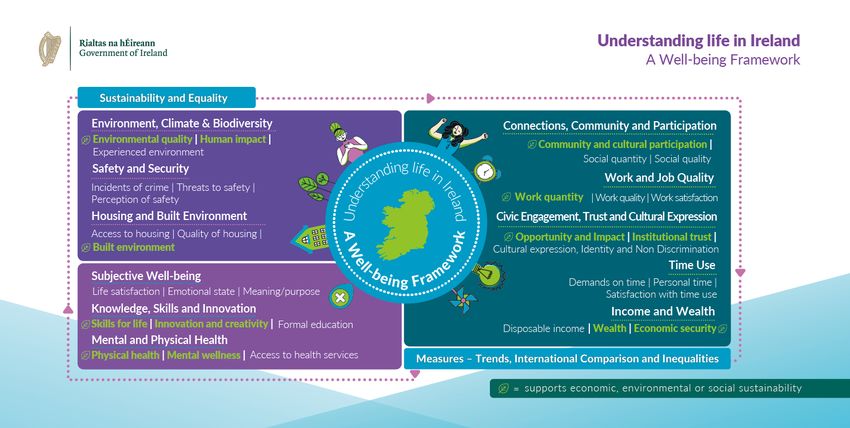
Beyond GDP - quality of life assessment page 3In addition to the two major reports, a new interactive Well-being Information Hub12 has been developed by the Central Statistics Office (CSO) to bring together key well-being indicators in a centralised dashboard. The Government has also launched a Well-being Portal to act as a one-stop shop for all information on well-being developments.13 As a member of the Interdepartmental Working Group on Well-being and a joint sponsor of the work, the Department of Finance has played a central role in supporting the progress of the well-being approach, including conducting research, supporting stakeholder engagement and consultation, and guiding the development of the Well-being Framework. Figure 1: Ireland’s well-being framework Source: Government of Ireland, 2022 Over time, it is intended that the Well-being framework will be used in a systematic way across government policy-making, as an important complement to existing economic and performance measurement tools. 2.3 Analysis of the well-being dashboard The supporting dashboard of the Well-being Framework – accessible through the CSO’s Well-being Information Hub – measures life and progress in Ireland through a cohesive set of indicators connected to the dimensions of the Framework. These indicators cover a broad range of life in Ireland, and can provide a high-level overview of how the country is doing, as communities, and as individuals. The dashboard of indicators should not be viewed in isolation but rather as a supporting measurement tool in the formation of evidence based policy. High-level analysis of the dashboard is intended to provide an overall picture of the country’s progress, using data which facilitate a longer-term view of quality of life. Analysis of the dashboard published in June 2022 provides an overall picture of the country’s progress, using data that facilitates a longer-term https://www.gov.ie/en/publication/3da98-sustainability-in-the-irish-well-being-framework-a-review/ 12 Available at: https://www.cso.ie/en/releasesandpublications/ep/p-wbhub/well-beinginformationhub/ 13 Available at: https://www.gov.ie/en/campaigns/1fb9b-a-well-being-framework-for-ireland-join-the- conversation/?referrer=http://www.gov.ie/wellbeing-framework/ Beyond GDP - quality of life assessment page 4
view of quality of life. This section reviews this performance, with updated data where possible. The
analysis reviews trends over approximately 5-year periods and examines international comparisons.

Overall, the dashboard paints a generally positive picture of quality of life in Ireland. Across the thirty-
five indicators, Ireland performs well in twenty-one; five indicators show negative performance, including
long working hours in main job, greenhouse gas emissions and experience of discrimination. The
performance of the other nine indicators, including healthy life years, net Government wealth and the
labour underutilisation rate, are more nuanced. There are particularly positive indications across the
Knowledge, Skills and Innovation, Work and Job Quality and Safety and Security dimensions. Only
one of the eleven dimensions reveals a negative overall picture – the Environment, Climate and
Biodiversity dimension.

The CSO Hub also breaks down each indicator by specific socio-demographic groups, chosen on the
basis of relevance, research and data availability. This allows an examination of equality across
dimensions. A number of these groups were identified as experiencing inequality across a high
proportion of indicators. These are women, single-parent households, households with lower incomes,
people with permanent sickness or disability, immigrants/non-Irish, and households in rented
accommodation.

Certain indicators are ‘tagged’ to highlight their importance for sustainable well-being (economic,
environmental, social & democratic), i.e. in a forward-looking sense. The performance of these
indicators provides insight into whether progress is broadly sustainable (supports maintenance of well-
being at least at current levels into the future). Of the fourteen ‘sustainable’ indicators, two show an
overall negative performance. These are greenhouse gas emissions and water quality, and are
therefore concentrated in environmental sustainability. A further five show a neutral performance.

Since the first analysis of the dashboard was published in May 2022, newly published statistics have
resulted in changes to the broad understanding of life in Ireland. There was a reduction in healthy life
years in 2020, resulting in a change to the five-year trend. Greenhouse gas emissions reduced in 2020,
although this was pandemic-related. Finally, net Government wealth, which had experienced a
reduction over the pandemic period to provide much-needed Government supports, has rebounded
somewhat and is now on an upward trend.

Overall, while the dashboard provides a positive picture of the country, it points towards specific areas
that suggest sustained issues over the longer-term across quality of life, sustainability and equality.

2.4     Policy through a well-being lens
Over time, it is intended that the Well-being Framework can serve as a useful complementary tool within
the public policy formulation process. The early stage of work to embed the Framework is underway,
and is being progressed through a number of parallel streams (chapter 6.5). A key aspect of this initial
phase is to link existing policy to the Well-being Framework, exploring the connections between public
policy and well-being to build a foundation for the Framework to input into policy analysis and evaluation.

This section applies the Framework to a selection of policy measures taken in previous Budgets, to
provide a snapshot into how public policy can be viewed through the lens of well-being. It clarifies the
linkages which exist between specific policy measures and the relevant dimensions of well-being,
considering trade-offs and synergies outside of the immediate policy area. This is one respect in which
the Framework adds value, allowing trade-offs to be assessed in a more structured and holistic way.

Beyond GDP - quality of life assessment                                                              page 5
While the primary purpose of this exploration is to illustrate an application of the Well-being Framework
to policy, the measures discussed remain in place and their links to well-being are still relevant.
Moreover, this piece helps to widen focus from the most recent policy changes to the full scope of policy
and its status quo effects, in line with the Framework’s goal to create longer-term, more holistic thinking.

To narrow down the measures for consideration in this snapshot, two dimensions of the Well-being
Framework have been selected – Environment, Climate, and Biodiversity and Income and Wealth. Both
dimensions contain sustainability indicators which, given the challenges of the last few years in
particular, merit closer examination.14 Crucially, this analysis does also consider the wider impacts of
the specific measures looked at across all relevant dimensions of the Well-being Framework, in keeping
with the goal of a less-siloed, more holistic approach to policy.

2.4.1    Environment, Climate and Biodiversity
Environment, Climate and Biodiversity is concerned with the environment that an individual lives in, now
and in the future. This dimension encompasses the global consequences of climate change, and
Government action to address climate change is most closely connected to this dimension of well-being.
In recent years, there have been substantial changes made to public policy to address the challenge of
climate change, with taxation policy having a significant role to play.

A number of substantial policy measures have been taken in this space over recent years. The
introduction of a carbon tax was a vital step towards a low-carbon future for Ireland. This tax was first
introduced in 2010, but legislation has more recently provided for annual increases of €7.50 per tonne
each year up to 2030. Budget 2021 and Budget 2022 both included action to fulfil this commitment.
The purpose of the carbon tax and increases thereof is to gradually increase the financial disincentive
for the use of carbon-emitting fuels and to increase the incentives in favour of greener sources of
energy. In this way, this policy action can reduce the negative impact Ireland has on the climate by
motivating the shift to a more sustainable energy regime. It also has the potential for positive
externalities outside of the dimension of Environment, Climate and Biodiversity; for example, by bringing
about an improvement in air quality which could improve well-being outcomes in the dimension of
Physical and Mental health.

It is also important to consider the potential impacts of increases to the carbon tax on areas of well-
being other than Environment, Climate, and Biodiversity. From the multi-dimensional perspective of the
Framework, the carbon tax has the potential to reduce well-being within the Income and Wealth
dimension and through that financial channel, to have knock-on effects on well-being more broadly.
Over time, as cleaner forms of energy become more accessible and less expensive, the negative
impacts of the carbon tax will reduce accordingly.

In the short-term, the potentially regressive impact of increases in the carbon tax were recognised, and
policy was designed to reduce the negative effect of the tax for the most vulnerable. The additional
revenue from the carbon tax was ring-fenced for the purposes of protecting the most vulnerable and
supporting the transition to a low carbon economy, in line with the PfG commitment. For Budget 2022,
this included targeted social welfare initiatives to prevent fuel poverty, and investment in a socially
progressive national retrofitting campaign.

In addition to the carbon tax, the Government has, in recent years, made many adjustments to policy
to incentivise a more sustainable society. One of the major focal points has been the policy actions to

14
   For example, the pandemic had a substantial impact on Government finances, and the urgency and relevance of the climate
crisis is only increasing over time.

Beyond GDP - quality of life assessment                                                                           page 6
encourage a shift towards use of electric vehicles. This has included an extension of the relief on
vehicle registration tax for battery electric vehicles, an extension of the benefit-in-kind (BIK) deduction
for electric vehicles, and the introduction of an environmental rationale for BIK commercial vehicles from
2023. In addition, changes have been announced to strengthen the environmental rationale of the
vehicle registration and motor tax systems.

These policy measures are intended to reduce the carbon emissions created by vehicles in Ireland,
both by encouraging a switch to cleaner electric vehicles and by directly disincentivising ownership of
emissions-heavy vehicles (which might alternatively motivate a shift to public transport).

2.4.2       Income and Wealth
The dimension of Income and Wealth refers to the financial resources that determine an individual or
society’s ability to meet their day-to-day needs and wants. Government policy, through the system of
taxes and transfers, plays a significant role in determining the allocation and distribution of financial
resources in Ireland. Indeed, Ireland has one of the most progressive systems of taxes and transfers
in the OECD (Chapter 4).15

In recent years, income tax measures have been taken to reduce the tax burden on individuals, raising
well-being in the dimension of Income and Wealth by increasing the financial resources available to
households. These measures have included increases in the standard rate tax bands; increases in the
personal tax credit, employee tax credit, and earned income credit; and changes to USC bands. These
changes benefit everyone who pays income tax, and allow individuals and households to allocate more
financial resources towards the areas of well-being they deem most important. The less visible trade-
off to lowering the tax burden on individuals is that the Government cannot put those resources towards
direct expenditure which would increase well-being through other channels.

In addition to determining overall tax intake for revenue raising purposes, the tax system is also a means
to increase income and wealth equality. The overall progressivity of the income tax system acts toward
this goal, along with specific measures designed to improve well-being for the least well-off in society.
For example, in Budget 2022 the minimum wage was increased to €10.50 per hour, helping promote a
minimum level of well-being in the dimension of Income and Wealth. Nevertheless, there are possible
well-being trade-offs to this policy action, with the potential for a higher minimum wage to impact on job
creation (depending on the rate), in turn affecting well-being in the dimension of Work and Job Quality.

Taxation and transfer policy is also used more specifically to target vulnerable groups and incentivise
positive outcomes. For example, in Budget 2021 the dependent relative tax credit was raised from €70
to €245, while in the previous year the home carer credit was increased by €100 to a total value of
€1,600. These tax credits relate to the dimension of Income and Wealth, but also have strong linkages
to the dimensions of Connections, Community and Participation and to Work and Job Quality. These
tax credits recognise the contribution of unpaid care work to society.

Taking a broader scope, the sustainability of Government finances is also an important component of
well-being within the dimension of Income and Wealth, as the dimension encompasses not only the
financial well-being of individuals, but also the collective income and wealth of society as a whole. This
includes the financial position of the Government, its sustainability and its resilience to shocks. These
elements of well-being are reflected in the Wealth and Economic Security aspects of the Income and
Wealth dimension, and are represented by the net Government wealth indicator in the dashboard.

15
     Available at: https://www.oecd.org/gov/gov-at-a-glance-2021-ireland.pdf

Beyond GDP - quality of life assessment                                                             page 7
In Budget 2020, the Government ‘balanced the books’, an important fiscal milestone to place public finances on a sustainable footing. This positive development was subsequently upended by the Covid- 19 pandemic and the need for Government to run large fiscal deficits to support businesses and households throughout the pandemic. This is an excellent example of why sustainability and resilience in Government finances are significant from a well-being perspective. The Government’s sound financial position entering the pandemic enabled policy actions to support incomes and bolster the health sector. By Budget 2022, Ireland’s debt ratios were once again on a downward trajectory, and the Government forecast a return to a sustainable path for the nation’s finances. Budget 2023 will go one-step further, setting aside some of the surplus in the National Reserve Fund. Budget 2021 also established the Commission on Welfare and Taxation (the Commission), created to independently consider how best the tax system can support economic activity and prosperity, while ensuring resource use is sustainable to meet the costs of public services over the medium and long term. The Commission recently published its report, setting out its recommendations for refining the taxation and welfare systems to ensure sustainability over the long-term.16 This represents a central issue for Ireland in coming decades, and is intertwined with many of the major impending challenges to well-being, including ageing demographics, the just-transition, and the rise of digital disruption and automation. 2.5 Embedding and implementation Having developed and refined the Well-being Framework, the next phase of work is to embed the Framework into the broader system of policy-making. The intention is that, over time, the Framework can come to play a role in the identification of policy priorities and the assessment of policy measures. This next phase of work will be guided by a whole-of-Government interdepartmental group chaired by the Department of the Taoiseach. The challenge of implementation will be achieved through a number of parallel streams, with some progress already made towards embedding the Framework. For example as with the dashboard analysis, which can provide high-level evidence and context for the identification of potential policy priorities (Section 2.3). This analysis was featured in the Summer Economic Statement and the Framework fed into the National Economic Dialogue this year. The well-being perspective will continue to be considered in expenditure and policy evaluation, building on performance and equality budgeting. While the development of the Irish Well-being Framework and dashboard are important building blocks in developing a holistic view of how Irish society is faring, embedding well-being within the policy-making process will require time and further consideration of the relationship between well-being and public policy. Over the course of the last year, a number of initiatives have been developed to support this. In relation to the Budget, the Department of Public Expenditure & Reform is finalising a working paper that locates well-being within the context of the budgetary process.17 More generally, the Department of Public Expenditure & Reform is finalising a second working paper that locates well-being within a public policy context, focusing on issues around the use of evidence to inform the policy process. Finally, a well-being perspective can make an important contribution to the design and implementation of new policies and programmes and to this end, the Department of Public Expenditure & Reform intends to examine how a well-being perspective can inform the various stages of the policy cycle. 16 The full report of the Commission on Taxation and Welfare is available at: https://www.gov.ie/en/publication/7fbeb-report-of-the-commission/ 17 In particular, the paper proposes an approach that provides a cross-governmental description of budgetary expenditure decisions in terms of well-being dimensions (to complement the existing Vote Group approach to presenting such decisions) and “tags” expenditure so as to describe the overall level of allocated resources in terms of well-being dimensions. Beyond GDP - quality of life assessment page 8
Over time, the well-being approach can be further progressed through the development of a broader
evidence base and new research tools. In this next phase, the Department of Finance will continue to
support the advancement of the well-being approach, by seeking to enhance and foster the
improvement of well-being in Ireland.

2.6      Summary
Significant steps have been taken since the publication of the PfG commitment on well-being in October
2020. A conceptual framework and accompanying dashboard have now been established, two phases
of public consultation were undertaken, and a range of bespoke research has been completed and
published including research by the Department of Finance. Nevertheless, the Irish Well-being
Framework remains a recent innovation and is still very early in the process of implementation. By
comparison, the New Zealand Treasury published its first iteration of the Living Standards Framework
in 201118, and did not produce its first Well-being Budget until 2019.

In addition to setting out Ireland’s progress in terms of well-being, this report presents updated analysis
of the well-being dashboard. The updated analysis, in line with previous iterations, presents a generally
positive picture of well-being in Ireland. Across the thirty-five indicators of the dashboard, Ireland
performs well in twenty-one, while others show a more negative or nebulous performance. Of the eleven
dimensions in the dashboard, only the Environment, Climate and Biodiversity dimension reveals a
negative picture when taken as a whole. Overall, while Ireland’s performance is generally positive, the
dashboard points towards specific areas which may be experiencing sustained issues across quality of
life, sustainability and equality.

The snapshot analysis set out in this piece provides a sample of how public policy can be viewed
through the lens of well-being. The application of the Framework to previous Budget measures provides
clarification on the linkages between policy and well-being at the micro level. Focusing on the
dimensions of Climate, Environment, and Biodiversity, and Income and Wealth, the links between
recent changes to Government policy and well-being in terms of the environment and in terms of income
and fiscal sustainability are drawn out. This also allows for a more explicit consideration of trade-offs
and synergies.

Looking ahead, the next phase of work will build on existing links between public policy and well-being
to embed the Well-being Framework into the policy-making process. Over time, it is intended that the
Well-being Framework will aid in the identification of policy priorities and the evaluation of policy
measures.

The progress made to-date on well-being reflects a whole-of-government approach and the
commitment to drive this innovation forward. The Department of Finance, as a joint sponsor of this work,
will continue to contribute to and support further advancement on the well-being approach.
Nevertheless, the implementation of well-being into policymaking will take time and will, by necessity,
be an iterative process.

18
   New Zealand is widely recognised as a pioneer in well-being work, and more information on New Zealand’s Living Standards
Framework is available at:
https://www.treasury.govt.nz/information-and-services/nz-economy/higher-living-standards/our-living-standards-framework

Beyond GDP - quality of life assessment                                                                            page 9
Chapter 3
                           Distributional analysis of Budget 2023

3.1      Introduction

As stated at the outset, the PfG provides a commitment to developing processes to advance social
solidarity, equality of opportunity, and reaching ecological harmony and economic equity. The PfG
further commits to focus any tax rises on behaviours with negative externalities, such as carbon taxes.

The purpose of this chapter is to assess the distributional impact of the main tax and welfare measures
adopted in Budget 2023, including the October to December Cost of Living (CoL) package. Before
proceeding, it is important to stress that the income taxation system in Ireland is one of the most
progressive in all advanced economies (see chapter 4). The quid pro quo of a progressive income tax
system is that any reductions (including ‘indexation’) in income taxation will inevitably be somewhat
regressive. It is also important to recognise that the distributional analysis only captures the impact of
changes to the tax and welfare system. For a complete picture of the distributional impact of the Budget,
the above measures would need to be considered in conjunction with significant changes to wider public
expenditure and public service provision, for instance in the areas of health, education, etc.

3.2      Methodology and policies analysed
The distributional effects of tax and welfare policies are assessed using the Economic and Social
Research Institute’s SWITCH (Simulating Welfare and Income Tax Changes) tax-benefit model and
indirect taxes satellite model ITSim (Indirect Taxes Simulation).19 Analysis is conducted by measuring
the effects of policy changes on equivalised household disposable income groups, by income decile.20

The net impact includes the effects of direct tax measures, changes in indirect tax and the package of
welfare measures. Before proceeding, however, it is important to highlight several caveats with the
model. Estimates are shown on a static ‘overnight’ basis and do not account for any behavioural
response to the announced policy changes. It should also be stressed that the model cannot account
for all measures undertaken in the Budget, including, as noted above, the impact of broader public
expenditure increases and improvements in the provision of public services. Finally, the analysis is not
conducted against an inflation adjusted no-policy change scenario, but shows the impact of budgetary
measures in nominal terms.

The tax and welfare changes introduced in Budget 2023 and which are included in the simulation are
set out below (table 1). As evident, the vast majority of measures outlined in the Budget are included
in the analysis.

19
  This material was prepared by the Department of Finance and the Department of Public Expenditure and Reform.
20
   Household income is measured taking account of the differences in a household’s size and composition, and thus is
equivalised or made equivalent for all household sizes and compositions. Income deciles refer to groups of ten equal-size
groups of households, where each group contains 10 per cent of households. The first decile group contains the 10 per cent of
households with the lowest gross household income, while tenth decile refers to the group containing the 10 per cent of
households with the highest household income.

Beyond GDP - quality of life assessment                                                                            page 10
Table 1: measures included / excluded in the microsimulation measure Included (√) / excluded (X) Measures for 2022 (Cost of Living measures) Welfare All welfare measures – double week payment (October) √ All welfare measures – double week payment (Christmas) √ Fuel allowance - €400 lump sum (November) √ Carer’s support grant and disability support payment - €500 lump sum (November)^ √ Living alone allowance - €200 lump sum (November) √ Working family payment - €500 lump sum (November) √ Child benefit – double month payment (November) √ Electricity credit - €200 credit (November) √ Tax and Levies Income tax - rent tax credit - €500 √ Excise on Petrol and Diesel – extension of reduced rates to end-December 2022 √ Excise on MGO – extension of reduced rate to end-December 2022 X VAT on Gas and Electricity – extension of reduced rate of 9 per cent to end-December 2022 √ NORA Levy – reduction in levy by 2 cent per litre (VAT exclusive) for petrol and diesel to end-December 2022 √ Measures for 2023 (Budget 2023 measures) Welfare All weekly rates - Increase by €12 from 1 January 2023 √ Working family payment – increase thresholds by €40 per week √ Fuel allowance – increase means limit to €200 above the relevant state pension contributory rate √ Fuel allowance – increase means test for over 70s by €500 (single person) and €1,000 (couple) X Fuel allowance – disregard disablement benefit and half-rate carer’s allowance X Qualified child increase of €2 per week √ Disability allowance – increase earnings disregard to €165^ √ Domiciliary care allowance – increase rate to €320 X Electricity credit - €200 credit for each of January 2023 and March 2023 √ Tax and Levies √ NORA Levy – reduction in levy by 2 cent per litre (VAT exclusive) for petrol and diesel to end-February 2023 √ Carbon tax – increase of €7.50 per tonne, new rate €48.50 per tonne √ Income tax - €75 increase in personal tax credit, PAYE tax credit, and earned income tax credit √ Income tax - €100 increase in home carers tax credit √ Income tax - rent tax credit - €500 √ Income Tax – Increase in single standard rate band by €3,200 (€36,800 to €40,000) √ Income Tax – Increase in one-parent family standard rate band by €3,200 (€40,800 to €44,000) √ Income Tax – Increase in married couple/civil partner standard rate band by €3,200 (€45,800 to €49,000) √ USC – increase in USC 2 per cent rate income band by €1,625 (€21,295 to €22,920) √ * proportionate increase for qualified adults and those on reduced rates of payments being modelled ^ model unable to capture change to blind pension in the analysis Source: Department of Finance. Beyond GDP - quality of life assessment page 11
3.3                     Estimated distributional impact
The net tax and welfare package outlined in Budget 2023 benefits all income levels, with equivalised
disposable income increasing for all income deciles (figure 2A).21 In net terms, households experience
an average gain in weekly disposable equivalised income of 1.6 per cent as a result of the CoL package
and 3 per cent as a result of the Budget package, with the overall impact being strongly progressive.

The 2022 CoL measures boost the net disposable income of those in the first three deciles by an
average of 4.5 per cent; for those in income deciles 4 to 10, the average increase in net disposable
income is 1.4 per cent. The Budget 2023 measures boost the net disposable income of those in the
first three deciles by an average of 5.2 per cent. The largest income gains are for those in the deciles 1
and 2, mainly on foot of welfare measures.

The Budget 2023 welfare measures provide an average benefit of 0.8 per cent across all income
deciles, but this is significantly higher for income deciles 1 and 2, which experience a 3.5 per cent gain
each. These income deciles also benefit the most from the CoL welfare package, at 3.8 per cent and
3.9 per cent respectively, while the average benefit is 0.9 per cent.

In terms of tax instruments, the average gain from Budget 2023 direct tax measures is a 1.4 per cent
increase in weekly disposable income, with proportionally greater gains from direct tax measures
experienced by households in deciles 7-9 of the income distribution. For Budget 2023 indirect taxes,
the increases in carbon tax and excise duties are regressive. That said, these regressive impacts are
small and are more than offset by increases in welfare payments; while this is true for all income deciles,
it is especially the case for the first three income deciles. The CoL indirect taxes provide a small gain in
incomes, which is almost evenly distributed across all income deciles.

 Figure 2: change in household disposable income due to CoL measures, per cent
 A: by income decile, as per cent of weekly disposable                                                                        B: by household type, as per cent of weekly disposable
 income                                                                                                                       income
           Energy Credit                          Income Tax                               Social Welfare                               Energy Credit              Income Tax
           Indirect Taxes                         Overall measures                                                                      Social Welfare             Indirect Taxes
     6.0
                                                                                                                               4.0
             5.1
                         5.0
     5.0                                                                                                                       3.5

                                                                                                                               3.0
     4.0                            3.5
                                                                                                                               2.5
                                               2.7
     3.0
                                                                                                                               2.0
                                                          2.0
     2.0                                                             1.5                                                       1.5
                                                                                1.3
                                                                                           1.0
                                                                                                       0.8                     1.0
     1.0                                                                                                          0.6
                                                                                                                               0.5
     0.0
                                                                                                                               0.0
             Decile 1

                         Decile 2

                                    Decile 3

                                               Decile 4

                                                          Decile 5

                                                                     Decile 6

                                                                                Decile 7

                                                                                            Decile 8

                                                                                                       Decile 9

                                                                                                                  Decile 10

                                                                                                                                     Single Lone Couple Couple Single Couple Other
                                                                                                                                      w/a, parent w/a,   w/a,    r/a    r/a
                                                                                                                                      n/c         n/c    w/c

 Source: Department of Finance calculations using ESRI’s                                                                      Note– w/a = working age; n/c = no children; w/c = with
 SWITCH 5.3 micro-simulation programme and ITSim                                                                              children; r/a = retirement age. Other category is only
 indirect taxes satellite model.                                                                                              provided in IT SIM analysis.
                                                                                                                              Source: Department of Finance calculation using ESRI’s
                                                                                                                              SWITCH 5.3 micro-simulation programme and ITSim
                                                                                                                              indirect taxes satellite model.

21
     Equivalisation adjusts household income on the basis of household size and composition.

Beyond GDP - quality of life assessment                                                                                                                                             page 12
Both the net CoL package and net Budget 2023 tax and welfare package benefit all household types
(or family types) (figure 2B). Single retirement age households and lone parents gain proportionally
the most from both the CoL package and Budget 2023 package, with social welfare measures
contributing the most to these gains. Working-age couples without children experience the most
significant gains from a Budget 2023 from a reduced direct tax burden. The energy credit will provide a
significant benefit to all households in both 2022 and 2023.
Figure 3: change in household disposable income due to Budget 2023 measures, per cent
A: by income decile, as per cent of weekly disposable B: by household type, as per cent of weekly disposable
income income
Indirect Taxes Energy Credit Transport Reduction Indirect Taxes Energy Credit Transport Reduction
Income Tax Social Welfare Overall measures Income Tax Social Welfare
7.0 5.0
6.0
5.5 4.5
6.0
4.0
5.0
4.2 3.5
4.0 3.5 3.0
3.1
2.7 2.8 2.8 2.8 2.5
3.0
1.9 2.0
2.0
1.5
1.0 1.0
0.5
0.0
0.0
-1.0 -0.5
Decile 1
Decile 2
Decile 3
Decile 4
Decile 5
Decile 6
Decile 7
Decile 8
Decile 9
Decile 10
Single Lone Couple Couple Single Couple
w/a, n/c parent w/a, n/c w/a, w/c r/a r/a
Source: Department of Finance calculations using ESRI’s Note– w/a = working age; n/c = no children; w/c = with
SWITCH 5.3 micro-simulation programme and ITSim children; r/a = retirement age. Other category is only
indirect taxes satellite model. provided in IT SIM analysis.
Source: Department of Finance calculation using ESRI’s
SWITCH 5.3 micro-simulation programme and ITSim
indirect taxes satellite model.
3.4 Summary
This distributional analysis of Budget 2023 tax and welfare measures indicates that households
experience an average gain in weekly disposable equivalised income of 3 per cent, in net terms. The
CoL package to the end of 2022 provides a gain of 1.6 per cent in net terms. The overall impact of these
measures are also shown to be strongly progressive, with deciles 1 and 2 showing the strongest gains,
due in large part to increases in welfare measures. All income decile groups experience income gains
from the overall Budget package and this is also shown to be the case for all household types, with lone
parents and single retirement age households gaining proportionally the most.
The analysis also indicates that the overall budget package, particularly the increases in welfare,
significantly offset any potential regressive impacts of the carbon tax. This is particularly the case for
the first three income deciles.
In 2023, disposable income of households in income deciles 6 – 10 improve mainly because of direct
and indirect tax measures. For households in income deciles 1 – 5, welfare measures and the energy
credit are responsible for most of the gain in disposable income.
Beyond GDP - quality of life assessment page 13Chapter 4
Progressivity of the Irish income tax system
4.1 Introduction
The PfG sets out the Government’s aim to deliver a better quality of life for all, including equality within
society. To that end, the distributional analysis of Budget 2023 assessed the impact of the changes in
the tax and welfare system across the income distribution. However, annual budgetary changes simply
amend the existing system, the impact of which is obviously much larger than any changes to it. The
purpose of this chapter, therefore, is to report on income distribution in Ireland and to highlight the role
of the tax and welfare system in influencing this distribution.
4.2 Income distribution in Ireland
4.2.1: the ‘Gini coefficient’ – a primer
The so-called ‘Gini coefficient’ (hereafter the ‘Gini’) is the international standard for measuring the
dispersion of income within a country. For any country, the Gini lies in the range 0-1, with a more
unequal distribution of income resulting in a higher figure within this range. For example, in a
hypothetical situation in which all households have equal income, the Gini would be 0; at the other end
of the spectrum, a hypothetical situation in which all the income in a country accrued to a single
household would generate a Gini of 1.
Importantly, the Gini can be calculated on the basis of both market income (i.e. household income
before tax and transfers are taken into account) and disposable income (i.e. household income after
tax and transfers are applied). In this way, the role of the tax and welfare systems in addressing income
redistribution can be assessed. The Gini measured on the basis of disposable income captures the
distribution of income after the tax and welfare systems have performed their redistributive function. It
stands to reason that the Gini measured on this basis is the most suitable for the purposes of examining
effective inequality.
4.2.2: the ‘Gini coefficient’ in Ireland – evolution over time
The Gini for market income inequality, or income inequality pre-tax and transfers, and disposable
income inequality, or income inequality post tax and transfers is shown below (figure 4A). This is
calculated using the OECD income definition, which includes a more detailed breakdown of transfers
received and paid by households and a revised definition of household income. 22 While data for Ireland
goes back to 2004 using this definition, data for other countries is more limited and therefore the below
analysis begins with 2008. Updated OECD data are expected to be released in October 2022.
Market income inequality increased during the global financial crisis (2008/09) and the euro area
sovereign debt crisis (2010 – 2012), both in Ireland and across the OECD.23 The increase in Ireland
was larger than elsewhere and, by 2011, Ireland had the highest level of market income inequality in
the OECD. Market income inequality peaked in Ireland in 2012 and has subsequently been on a
downward trajectory. By 2018 (latest available cross-country data), the market income Gini had fallen
to 0.52, a significant narrowing relative to the OECD average.
22
Available at: https://stats.oecd.org/index.aspx?queryid=66670
23
The Gini coefficients outlined are calculated on the basis of equivalised household income. Equivalisation adjusts household
income on the basis of household size and composition. The OECD uses a scale of 1 for the first adult, 0.7 for subsequent adults
and 0.5 for each child in the household. In this way, the income of all households is expressed in terms of a single adult household.
For instance, a single adult household with an actual income of 100 (100 ÷ 1 = 100) is considered to have the same equivalised
income as a two adult household with an actual income of 170 (170 ÷ {1+0.7} =100).
Beyond GDP - quality of life assessment page 14Income inequality based on disposable income is also set out below (figure 4B) and reverses the
relative position of Ireland. In particular, once taxes and transfers are taken into account, the distribution
of income in Ireland is much more equal than in the OECD as a whole. The markedly lower values of
the Gini attest to the strongly redistributive nature of the tax and welfare systems in Ireland and across
the OECD. The larger reduction in the disposable income Gini in Ireland relative to the OECD average
illustrates that the Irish system is comparatively successful in reducing income inequality. Overall, the
data show that while market income inequality can be changeable, disposable income inequality has
remained remarkably stable over time, both in the OECD as a whole and in Ireland specifically.
Figure 4: Gini coefficient in Ireland and the OECD, 2008 – 2018
A: market income Gini B: disposable income Gini
IE OECD IE OECD
0.60 0.40
0.55 0.35
0.50 0.30
0.45 0.25
0.40 0.20
2008
2009
2010
2011
2012
2013
2014
2015
2016
2017
2018
2008
2009
2010
2011
2012
2013
2014
2015
2016
2017
2018
Note: OECD = 15 Member States for which data are Note: OECD = 15 Member States for which data are
available. available.
Source: OECD, Income distribution and poverty dataset. Source: OECD, income distribution and poverty dataset.
4.3. Impact of the tax and welfare system
The extent to which taxation and welfare respectively contribute to the narrowing of income inequality
in Ireland is examined further below.
The difference between the market Gini and the disposable income Gini is decomposed into the
difference arising from taxation and from welfare (figure 5A). The data show that, in 2018 (the most
recent year for which data are available), Ireland’s welfare system made a greater contribution than the
tax system in reducing income inequality.
This feature is also common across the OECD (figure 5B), where the latest data (again, 2018) show
that Ireland recorded the third largest absolute reduction (0.23) in the Gini between market and
disposable income; only in Finland and Belgium did the tax and welfare system have a greater impact.
One-third of the reduction in Ireland was attributable to the tax system, a proportion exceeded in only
three OECD countries (i.e. Israel, Australia and Canada). Notably, the absolute size of the reduction in
inequality in the Irish Gini due to tax has remained the largest in the OECD each year since 2009.
The OECD has not yet published Gini data for Ireland for 2019. However, Irish SILC (Survey on Income
and Living Conditions) data suggest that this trend of progressivity was maintained in 2019. These data
show that the absolute reduction in the Gini between market income and disposable income was also
Beyond GDP - quality of life assessment page 150.23.24 Of this, 0.15 of the reduction is attributable to welfare measures and 0.08 of the reduction is
attributable to tax measures. Overall, the Irish SILC trends relatively similar to the OECD data overtime.
However, slight differences in the data mean that a direct comparison between other OECD countries
for 2019 and the Irish SILC data for 2019 would not be completely accurate and so is not undertaken
in this analysis.
Figure 5: the composition of the Gini coefficient
A: from market to final income Gini in Ireland B: from market to final income Gini in OECD (2018)
Redistribution due to Welfare Redistribution due to Tax
Market income Welfare Distribution Tax Redistribution Final Gini
0.00
0.7
0.6
-0.05
0.5
-0.156
0.4
0.3 -0.10
0.2
0.1
-0.15
0
-0.1 -0.072
-0.20
-0.2
-0.3
-0.25
-0.4
FI
BE
IE
FR
AT
EL
DE
PT
SI
CZ
IT
ES
LU
PL
NO
JP
SE
SK
UK
LT
EE
AU
LV
CA
IL
TR
CR
2004
2005
2006
2007
2008
2009
2010
2011
2012
2013
2014
2015
2016
2017
2018
Source: OECD, Income distribution and poverty dataset. Note: OECD = 27 member states for which data available.
Source: OECD, income distribution and poverty dataset.
This is consistent with the progressivity of the Irish income tax system, which ensures that the burden
of taxation falls most heavily on those with a higher ability to pay. In 2022, it is projected that 34 per
cent of income earners are exempt from income tax and about a quarter (23 per cent) are liable for the
higher rate of tax. In addition, it is estimated that the top 1 per cent of income earners, those earning in
excess of €250,000 will pay 22 per cent of the total income tax and USC collected. While those earning
less than €56,000, which represents the bottom 75 per cent of income earners, will contribute only 18
per cent of total income tax and USC receipts.25
4.4 Income tax progressivity through the prism of the ‘tax wedge’
The so-called ‘tax wedge’ is a key determinant of labour demand and supply decisions of businesses
and individuals respectively. It represents a measure of labour income that includes the tax paid by
both the employer and the employee, and removes benefits received, expressing these as a share of
total employer costs. A lower tax wedge implies a lower income tax burden or lower social security
contributions.26
24 Source: CSO Survey on Income and Living Conditions, available at:
https://www.cso.ie/en/statistics/socialconditions/surveyonincomeandlivingconditionssilc/
25
See Tax Strategy Group (2022), Income tax paper (22/02), available at: https://assets.gov.ie/231219/b4d0165d-044f-4b22-
893c-7be810701352.pdf
26
When pre-tax income does not change, a lower income tax burden implies that the individual, or unit, pays proportionally less
in income tax. A higher income tax burden implies that they pay proportionally more in income tax.
Beyond GDP - quality of life assessment page 16You can also read