Broken eels in the Dutch part of the river Rhine
←
→
Page content transcription
If your browser does not render page correctly, please read the page content below
Broken eels in the Dutch part of the river
Rhine

Name: Benjamin Peters

Supervisor: Leo Nagelkerke (AFI-WUR) &
Jeroen Tummers (RAVON)

Reg.nr. 920913649110

MSc Internship nr. I0695

December 2020

AQUACULTURE AND FISHERIES GROUP
LEERSTOELGROEP AQUACULTUUR EN
VISSERIJ

Departement of Animal Sciences
Aquaculture and Fisheries Group
De Elst 1, 6708 WD Wageningen
The Netherlands
Tel:    +31 (0) 317 483307
Fax:    +31 (0) 317 483937
Broken eels in the Dutch part of
         the river Rhine
                               RAVON Internship Report

                         AUTHOR: BENJAMIN PETERS 920913649110
                         RAVON SUPERVISOR: DR. JEROEN TUMMERS
                          WUR SUPERVISOR: DR. LEO NAGELKERKE
              INTERNSHIP MSC AQUACULTURE AND MARINE RESOURCE MANAGEMENT
                                       AFI-70424
                                    NOVEMBER 2020

Niets uit dit verslag mag worden verveelvoudigd en/of openbaar gemaakt door middel
van druk, fotokopie, microfilm of welke andere wijze ook, zonder voorafgaande
schriftelijke toestemming van de hoogleraar van de leerstoelgroep Aquacultuur & Visserij
van Wageningen Universiteit.

No part of this publication may be reproduced or published in any form or by any means,
electronic, mechanical, photocopying, recording or otherwise, without prior written
permission of the head of the Aquaculture & Fisheries Group of Wageningen University,
The Netherlands.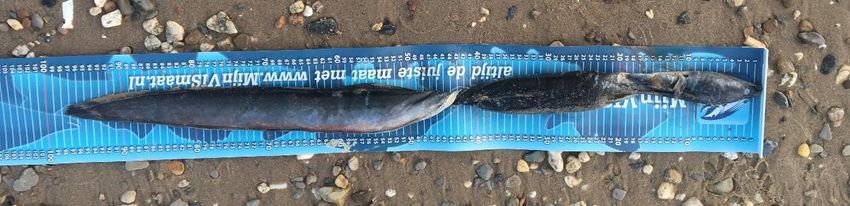
1. Introduction
 I wanted to perform my internship at RAVON (Reptile, Amphibian & Fish
 Conservation Netherlands), because RAVON is an NGO that is engaged in the
 conservation of the Dutch flora and fauna. I wanted to determine if working at an
 NGO, like RAVON, is a career goal for me. I heard about RAVON during my first year
 in my BSc Biology, when I wrote a piece of a group essay for an ecology course
 about the fire salamander (Salamandra salamandra) and the fungus
 Batrachochytrium salamandrivorans. When I started my study MSc Aquaculture &
 Marine Resource Management I followed a variety of ecology and aquaculture
 courses, because I did not know which direction I wanted to head into. Then I
 decided that aquatic ecology is where I want to go with my career. But even this is
 a very broad field of science with a lot of different directions to take for possible
 careers. Because I am interested in fish, amphibians and reptiles in general, RAVON
 seems like a good choice to start to look for what it takes to be an ecologist at an
 scientific NGO that specializes in ecology.

 The European eel (Anguilla anguilla) is categorised as critically endangered by the
 International Union for Conservation of Nature (IUCN) (Jacoby & Gollock, 2014).
 The European Union adopted a Council Regulation (European Eel Regulation; EC no.
 1100/2007) to aid the conservation and recovery of European eel stocks (European
 Council, 2007). This regulation imposes a management system that ensures 40
 percent escapement of the spawning stock biomass, which is the number of fish
 that is allowed to escape from freshwater to spawn, defined as the best estimate of
 the theoretical escapement rate where the stock is completely free of anthropogenic
 influences (European Council, 2007). RAVON is one of several organisations that
 investigates the decline of the European eel (Anguilla anguilla) in the Netherlands.
 I wrote my MSc thesis on windows of opportunity and passage behaviour of silver
 eel at migration barriers in a highly regulated water system. Hence, I was already
 interested in and aware of conservation problems for the European eel. The
 European eel is an important commercial species and because of its high socio-
 cultural value in multiple European countries (van den Thillart, 2014).

 During my internship I wanted to learn more about the conservation of the European
 eel, by participating in the collection of data, data analysis, communication with
 volunteers involved in the research project and by participation in discussions.
 My main research question to be addressed consisted off:
 ‘What is the correlation between eels washing ashore on the banks of the river Waal
 and shipping intensity on the river Waal?’.

 My secondary research questions to be addressed consisted off:
    • ‘Where do eels wash ashore on the banks of the river Waal?’
    • ‘When do eels wash ashore on the banks of the river Waal?’
    • ‘What is the relationship between the weight and the length, Fulton’s
       condition factor, of the eels that wash ashore on the banks of the river Waal?’
    • ‘At what hours do volunteers visit transects and at which hours do they find
       most eels?’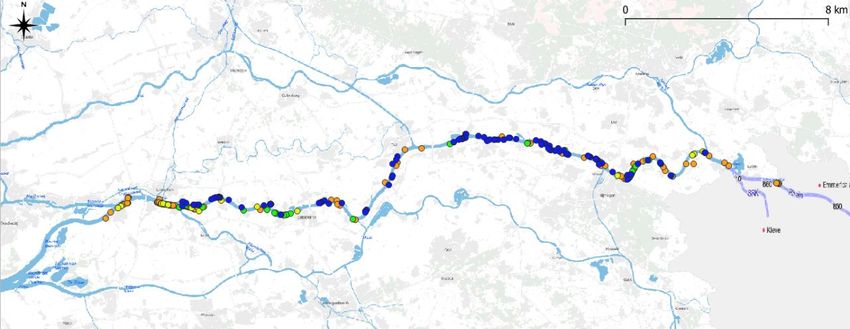
2. Description of personal learning outcomes
 My learning goals consist of both technical learning goals and personal learning
 goals.

 •   One of my goals was to acquire further skills in RStudio to for data analysis.
     During my thesis I already learned about some possibilities for data analysis in
     RStudio, which may be further developed by working with researchers making
     use of RStudio. I have developed my own style in how to structure R-scripts and
     how I store the files I use, but this could use some improvement as it is
     sometimes lacking a clearly organised structure. I also wanted to become
     familiar with GIS (geographic information system) to perform analyses on
     spatial data, an approach I have not used before. To create an overview of
     locations where eels were found and potential in-river structures which may
     have caused death, different layers of spatial data needed to be plotted in the
     same map. I also wanted to be able to measure distances between points over
     the course of waterways. This is necessary to determine how far the eels have
     drifted downstream from possible locations where they could have been injured.
     To achieve this goal, I will discuss my progress in the biweekly meetings with
     the team and meetings with my supervisor to receive feedback, tips and tools
     to improve my work. At the end of my internship I want to be able to handle the
     datasets in both R and QGIS, present insight in what the data looks like and
     perform analysis on the data.

 •   Another goal was to communicate with the volunteers involved in the Knakaal-
     project and those who submitted their observations via the email address
     knakaal@ravon.nl. To do this, the communication needed to be informal,
     enthusiastic, and without jargon, following the standards RAVON uses to
     communicate with their volunteers. The aim for this communication was to
     obtain all the necessary information we need to make the observation as
     complete as possible and maintain a friendly relationship with the citizen
     scientists involved in the project. I believe communication that is received as
     pleasant helps to motivate (potential) volunteers to increase their effort.
     Furthermore, you may lose participants completely if the communication is
     lacking. I have the tendency to be short and formal when writing emails. This
     would be considered unenthusiastic or maybe even unfriendly, even though it
     was not sent with the intention to be rude, which may hinder successful
     recruitment of new volunteers and demotivate currently active volunteers. To
     achieve my goal in being an efficient contact for the project, I have to ‘loosen
     up’ and write more elaborate, enthusiastic mails than I normally do in order to
     come across as thankful for the help people offer us by sending their
     observations and to promote positive energy, so they will help us again in the
     future.

 •   I wanted to learn how to identify different kinds of fish species in the field. My
     knowledge of the different fish species that inhabit Dutch freshwater systems
     was poor. RAVONs work is not restricted to European eels, but involves a broad
     range of taxa that inhabit areas in which they undertake research, among which
     designated Natura2000 areas. During courses of my study I have learned to
     identify fish, but these were dead and out of their natural habitat. I think it is
     good for me as a future ecologist to have some practical experience in catching
     and identifying fish species you can encounter in Dutch water systems. And also
     to become familiar with surveys undertaken by RAVON.

 •   I wanted to learn what aspects of working at an NGO, like RAVON, are important
     to me for my career as an ecologist. I believe to learn this by participating in
     social events organised within RAVON, by working at the office as much as
     possible and by participating in conversations with people working at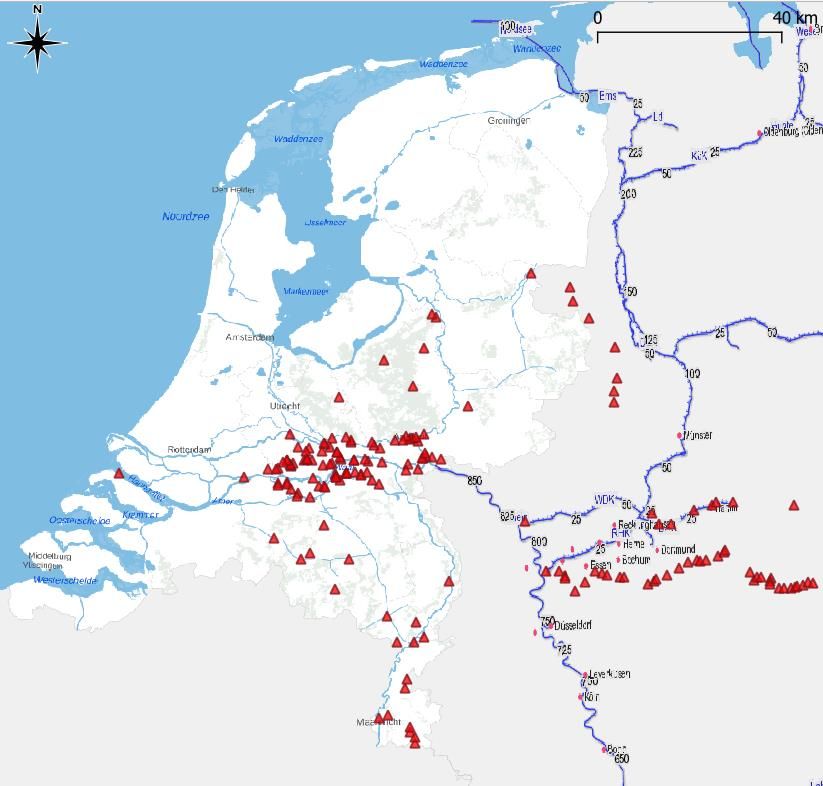
Natuurplaza. After my internship I want to be able to identify which aspects of
    working at an NGO I am looking for in my future career, like work atmosphere,
    internal culture, variation in different projects, and both the scientific and
    societal relevance of studies.

3. Description of the host organisation
 RAVON (Reptile, Amphibian & Fish Conservation Netherlands) is an non-
 governmental organization (NGO) over 2000 volunteers and 65 staff members of
 staff at offices in Nijmegen and Amsterdam (https://www.ravon.nl/Over-
 RAVON/Organisatie) (Figure 1). It is one of several NGOs engaged in the
 conservation of the Dutch flora and fauna. RAVON operates independently, but also
 collaborates on projects. They are involved in increasing public awareness and the
 conservation of reptile, amphibian, and fish species in their habitats. RAVON is
 primarily financed by their consultancy work for a wide variety of clients, including
 governmental organizations, water authorities, land managers and private
 companies. Their advice concerns species occurring in locations ranging from nature
 reserves to urban environments.

 Figure 1: Organisation Structure RAVON, size of parts between brackets.

 To increase public awareness, RAVON developed education packages, courses, and
 recognition cards. By educating wildlife volunteers and people who encounter these
 species in their line of work, RAVON creates better understanding and therefore
 better protection for the conservation of nature. They make scientific literature
 accessible to land managers and others working in the field by putting the
 information into a practical context. RAVON also has a quarterly magazine, folders,
 booklets apps, and articles on the internet with a range of topics.

 RAVON is organized into regional working groups or species specialist groups and
 is almost completely depended on their volunteers for collecting data or carrying
 out conservation measures. The staff members keep in touch with volunteers for
 coordinating projects, for training and for personal contact. RAVON’s extensive data
 bank contains records from all over the Netherlands, with observations from both
 staff members and from volunteers, which are stored in the National Databank Flora
 and Fauna (NDFF). The internet sites www.telmee.nl and www.waarneming.nl
 function as portals for the NDFF through which the observations are sent. The NDFF
 offers insight in the exact location of protected and endangered species. Records
 are validated by staff members, and the standard of the volunteer task force is high.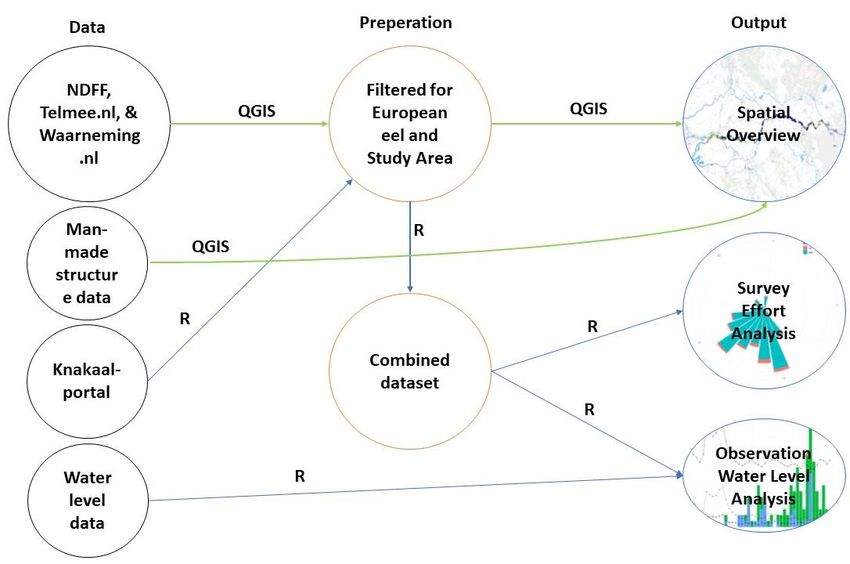
Whenever possible, RAVON collaborates with other organizations working on nature
     conservation, data collection and processing. These include regional nature
     organizations, water authorities, and also commercial bureaus. They are one of
     several research NGOs located in the Natuurplaza in Nijmegen, working in
     partnership with the Radboud University Nijmegen. These NGOs form the
     Netherlands Society for Research on Flora and Fauna, SoortenNL. SoortenNL and
     Species Protection Netherlands are both discussion partners for the Dutch
     government with regard to species conservation. RAVON also creates platforms with
     local players, such as farmers, land owners, water boards, and conservationists to
     help come to agreements about management. The results of their fieldwork are
     shared with policy makers and land management organizations so that they can be
     taken into account. In this manner, RAVON influences both regional and national
     policy to achieve their goal: to increase the number of sustainable populations of
     reptile, amphibian, and freshwater fish species in the Netherlands.

     RAVON is not restricted to the Netherlands, but also takes part in projects with
     universities and research institutes abroad, sister organizations in Europe, including
     the Societas Europaea Herpetologica (SEH) and the European Pond Conservation
     Network (EPCN). RAVON is an active member of the International Union for the
     Conservation of Nature (IUCN).

     Comparable organisations in the Netherlands are the environmental consultancies
     natuurbalans and AT-KB (AquaTerra-KuiperBurger). Where RAVONs expertise is
     restricted to reptiles, amphibians and fish, these consultancies have more species
     in their inventory. Natuurbalans studies insect, mammal and plant species on top
     of reptiles, amphibians and fish. AT-KB’s scope is less aimed at species, as they
     study topics like aquatic and terrestrial ecology, soil and water and geo-physical
     studies. Natuurbalans is smaller than RAVON with only 18 employees and AT-KB is
     bigger than RAVON, as they have more than 120 employees. A big difference is that
     RAVON is dependent on their volunteers for doing surveys and these consultancies
     do their surveys themselves. RAVON also invests a lot in education and public
     awareness compared to these consultancies.

  4. Description and reflection on the (academic)
     value of the work
4.1. Literature
     To build up a literature library for the project, I used literature I already had
     gathered for my MSc Thesis and selected those articles that concerned the effects
     of pumping stations, hydroelectric water stations, and shipping. Two previous
     RAVON interns had also used some papers for their literature study, so I used their
     list and added those articles that I did not have already and were relevant. I also
     used Web of Science to get the newest relevant publications for the literature
     library. The library contained 20 PDF-files of relevant articles and a Word copy of
     the literature list the two previous interns made. Papers that were present in the
     library and in this literature list were given a green colour in the literature list. This
     library is useful for new interns that have to get acquainted with the subject, as it
     saves them time to find literature themselves.

4.2. Observations
     In a collaborative project between RAVON and Sportvisserij Nederland (the Dutch
     Angling Association), volunteers undertake bankside walkover surveys to obtain
     observations of washed up injured or dead eels on the river banks of the rivers
     Boven-Rijn, Waal, Boven-Merwede, Nederrijn, IJssel, and Meuse in the Netherlands,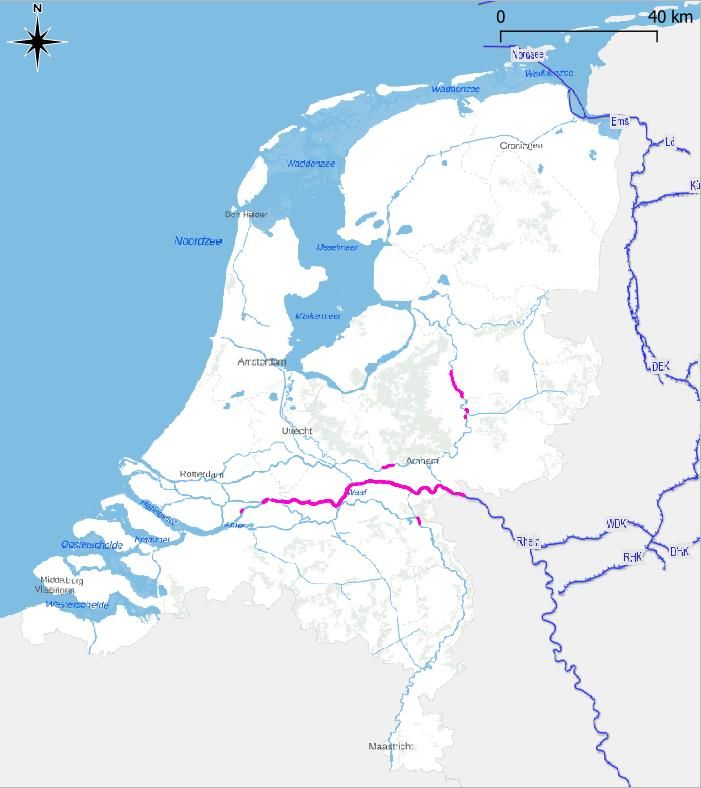
where the main focus lies on the three first mentioned rivers. This study is part of
Niels Brevé’s PhD research to reintroduce European sturgeon (Acipenser sturio),
where European eel serves as a proxy for European sturgeon. The goal of this two
year lasting project is to estimate how many broken eels other fish species wash
ashore on the river banks and to identify the cause of their mechanical injuries.

Most studies focussed on pumping stations and hydropower plants as causes of
mechanical injuries in European eels (Winter et al., 2006, 2007; Jansen et al., 2007;
Calles et al., 2010; Buysse et al., 2014; Økland et al., 2017, 2019). As a result of
these injuries, eels appear to be broken, hence the Dutch name ‘knakaal’, as shown
in Figure 2. Even though hydropower plants are absent on the Dutch part of the
Boven-Rijn and Waal river, broken eels are still found in these parts as well.
Therefore, the hypothesis is that shipping intensity on the rivers is one of the causes
for eels get injured and wash ashore broken on the river banks (Brevé et al., 2019).
So far, no study was done to investigate the effects of shipping intensity in the big
rivers on mortality rates of European eels.

Figure 2: Broken eel found by RAVON-volunteer Geert Stoltenberg.

Observations are done by a group of almost 50 volunteers, by 2 trainees, 3 interns
and one staff member over more than 1000 different transect along the big rivers,
shown in Figure 3. Most of these transects are banksides consisting of groyne fields.
To do these observations each person is equipped with a field kit and a protocol.
The field kit contains a plastic container with 20 Eppendorf tubes filled with ethanol,
a pencil with sharpener, a scissor and scotch tape to take DNA samples from the
fish. A digital weighing hook and plastic bags to determine the weight of the fish. A
measuring tape to obtain the length of the fish. Plastic gloves to handle the fish, an
observation form to fill the measurements and identification key to find out which
species the fish is.
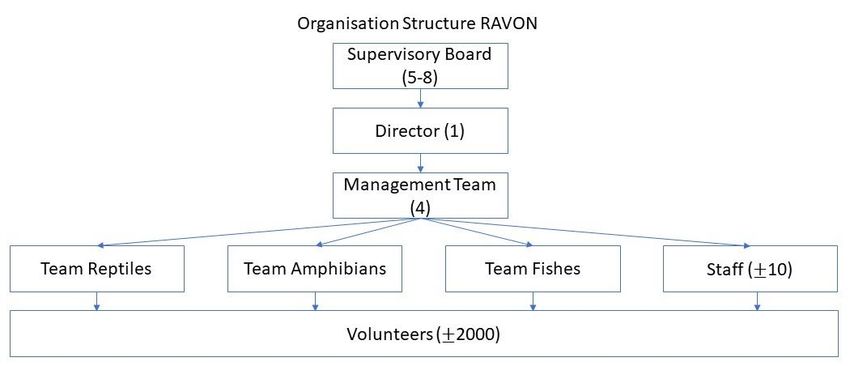
Figure 3: Map of the Netherlands. Transects where volunteers perform walkover surveys on
the riverbanks are shown in pink.

The volunteers are asked to take a picture when they enter a transect. From these
pictures we can see what the transect looks like, if there is a lot debris washed
ashore that moment, if the water level is low or high etc. The starting time is noted
and then the volunteer undertakes the walkover survey to find any fish washed
ashore. If no fish is found the volunteer notes down the end time of the search and
absence of species. It is important to record walkover surveys that recorded the
absence of species to estimate the survey effort invested.

If the volunteer finds a fish, pictures are taken from it in the place it is found, from
all sides and detailed pictures from any injury. The fish is identified and its length
is measured in centimetres with the measuring tape, a picture of the fish on the
measuring tape is taken as proof. To determine the weight in grams of the fish, the
fish is put into a plastic bag and hung on the digital weighing hook. The weighing
hook provides the weight in kilograms, so the number on the display has to be
multiplied with 1000 to be converted into grams. For eels, a DNA sample is taken
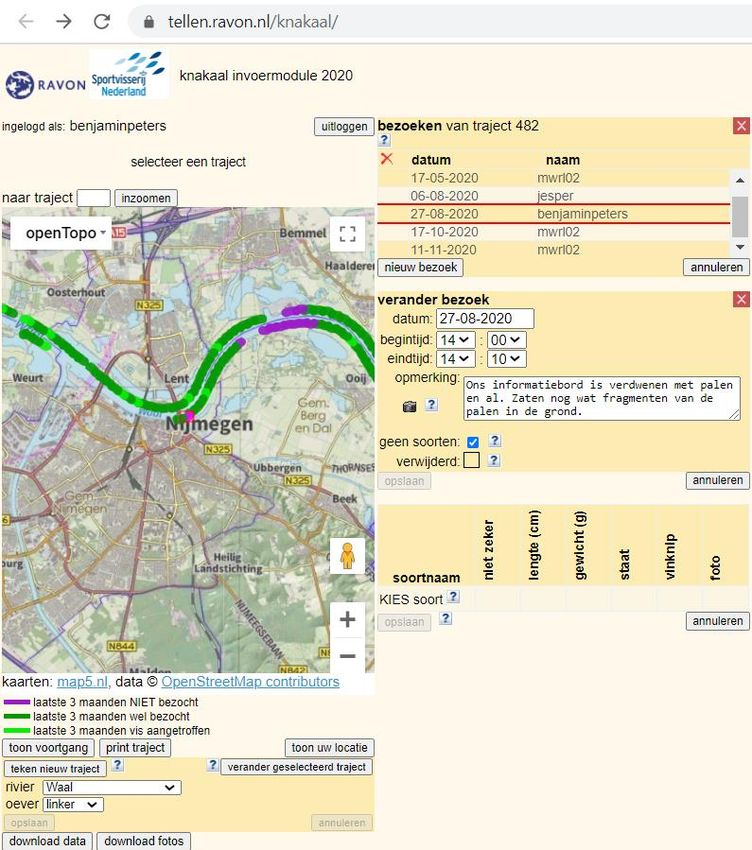
by clipping the tip of the caudal or dorsal fin of 0.5 cm by 0.5 cm. This is put into
an Eppendorf tube filled with ethanol and labelled with a unique code. The unique
code is the date of the observation (yyyymmdd) – the initials of the volunteer – the
number of DNA samples taken that day by this volunteers. For example; I found
my 3rd eel on 12 November 2020. The code I put on the label of this DNA sample
will be 20201112-BP-3. DNA samples are stored in a paper envelope in the freezer
at the volunteers home. After all measurements are done, the eel is displaced
further up the river banks or buried to avoid duplicate observations. This is done
for every fish the volunteer finds on the transect. After that the end time is noted.

All observations are uploaded in the knakaal-portal on tellen.ravon.nl/knakaal/, as
shown in Figure 4. Volunteers have an account to log in. Here they upload in each
transect they visit; the date, begin and end time, remarks if there was anything
special to mention, the pictures of the transect. If no fish were found the box “geen
soorten” is checked to indicate that no species were found. If there were fish found,
for each fish the exact location, pictures, which species, length, weight, condition
and the code on the label of the DNA sample are uploaded. If all these factors are
filled in, the observation is complete for that transect.

Observations sent to knakaal@ravon.nl originate from those who are no volunteers
of the knakaal project. These people were aware of the study through
advertisements on social media, communication to members within RAVON and the
Dutch Angling Association, articles in the regular media and information signs. Most
of these observations were incomplete, so more information would be asked from
these people by replying at their email. Information like the exact location, moment,
approximate length and if they had seen any injuries on the fish. These observations
were less detailed than those made by the volunteers and were uploaded in
Telmee.nl.

Transects were also visited by myself using my field kit, a pioneer shovel and
binoculars. While I visited 42 transects, no fish were found during those surveys.
On 30 June I was informed by email that 69 eels were washed ashore on the banks
of a waterbody connected to the river Waal at Hellouw. When I got there, I found
56 eels at the site. I took pictures of all of the and took measurements of 15 of
them. Three of these were stored in the freezer at RAVON, after which DNA samples
were taken of these three. None of the 56 eels I found showed injuries indicative of
a broken eel. Due to the conditions these fish were found in we expect they were
not the victims of mechanical injuries but the result of poaching. These were the
only dead fish I have encountered myself along the river.

Miranda Maybank, who works for the AFI-group at WUR, also offered to be a
volunteer for the knakaal project. As the protocol is written in Dutch, I met with
Miranda on 2 September. Walkover surveys were done on the river Nederrijn near
Wageningen, where I explained her how we do our observations and what we expect
from volunteers.
Figure 4:Overview of the knakaal-portal.

4.3. Data management & Analysis
    I had 4 datasets with observations of broken eel; data from the portal, data from
    Telmee.nl, all dead eel observations from 2020 from Waarneming.nl, and a dataset
    from NDFF containing injured fish observations between 2009 and 2019. These
    datasets included data on the exact location where the eels where found, the date
    of the observation, and who made the observation. The dataset from the portal also
    included the name of the river where the observations was made, the time at the
    moment of the observation, length and, weight. The latter two were not measured
    in all observations.

    All these observations were uploaded in QGIS. Just like the dataset of the pumping
    stations and hydropower plants provided by one of the other interns, Annemijn
    Sandig (Figure 5). QGIS is a professional geographic information system application
    that is built to be free and open source software. The PDOK-plugin (Publieke
    Dienstverlening Op de Kaart) service within QGIS was used to obtain maps of the
Dutch waterways, the locations of the kilometre markings and all floating and stationary waterway markings. PDOK is the leading platform for high-quality geodata in the Netherlands. To get GIS data of the German part of the Rhine I visited the website of the German cartography and geodata authorities, and the German water and shipping administration. They provided WMS services that allow me to use their servers to get the data about the German part of the Rhine. To filter the data to only contain observations from the study area, I drew a polygon in the shape of the study area and made new data sets out of each data set that only included observations that had coordinates in this polygon and were observations of eel ( Figure 6). For analyses of nongeographic information in the data, like datetime data and the amounts observed per week, I used RStudio. RStudio is an integrated development environment for R, a programming language for statistical computing and graphics. Just like QGIS it is built to be free and open source software. I used it to combine the different datasets with observations. To combine them I had to change names of columns, names of values within the data and the data types that were administered to them in the original sets. I made graphs about the number of observations per week for each dataset, both with all species and 0 observations, and with only eel. I also incorporated data concerning the water level of the river Waal in the bar graph of the knakaal portal, with a second y-axis. This gave insight in if there is any correlation between the water level in the river and the amount of fish observed. I also made graphs of the times at which volunteers do their observations, making distinction between when they found fish and when they did not observe any fish. These graphs gave insight in what the effort was the volunteers were giving per week and if they needed some inspirational words for them for put up a notch to increase their effort. They also gave insight in at which hours of the day the volunteers were visiting their transects. This information can also be used to make an attempt to maximize the amount of broken eels found as they might have been disappeared by the activity of scavengers at the time the volunteers arrive to observe. I also calculated Fulton’s condition factor (K= W x 100/L^3) for the eels we had data on both their weight and length and put this in a graph. It is questionable how useful this information is as the weight and length are affected by decomposing and the activities of scavengers, which is hard to assess how much this affects these values. All in all, my work gave insight in what the data looked like from week to week. It gave indications if it was necessary to influence the effort that was put into the project by the volunteers. To illustrate the connections between data and analysis performed I made a flowchart, see Figure 7.
Figure 5: Locations of pumping stations and hydropower plants in the dataset made by
Annemijn Sandig plotted in QGIS.

Figure 6: Locations of eel observations extracted from 4 different datasets in the rivers Boven
Rijn, Waal, and Boven-Merwede. 116 Knakaal-portal (blue), 34 Telmee.nl (green), 24
Waarneming.nl (yellow), and 130 NDFF (orange).
Figure 7: Flow chart Data Management & Analysis.
4.4. Communication
Good communication is paramount to get as many observations as possible from
volunteers and occasional observers. Especially in these strange times with Covid-
19 and no opportunities to physically meet in groups. During the internship I
handled most of the communication towards the volunteers and other people who
had reported observations of broken eels to us. I replied to emails of at least 55
different observers, that were not part of the volunteers and sent us single
observations, to thank them for their help and to acquire more information about
the nature of their observation, like the exact location, the approximate length and
if they noticed any injuries or other remarkable details. I also asked them how they
got in acquainted with the study to get information on how effective the different
approaches to spread information about the ongoing study are, and if they found
any more broken eels that they send us the pictures and information and if they
could put the eels higher on the riverbanks to avoid them getting counted twice.
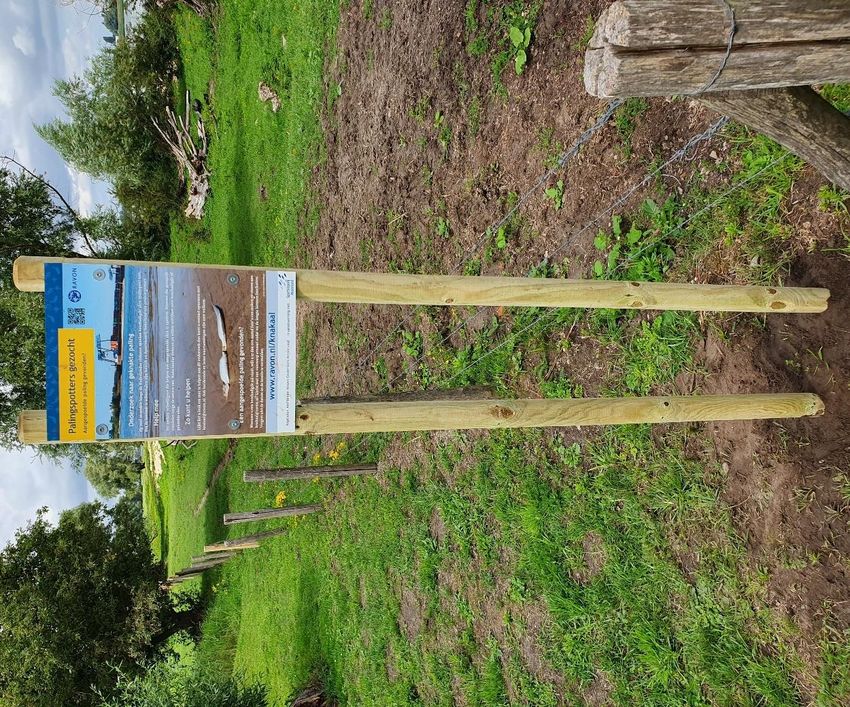
To reach people who visit the river and inform them about the broken eel study, I
placed a total of 6 information signs at frequently visited places along the Waal
river. I placed one at Slot Loevestein, Gameren, Nijmegen, Fort Pannerden, and
Deest. Each information sign was attached to two 240 centimetres long wooden
poles that were dug in at least 50 cm into the ground, as shown in Figure 8. The
information sign in Nijmegen had to be replaced as it was removed with force. I
noticed this when I visited the transects there. By employing these signs we
received extra observations of people who were in the area and read our call for
help. Pictures of these were posted on Facebook by RAVON as part of a prize quiz.
Identification keys for fresh water fish species were raffled amongst replicants who
knew what the location of the information sign was.Figure 8: Broken eel study information sign placed near Slot Loevestein. I provided new volunteers with field kits by sending them a package by mail or by bringing them the field kits personally if they lived in Wageningen. I ensured that they knew what was expected from them and that they knew what was in the kit and how they use it. Inactive volunteers were contacted by mail and by phone to gain insight into the reasons for not having done any surveys lately, and to gauge interest rate. I provided volunteers that needed new materials for their field kit with new one by sending the material by mail. Volunteers that had problems with the portal or other issues I helped by explaining them how to fix their issues and by reporting their problem. RAVON staff member Jesper Berndsen was in charge of the monthly mail to volunteers, but in his absence another intern took over while I improved the content before sending. In this mail we explained what the observations for that month look like, some inspirational words and other useful information, like if they ran out of Eppendorf tubes to contact us get new ones sent to them. All communication by mail was documented and saved as PDF files on the knakaal projects server within RAVON. I helped Jesper in revising the walkover survey protocol for the broken eel study. Jesper sent me his revised version, which I carefully read and provided with feedback. The feedback included grammar and formulation correction as well as suggestions for elaboration.
4.5. Other fieldwork
    On 19 August 2020, I joined Jesper Berndsen to help him catch fish and
    salamanders to evaluate the fish community composition in the Natura2000 area
    near Slot Loevestein, between Woudrichem and Brakel. RAVON keeps track of some
    protected species occurring in this area to evaluate their populations. The species
    that we were looking for were European bitterling (Rhodeus amarus), weatherfish
    (Misgurnus fossilis), spined loach (Cobitis taenia), and great crested newt (Triturus
    cristatus). We used landing nets to catch fish for 15 minutes per transect. Jesper
    showed me the best technique to catch fish with the net. The fish we caught were
    put in buckets and identified using identification keys. The catch consisted of pike
    (Esox Lucius), perch (Perca fluviatilis), tench (Tinca tinca), Ide (Leuciscus idus),
    European bitterling (Rhodeus amarus), spined loach (Cobitis taenia), round goby
    (Neogobius melanostomus), western tubenose goby (Proterorhinus semilunaris),
    three-spined stickleback (Gasterosteus aculeatus), and sunbleak (Leucaspius
    delineates). We did not find any weatherfish, because the transect they were
    supposed to be was dried up. And unfortunately also no great crested newt, but
    Jesper ensured me that they are hard to catch. Chance of them escaping the net
    are considerable due to the large quantities of underwater vegetation.

  5. Self-reflection
    •   I wanted to learn more skills in RStudio to enhance my data analysis skills.
        During my internship I have put most data sets we used into an R-script. To
        make them compatible with each other I had to make some adjustments so the
        data could be combined. These adjustments were datetime related, where the
        way they were noted differed, or missing columns, for example the number of
        fish found in one observation, or columns with the same information having
        different names. These were things that I was already familiar with, but some
        of lines of code I normally use did not work. So I had to find some new ways to
        get the result I aimed for. I had never made plots with 2 y-axis before, nor polar
        plots. I used different YouTube tutorials that where specific to the problems I
        wanted to solve and used the internet site stackoverflow.com to find information
        related to the tasks I wanted to accomplish. By accomplishing this I achieved
        the skill to plot 2 datasets with one common variable in it, for example the
        amount of eel observed per week and the average water level per week in one
        figure. I received feedback in the biweekly meetings on my plots and used this
        to how to improve them. I also received feedback on how I could improve my
        organisation of the files I used. By better organising my files, it was immediately
        clear what files I used and where to find them. Niels Brevé gave me great
        feedback in how to organise my data and R-scripts in order to make it possible
        to copy the whole folder to another device and be able to use them with as little
        necessary changes as possible. This makes it easier and accessible for a
        successor to build upon the progress I already made, which is of great value for
        working in a team.
        I wanted to get familiar with QGIS to perform analyses on spatial data. During
        my internship I have put all eel survey data sets we used into QGIS. I also used
        services like the PDOK plug-in to obtain spatial data, like the locations of the
        kilometre markings in the rivers. I asked for help with my analyses to measure
        distance between point over the course of the river downstream. Someone
        within RAVON send me a link to a website that could be useful, but unfortunately
        the proposed method did not work with the data I was working with. I believe I
        have learned the basics of working with QGIS, but I did not manage to measure
        the distance between two points over the course of the river with the datasets
        I had. That goal was, in hindsight, too complex to achieve on top of mastering
        the basics of the program. I found out by experimenting , that I can use QGIS
        to select data points within a polygon to filter for geographic locations given
        with coordinates only. I believe this to be a very useful skill for my future career.
• I wanted to be clear and friendly in my communication towards the volunteers
involved in the Knakaal-project and people who submitted their observations
via the email address knakaal@ravon.nl. Jesper Berndsen is the staff member
within the knakaal project who normally communicates through the knakaal
email address to the volunteers and occasional observants. To figure out how
he communicates with volunteers, I read some of his sent emails and discussed
with him on what he thought was the way to communicate. He likes to be
informal and enthusiastic in his communication towards the volunteers. He had
made example emails on the Google Drive we worked with to use as some
guidance.
At first I copied his example emails almost word for word when I replied to
emails, making just a few alterations to them before sending them. I thought
too hard about it and was worried I would make mistakes. I made sure I knew
what emails were send to these addresses already to make sure they did not
receive almost identical email twice, which could have given them the idea that
we just copy-pasted all responses if we did. I was kind of tense about answering
the knakaal address, but the more emails I answered, the less dependent I got
on these examples to help me and eventually I had fun with it and was able to
reply more easily and with more confidence. I recognized people who already
mailed us before and did not have to research what contact we had before.
I also contacted 8 volunteers who were inactive for some period, using the
phone at the secretary of RAVON to do this. At first it felt unnatural to call
somebody and to have a conversation with them about the reasons they had
not reported any observations for a period, comparable with the nerves before
giving a presentation for a group. But after a few calls I got the hang with it. My
aim was to come across as informal, understanding, polite and not judging. I
think I managed to do this, even though one volunteer reacted somewhat
defensive when I asked him how he was doing and if he could tell me if he would
visit some transects in the near future. I think his reaction has more to with him
than with the way I approached him. I wrote small summaries of the calls I had
before calling the next volunteer, to help me remember what was discussed
over the phone.
• I wanted to learn how to identify different kinds of fish species in the field.
During my fieldwork for the knakaal-project I only encountered dead fish, most
of which were European eel. To identify which species I found I used the
identification key provided by RAVON. To also practice this with live fish, where
more distinguishable features are present due to the lack of decomposition of
the fish, I joined Jesper Berndsen, staff member at RAVON, to catch fish and
salamanders to evaluate the fish community composition in the Natura2000
area near Slot Loevestein, between Woudrichem and Brakel on 19 August 2020.
RAVON keeps track of some protected species occurring in this area to evaluate
their populations. The species that we were looking for were European bitterling
(Rhodeus amarus), weatherfish (Misgurnus fossilis), spined loach (Cobitis
taenia), and great crested newt (Triturus cristatus). We used landing nets to
catch fish for 15 minutes per transect. Jesper showed me the best technique to
catch fish with the net. The fish we caught were put in buckets and cuvettes and
identified using identification keys (Figure 9). The catch consisted of pike (Esox
Lucius), perch (Perca fluviatilis), tench (Tinca tinca), Ide (Leuciscus idus),
European bitterling (Rhodeus amarus), spined loach (Cobitis taenia), round
goby (Neogobius melanostomus), western tubenose goby (Proterorhinus
semilunaris), three-spined stickleback (Gasterosteus aculeatus), and sunbleak
(Leucaspius delineates). We did not find any weatherfish, because the transect
they were supposed to be was dried up. And unfortunately also no great crested
newt, but Jesper ensured me that they are hard to catch. Chance of them
escaping the net are considerable due to the large quantities of underwatervegetation. At first I needed the identification key to distinguish the different
exotic gobies, as they look very much alike and there is some differences
between individuals within the species. But after some practice I could tell them
apart pretty quickly.
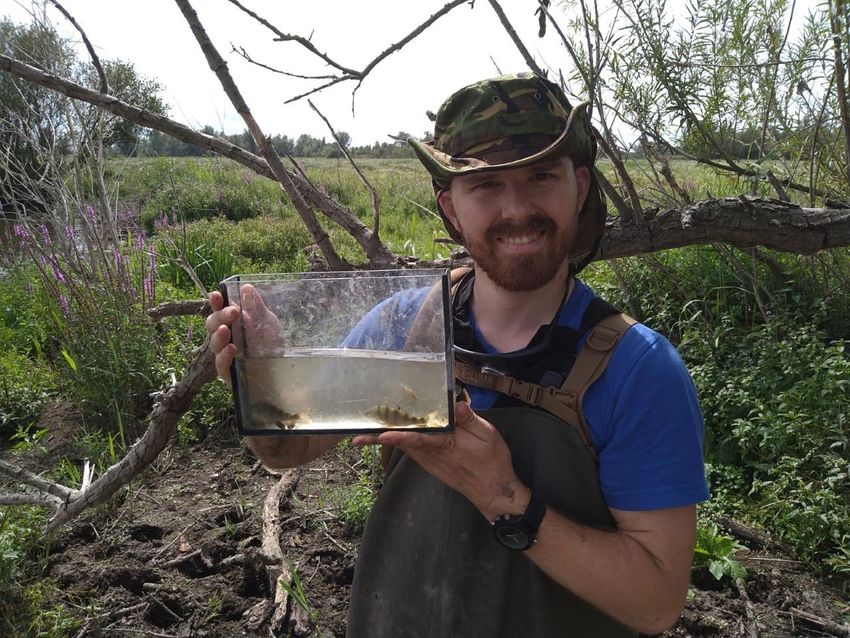
Figure 9: Me, holding a cuvette with a few fish I caught at Slot Loevestein.
• I wanted to learn what aspects of working at an NGO, like RAVON, are important
to me for my career as an ecologist. After my internship I wanted to be able to
identify which aspects of working at an NGO I am looking for in my future career,
like work atmosphere, internal culture, variation in different projects, and both
the scientific and societal relevance of studies. I really enjoyed my internship at
RAVON, even though I did not see that many people I would if there was no
Covid-19 pandemic going on. During my internship I met some nice people at
the Natuurplaza building working for RAVON, FLORON, and the Dutch Mammal
Association (Zoogdiervereniging). I had nice conversations with them during the
lunch, near the coffee machine and when I was working in the library of RAVON.
I participated the RAVON/FLORON games afternoon, where I met some people
I had not yet met in the office. What I noticed was that all these people where
really enthusiastic about their work and also curious about my internship. I like
the culture within RAVON, the respectful way they treated each other and the
way discussions were held. Also the conversations that were not work related
were enjoyable to both be part of and to observe. For me, it is important to
have motivated, enthusiastic people around to have social moments with that
can be both work related and less serious by nature. This helps to motivate me
as well. My girlfriend could tell when I met enthusiastic people and had nice
experiences at RAVON from the energy level and enthusiasm I came home with.
People working on different projects with different species can give each other
great feedback and new insights when they discuss what they are working on
with each other. I think the different projects that RAVON is part of are veryinteresting and relevant for the conservation and restoration of nature in the Netherlands. This is an important factor for me, as it provides me with a feeling I am doing a job worthwhile and making a difference. And the fact that RAVON works together with so many motivated volunteers is great in my opinion. It is a great way to promote public awareness and enthusiasm for nature, increasing the value people credit to biodiversity and the protection of vulnerable species. I used to be a staff member at the Scouting for five years and I really enjoyed the enthusiasm of the children when we went out to catch water creatures and to find out with them what we had caught. I think that the fundamental and applied science in the studies committed by RAVON and their educational work have great value and I would really like to be part of an organisation that provides services like RAVON is. I have identified the following aspects to be important to me and what I’m looking for when working for an NGO: A motivational work environment, diverse specialisations present, relevance to science and society, and collaboration with other organisations to aid in the conservation and restoration of nature.
6. Copy of the report for the host organisation
6.1. Introduction
  The European eel (Anguilla anguilla) is categorised as critically endangered by the
  International Union for Conservation of Nature (IUCN) (Jacoby & Gollock, 2014).
  The European Union adopted a Council Regulation (European Eel Regulation; EC no.
  1100/2007) to aid the conservation and recovery of European eel stocks (European
  Council, 2007). This regulation imposes a management system that ensures 40 percent
  escapement of the spawning stock biomass, which is the number of fish that is allowed
  to escape from freshwater to spawn, defined as the best estimate of the theoretical
  escapement rate where the stock is completely free of anthropogenic influences
  (European Council, 2007).

  In a collaborative project between RAVON and Sportvisserij Nederland (the Dutch
  Angling Association), volunteers undertake bankside walkover surveys to obtain
  observations of washed up injured or dead eels on the river banks of the rivers Boven-
  Rijn, Waal, Boven-Merwede, Nederrijn, IJssel, and Meuse in the Netherlands, where
  the main focus lies on the three first mentioned rivers. This study is part of Niels Brevé’s
  PhD research to reintroduce European sturgeon (Acipenser sturio), where European eel
  serves as a proxy for European sturgeon. The goal of this two year lasting project is to
  estimate how many broken eels other fish species wash ashore on the river banks and
  to identify the cause of their mechanical injuries.

  Most studies focussed on pumping stations and hydropower plants as causes of
  mechanical injuries in European eels (Winter et al., 2006, 2007; Jansen et al., 2007;
  Calles et al., 2010; Buysse et al., 2014; Økland et al., 2017, 2019). As a result of these
  injuries, eels appear to be broken, hence the Dutch name ‘knakaal’. Even though
  hydropower plants are absent on the Dutch part of the Boven-Rijn and Waal river,
  broken eels are still found in these parts as well. Therefore, the hypothesis is that
  shipping intensity on the rivers is one of the causes for eels get injured and wash ashore
  broken on the river banks (Brevé et al., 2019). So far, no study was done to investigate
  the effects of shipping intensity in the big rivers on mortality rates of European eels.

     The main research question to be addressed consisted off:
     ‘What is the correlation between eels washing ashore on the banks of the river Waal
     and shipping intensity on the river Waal?’.

     The secondary research questions to be addressed consisted off:
        • ‘Where do eels wash ashore on the banks of the river Waal?’
        • ‘When do eels wash ashore on the banks of the river Waal?’
        • ‘At what hours do volunteers visit transects and at which hours do they find
            most eels?’
        • ‘What is the relationship between the weight and the length, Fulton’s
            condition factor, of the eels that wash ashore on the banks of the river Waal?’
6.2. Materials and Methods 6.2.1. Datasets For this study, 4 datasets with records of broken eel were used and one dataset with water level measurements at three locations on the Waal river. These datasets with records of broken eel were derived from NDFF, Waarneming.nl, Telmee.nl, and the knakaal-portal. These datasets included data on the exact location where the eels where found, the date of the observation, and who made the observation. The dataset from the portal also included the name of the river where the observations was made, the time at the moment of the observation, length and, weight. The water level dataset was provided by the Dutch Ministry of Infrastructure and Water Management (Rijkswaterstaat) and contained data on the water level at Lobith (Boven Rijn), Zaltbommel (Waal), and Werkendam Buiten (Boven-Merwede) over the period between 1 January 2020 till 1 November 2020. 6.2.2. Observations All observations in the knakaal-portal dataset were made following the instructions in the protocol provided by RAVON and Sportvisserij Nederland (Berndsen et al., 2020). Observations in the NDFF, Telmee.nl, and Waarneming.nl datasets were not made following the instructions in the protocol. Hence, this data did not contain precise length and weight measurements. The observations in the knakaal-portal and the Waarneming.nl dataset were made in 2020. Most observations in the Telmee.nl dataset were from 2020, including one observation from 2012 and one observation from 2018. Observations in the NDFF dataset originate from 2009 to 2019. Most observations were made between week 32 and 39 (N=93). The high amount of observations in week 26 in Telmee.nl was due to 56 eels found near Hellouw. These were not broken eels and therefore not part of any analysis.
Figure 10: Eel observations within the study area in the datasets used. Data from the portal
(green, N=146) and Waarneming.nl (purple, N=27) consist of observations done on 2020.
Telmee.nl (blue, N=96) contained observations from 2012, 2018, and 2020. NDFF (red, N=165)
contained observations from 2009 to 2019.

6.2.3. Data analysis
QGIS version 3.10.11 was used to draw a polygon around the rivers Boven Rijn (upstream), Waal,
and Boven-Merwede (downstream) to select for observations in the study area, as shown in Figure
11, and to filter for observations of European eel in the Waarneming.nl, Telmee.nl, and NDFF
Datasets (QGIS Development Team, 2020). To filter the knakaal-portal dataset for European eel
and the rivers within the study area and the Telmee.nl dataset for the observation of 56 eels at
Hellouw, RStudio version 3.6.1 (R Core Team, 2019) with the R-package tidyverse (Wickham et al.,
2019) was used, see
Figure 12. To get all datetime related data from all datasets in the same format, the R-
package lubridate (Grolemund & Wickham, 2011) was used. The average water level
per week of the rivers Boven Rijn, Waal, and Boven-Merwede were calculated using
RStudio version 3.6.1 (R Core Team, 2019). For time related analysis, the knakaal-
portal dataset was filtered for observations where no time (00:00 h) was documented,
using RStudio version 3.6.1 (R Core Team, 2019) with the R-package tidyverse
(Wickham et al., 2019). To create graphs, the R-package ggplot2 (Wickham et al.,
2019) was used. Pearson’s correlation tests and t-tests were executed, using a level of
statistical significance of P < 0.05, in RStudio version 3.6.1 (R Core Team, 2019).
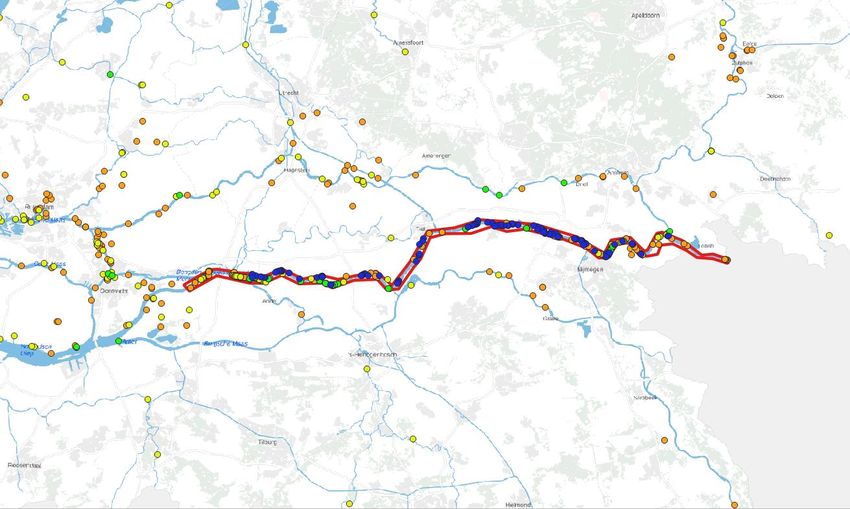
Figure 11: Overview of the study area(red lined polygon) and the unfiltered observations from
   the Knakaal-portal (blue dots), Telmee.nl (green dots), Waarneming.nl (yellow dots), and NDFF
   (orange dots) (QGIS Development Team, 2020).

Figure 12: Eel observations from 2020 in the datasets knakaal-portal (red, N=140), Telmee.nl
(green, N=36), and Waarneming.nl (blue, N=27), January 2020 to November 2020.
6.3. Results
6.3.1.Eel observations & Average water level
       During the study, 46% (N=93) of all observations (N=203) of broken eel were made
       in a 7 week period, between week 32 and week 39. For observations in the knakaal-
       portal dataset, this was 52% (N=73) of all observations (N=140), see Figure 13. In
       this period the lowest average water level, 282 cm NAP in week 38, was measured
       compared to the rest of the year. The average water level during this period was
       308 cm NAP and significantly lower than the average water level from January 2020
       till November 2020 (69 cm, p
The numbers of eels found along the Boven Rijn, Waal and Boven-Merwede and the average water level per week measured of three locations in these three parts of the river were significantly negatively correlated (r=-0.5, p
Broken eels were observed over the whole length of the study area, with the biggest
quantities found near Nijmegen (N=44) and in between Woudrichem and Sleeuwijk (N=75)
(Figure 15).

Figure 15: Geographic overview of eel observations in the study area of the knakaal-portal,
Telmee.nl, Waarneming.nl, & NDFF datasets merged together.
6.3.2.Volunteer Survey Behaviour
       During the study, volunteers were free to survey on what hour of the day suits
       them. 71% of all surveys (N=4016) were done between 10:00 hours and 15:00
       hours (N=2834), during which 72% (N=101) of all broken eels (N=141) were found,
       see Figure 16. Around 22:00 hours relatively most broken eels were found (1/9*100
       = 11%)(Figure 17).

Figure 16: Number of surveys carried out at each hour of the day during the length of the study,
blue indicates surveys where no eels were found, red indicates surveys where eels were found.
Figure 17: Number of surveys carried out at each hour of the day relative to the total number of surveys carried out at those hours during the length of the study, blue indicates surveys where no eels were found, red indicates surveys where eels were found.
6.3.3.Eel Condition Factor
     Weight and length measured for broken eels documented in the knakaal-portal
     dataset were significantly correlated (r=0.3, p
Figure 19: Fulton’s condition factor K (K=W x 100L³) calculated for observations in knakaal-
portal dataset (N=124).
6.4. Discussion
Even though the main research question could not be addressed due to the absence
of a shipping intensity dataset during my internship, the secondary research
questions were addressed.
Broken eels were observed over the whole length of the study area, but there were
locations where bigger quantities were observed. This could be the result of bigger
quantities of broken eels washing ashore on these locations, or of the higher
concentration of observers in these areas. A higher concentration of observers, who
more frequently survey the area could lead to higher quantities observed compared
to area that are surveyed less observers who survey less often. The uneven
distribution of survey-effort over the study area could provide a misleading picture
in the analysis of spatial information of broken eels reported. Due to the size of the
study area and the distribution of observers it is extremely hard to generate these
data without this distributional bias.
Most eels were reported between week 32 and week 39, during low water levels in
the Rhine river, which was also the period in which most surveys were carried out.
This was probably due to the vacation period, giving observers more time to survey,
and the warm, sunny weather which is experienced as pleasant by observers,
increasing the likelihood of more of them to survey during that period. The
distribution of survey-effort in time affects when most eels are observed. This was
also shown with the analysis of the hours at which observers survey.
The relationship between weight and length, Fulton’s condition factor K, is relatively
low due to long, elongated body of the European eel. The results of these
measurements are highly affected by the deterioration process the broken eels wentthrough before they are observed. Weight is lost due to them being partially eaten
by scavengers and rotting processes and length is affected by the increased
stretching of the skin at the parts where underlying tissue is missing and the amount
of times the body of the broken eels are twisted.
To increase the effectiveness of this study, the spatial and periodic distribution of
the walkover-surveys should be better homogenised in order to generate a more
accurate picture of the broken eel situation in the river Rhine. Despite these
challenges, this study is a first attempt and could provide perspective into another
problem the conservation of European eel faces, that has not yet been studied
before. To aid the conservation and recovery of European eel stocks as the European
Eel Regulation; EC no. 1100/2007 (European Council, 2007) to ensures 40 percent
escapement of the spawning stock biomass, the effects of shipping intensity in the
river Rhine on the mortality of the European eel should be further studied in the
near future.
6.5. Acknowledgements
This study was part of an internship at RAVON in a collaborative project between RAVON
and Sportvisserij Nederland (the Dutch Angling Association). The internship opportunity I
had with RAVON was a great chance for learning and professional development. Therefore,
I consider myself as a very lucky individual as I was provided with an opportunity to be a
part of it. I would like to express my gratitude to my host-supervisor Dr. Jeroen Tummers
(RAVON), my academic-supervisor Dr. Leo Nagelkerke (WUR-AFI), and Niels Brevé
(Sportvisserij Nederland) for supervising and guiding me throughout my internship and
providing me with feedback. I would also like to express my gratitude to Jesper Berndsen,
who took me with him on surveys and guided me through my internship with his contagious
enthusiasm. I would like to also express my gratitude to all the RAVON knakaal-volunteers
and everybody who sent observations to knakaal@ravon.nl, who made this study possible
with all their observations.7. References Berndsen, J., Brevé, N., Kranenbarg, J., Minekus, S., Nagtzaam, S. & Tummers, J. (2020) Strandonderzoek Knakaal. Handleiding Voor Het Inventariseren van Beschadigde Vis Langs de Boven-Rijn, Waal & Boven-Merwede. Brevé, N. W. P., Vis, H., Houben, B., Breukelaar, A. & Acolas, M.-L. (2019) Outmigration Pathways of Stocked Juvenile European Sturgeon (Acipenser Sturio L., 1758) in the Lower Rhine River, as Revealed by Telemetry. Journal of Applied Ichthyology 35, 61–68. Buysse, D., Mouton, A. M., Stevens, M., van den Neucker, T. & Coeck, J. (2014) Mortality of European Eel after Downstream Migration through Two Types of Pumping Stations. Fisheries Management and Ecology 21, 13–21. Calles, O., Olsson, I. C., Comoglio, C., Kemp, P. S., Blunden, L., Schmitz, M. & Greenberg, L. A. (2010) Size-Dependent Mortality of Migratory Silver Eels at a Hydropower Plant, and Implications for Escapement to the Sea. Freshwater Biology 55, 2167–2180. European Council. (2007) Council Regulation (EC) No 1100/2007. Official Journal of the European Union 248, 17–23. Grolemund, G. & Wickham, H. (2011) Dates and Times Made Easy with Lubridate. Journal of Statistical Software 40, 1–25. Jacoby, D. & Gollock, M. (2014) Anguilla Anguilla. The IUCN Red List of Threatened Species. Version 2014.2. . Iucn 2014 2014, Downloaded on 26th July, 2014. Jansen, H. M., Winter, H. v., Bruijs, M. C. M. & Polman, H. J. G. (2007) Just Go with the Flow? Route Selection and Mortality during Downstream Migration of Silver Eels in Relation to River Discharge. ICES Journal of Marine Science 64, 1437–1443. Økland, F., Teichert, M. A. K. M. A. K., Havn, T. B. T. B., Thorstad, E. B. E. B., Heermann, L., Saether, S. A., Tambets, M., Borcherding, J., Sæther, S. A., Tambets, M., et al. (2017) Downstream Migration of European Eel at Three German Hydropower Stations. Økland, F., Havn, T. B., Thorstad, E. B., Heermann, L., Saether, S. A., Tambets, M., Teichert, M. A. K. & Borcherding, J. (2019) Mortality of Downstream Migrating European Eel at Power Stations Can Be Low When Turbine Mortality Is Eliminated by Protection Measures and Safe Bypass Routes Are Available. International Review of Hydrobiology 68–79. QGIS Development Team. (2020) QGIS Geographic Information System. QGIS Association 2020. R Core Team. (2019) R: A Language and Environment for Statistical Computing. Vienna, Austria: RStudio, PBC. 2019. van den Thillart, G. E. E. J. M. (2014) European Eels: Dutch Fisheries, Culture and Eel Migration. In Eels and Humans (Tsukamoto, K., Kuroki, M., eds), pp. 61–74 Tokyo: Springer Japan. Wickham, H., Averick, M., Bryan, J., Chang, W., McGowan, L., François, R., Grolemund, G., Hayes, A., Henry, L., Hester, J., et al. (2019) Welcome to the Tidyverse. Journal of Open Source Software 4, 1686. Winter, H. v., Jansen, H. M. & Bruijs, M. C. M. (2006) Assessing the Impact of Hydropower and Fisheries on Downstream Migrating Silver Eel, Anguilla Anguilla, by Telemetry in the River Meuse. Ecology of Freshwater Fish 15, 221–228. Winter, H. v., Jansen, H. M. & Breukelaar, A. W. (2007) Silver Eel Mortality during Downstream Migration in the River Meuse, from a Population Perspective. ICES Journal of Marine Science 64, 1444–1449.
You can also read