Brief communication: Glacier mapping and change estimation using very high-resolution declassified Hexagon KH-9 panoramic stereo imagery (1971-1984)
←
→
Page content transcription
If your browser does not render page correctly, please read the page content below
The Cryosphere, 17, 1299–1306, 2023
https://doi.org/10.5194/tc-17-1299-2023
© Author(s) 2023. This work is distributed under
the Creative Commons Attribution 4.0 License.

Brief communication: Glacier mapping and change estimation using
very high-resolution declassified Hexagon KH-9
panoramic stereo imagery (1971–1984)
Sajid Ghuffar1,2 , Owen King1 , Grégoire Guillet1,3 , Ewelina Rupnik4 , and Tobias Bolch1,5
1 School  of Geography and Sustainable Development, University of St Andrews, St Andrews, UK
2 Department   of Space Science, Institute of Space Technology, Islamabad, Pakistan
3 LASTIG, Univ Gustave Eiffel, ENSG, IGN, Saint-Mande, France
4 Civil and Environmental Engineering, University of Washington, Seattle, WA, USA
5 Institute of Geodesy, Graz University of Technology, Graz, Austria

Correspondence: Sajid Ghuffar (sghuffar@gmail.com) and Tobias Bolch (tobias.bolch@tugraz.at)

Received: 8 October 2022 – Discussion started: 11 October 2022
Revised: 15 February 2023 – Accepted: 20 February 2023 – Published: 21 March 2023

Abstract. The panoramic cameras (PCs) on board Hexagon            term information (Geyman et al., 2022; Korsgaard et al.,
KH-9 (KH-9PC) satellite missions from 1971–1984 captured          2016), but for most regions no historical images exist or
very high-resolution stereo imagery with up to 60 cm spa-         are not available. Declassified data from the US satellite re-
tial resolution. This study explores the potential of this im-    connaissance program, especially the KH-9 mapping cam-
agery for glacier mapping and change estimation. We assess        era (KH-9MC) and the KH-4 panoramic cameras (KH-4PC),
KH-9PC imagery using data from the KH-9 mapping camera            have emerged as a key data source for mapping the state of
(KH-9MC), KH-4PC, and SPOT and Pléiades satellite im-             the glaciers from the 1960s to 1980s (Bhattacharya et al.,
agery. The high resolution of KH-9PC leads to higher-quality      2021; Dehecq et al., 2020; Zhou et al., 2017; Pieczonka
DEMs, which better resolve the accumulation region of the         and Bolch, 2015; Bolch et al., 2011). However, poor con-
glaciers in comparison to the KH-9MC. On stable terrain,          trast and texture in this imagery lead to large data gaps
KH-9PC DEMs achieve an elevation accuracy of < 4 m with           in the corresponding elevation datasets, hindering an accu-
respect to SPOT and Pléiades DEMs. While the estimated            rate investigation of glacier changes. The recent availability
geodetic mass balances using PC and MC data are similar           of declassified very high-resolution (VHR) Hexagon KH-9
after outlier filtering, the elevation change data show supe-     panoramic stereo imagery offers further opportunities for im-
rior spatial coverage and considerably less noise when using      proved glacier mapping for the 1970s and 1980s due to its
KH-9PC data.                                                      very high spatial resolution and distinct ground coverage.
                                                                     The US satellite reconnaissance program designed for
                                                                  strategic surveillance during the Cold War had its first suc-
                                                                  cessful launch and film recovery in 1960 involving a Corona
1   Introduction                                                  KH-1 series mission. Parallel to the development of the
                                                                  Corona program with cameras having the highest spatial
Recent studies confirmed that glaciers have been losing mass      resolution of 1.8 m, the Gambit-1 KH-7 (1963–1967) and
globally at an accelerated rate over the last 2 decades, and      Gambit-3 KH-8 (1966–1984) programs involved the devel-
available data indicate global glacier recession at least since   opment of a VHR (60–90 cm) camera system to acquire de-
the 1960s (Zemp et al., 2019; Hugonnet et al., 2021). The         tailed information about specific targets. The Hexagon pro-
provision of reliable estimates of these long-term changes at     gram, consisting of 20 missions from 1971–1986, aimed to
regional scales still remains a challenge due to data scarcity.   provide Corona-type coverage, together with the high resolu-
For some regions aerial photos provide the basis for long-

Published by Copernicus Publications on behalf of the European Geosciences Union.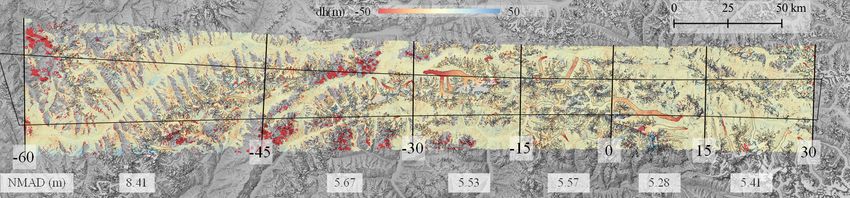
1300                                S. Ghuffar et al.: Very high-resolution Hexagon KH-9 panoramic imagery (1971–1984)

tion of the Gambit program (NRO, 2011). The main camera             9 missions was typically in the range of 160–250 km. This
system in Hexagon KH-9 missions consisted of two PCs with           resulted in a best ground resolution of around 60 cm towards
a 20◦ stereo convergence angle and the highest spatial reso-        the nadir direction. The ground resolution varied within the
lution of around 60 cm (NRO, 1968), while the later missions        scan and reached around 3 m towards the 60◦ scan angle (for
(1205–1216) also included a frame MC with a nadir-looking           a 170 km satellite altitude, Fig. 1). The ground coverage for
configuration capable of stereo and tri-stereo overlaps and a       the 120◦ scan was approx. 12 000 km2 . However, the distor-
spatial resolution of 6–9 m (Burnett, 2012).                        tions at high scan angles were considerable, in addition to the
   The Corona KH-4PC imagery (declassified in 1995) and             lower ground resolution. Consequently, the later KH-9 mis-
Hexagon KH-9MC imagery (declassified in 2002) have                  sions were restricted to a maximum 45◦ scan angle (NRO,
played a pivotal role in the estimation of long-term glacier        2011).
changes (Bhattacharya et al., 2021; Maurer et al., 2019;
Bolch et al., 2011). The processing of declassified photo-
graphic films requires special considerations due to the pres-      3     Data
ence of film distortions and limited information of camera
                                                                    To evaluate KH-9PC data for glacier mapping and change as-
parameters. The modeling of panoramic imaging geometry
                                                                    sessment with respect to contemporary high-resolution satel-
further complicates the processing of PC imagery. While the
                                                                    lite imagery, we chose two study sites: the Ak-Shirak area
majority of the earlier work on KH-4PC and KH-9MC has
                                                                    with Petrov Glacier in central Tien Shan and Passu Glacier in
been limited in terms of the number of images used or area
                                                                    central Karakoram (Figs. S2 and S3). The selection of these
covered, automated pipelines for both KH-9MC and KH-
                                                                    study sites was based on the availability of KH-9MC DEMs
4PC have recently been proposed, which enables large-scale
                                                                    and orthoimages from earlier studies (Pieczonka and Bolch,
mapping (Ghuffar et al., 2022; Dehecq et al., 2020; Maurer
                                                                    2015; Bolch et al., 2017; Goerlich et al., 2017), as well as the
and Rupper, 2015).
                                                                    availability of contemporary high-resolution satellite stereo
   The VHR KH-9PC data, which were declassified more re-
                                                                    imagery over these areas. We compare KH-9PC DEMs with
cently (in 2011), consist of more than 670 000 scenes cover-
                                                                    the KH-9MC DEMs from the same satellite overpass using
ing the majority of the Earth’s land area with multiple acqui-
                                                                    the high-resolution Pléiades and SPOT-6 DEMs (Table S1 in
sitions over most glacierized regions of the world (Fig. S1
                                                                    the Supplement). We further include KH-4PC data over Ak-
in Supplement). While the first 1700 rolls of the KH-9PC
                                                                    Shirak for comparison. The KH-9PC data consist of two aft
imagery were released through the U.S. Geological Survey’s
                                                                    images and one fore image for the Ak-Shirak area and vice
(USGS) EarthExplorer in 2015, the scanning of the whole
                                                                    versa for the Passu area. The KH-9PC images of Ak-Shirak
KH-9PC archive and its availability through the USGS is still
                                                                    had a scan angle range of −45 to 45◦ , while the Passu KH-
underway. By the end of February 2023, USGS had scanned
                                                                    9PC images had a scan angle range of −60 to 30◦ (Table S1).
about 70 % of the browse images, with the completion aimed
                                                                       To assess the potential of KH-9PC data for large-scale
at early 2024 (USGS, personal communication, 23 Febru-
                                                                    or regional-scale mapping of glacier changes, we utilize the
ary 2023). The potential for high-resolution DEM genera-
                                                                    entire swath width of the successive KH-9PC stereo pairs
tion and mapping using KH-9PC has remained largely unex-
                                                                    (fore: F049–F052; aft: A050–A052), which contains the im-
plored until now (Zhou et al., 2021; Fowler, 2016). The aim
                                                                    age subset used for the Passu Glacier area. We use the 30 m
of this study is to evaluate the potential of this imagery in the
                                                                    ALOS World DEM AW3D30 (Tadono et al., 2014) for the
context of glacier mapping and change estimation. We aim to
                                                                    evaluation of the KH-9PC DEM of the successive stereo pairs
quantify the accuracy of glacier DEMs generated from KH-
                                                                    and derive estimates of surface elevation change (dH) from
9PC imagery and assess changes in glacier mass balance and
                                                                    the two DEMs to examine the potential for estimating glacier
its associated uncertainty.
                                                                    mass balance at a regional extent.

2   Hexagon KH-9 panoramic cameras                                  4     Methods

The KH-9PC system, developed by Pelkin-Elmer, consisted             4.1    Processing of KH-9PC imagery
of stereoscopic cameras with a 20◦ convergence angle. The
cameras scanned in opposite directions with a maximum scan          The photographic film of each KH-9PC scene is scanned into
angle of ±60◦ in the across-track direction. In contrast to         several parts by the USGS due to its large size. The film
Corona KH-4PCs, these cameras had the capability to ac-             length of KH-9PC scenes depends on the total scan angle,
quire images in variable scan width and scan center modes.          while the width of the film (imaged area) is fixed at 15.24 cm.
KH-9PC operated with 30, 60, 90 and 120◦ variable scan an-          For a 120◦ scan the film length is 319.4 cm and is scanned
gles with scan centers of 0, ±15, ±30 and ±45 (Fig. 1). The         into 14 parts with 7 µm resolution (approx. 456 000 × 22 000
KH-9PC system had a focal length of 152.4 cm (60 in.) with a        pixels). We stitch individual scans using tie points extracted
folded Wright optical system. The orbital altitude of the KH-       in the overlapping region of the successive scan parts to gen-

The Cryosphere, 17, 1299–1306, 2023                                                    https://doi.org/10.5194/tc-17-1299-2023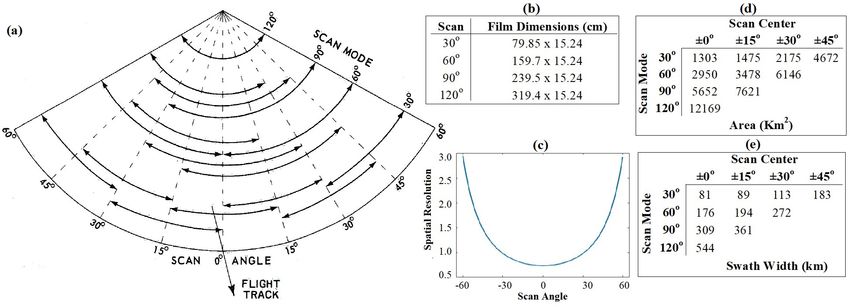
S. Ghuffar et al.: Very high-resolution Hexagon KH-9 panoramic imagery (1971–1984)                                                        1301

Figure 1. (a) The KH-9PC-acquired images at four different scan angles, i.e., 30, 60, 90 and 120◦ , along with different scan centers, i.e., ±0,
±15 and ±30◦ . (b) Film dimensions for each scan angle range. (c) Spatial resolution vs. scan angle with scan center at 0◦ . (d, e) The area
and swath width of the ground footprint for each combination of scan angle and scan center (modified from NRO, 1968).

erate an image of the entire scan. The scanned film consists of           mated camera parameters. To compensate for the misalign-
the imaged area, as well as reference data such as the timing             ment between the reference DEM and the KH-9PC point
marks, scan angle marks and tilting information. We clip the              cloud, a tile-based coregistration with the reference DEM is
imaged area and align the length and width of the film along              performed using a least-squares surface matching algorithm
the horizontal and vertical axes of the image, while no film-             employing a 3D affine transformation (Pfeifer et al., 2014).
bending estimation and subsequent compensation nor radio-                 The coregistered KH-9PC point cloud is then interpolated
metric correction are applied to the image.                               (using average elevation at each grid cell) to a raster DEM
   To process the KH-9PC imagery, we follow a workflow                    at the resolution of the reference DEM, i.e., 5 m for Passu,
similar to the Corona Stereo Pipeline (CoSP) using the same               10 m for Ak-Shirak and 30 m for comparison with AW3D30.
set of software and libraries as presented in Ghuffar et al.
(2022). CoSP uses a modified form of collinearity equations               4.2    KH-9MC, KH-4PC, SPOT-6 and Pléiades DEMs
to model the imaging geometry of the panoramic cameras
with a scanning mechanism. This panoramic camera model                    A Pléiades DEM (5 m, 2021) of Passu Glacier was generated
includes additional parameters to model the motion of the                 using MicMac (Pierrot-Deseilligny et al., 2014). We used
camera during the panoramic image scan, as well as the im-                DEMs of KH-9MC (25 m for Ak-Shirak and 30 m for Passu
age motion compensation mechanism. Following the work-                    Glacier), KH-4PC (25 m, 1964) and SPOT-6 (10 m, 2017)
flow in CoSP, we match feature points between KH-9PC im-                  generated in earlier studies for DEM evaluation. The KH-
agery and Landsat 7 ETM+ panchromatic images using the                    9MC images of Ak-Shirak and Passu Glacier were processed
deep-learning model SuperGlue (Sarlin et al., 2020). These                in Leica Photogrammetry Suite (Pieczonka and Bolch, 2015)
feature points along with the corresponding elevation values              and ERDAS IMAGINE Photogrammetry (Bolch et al., 2017)
derived from AW3D30 constitute the ground control points                  respectively. The KH-4PC images were processed in Remote
(GCPs), which are used in the estimation of the camera pa-                Sensing Software Package Graz (Goerlich et al., 2017), while
rameters. The initial approximation of the camera parameters              the SPOT-6 DEM of Ak-Shirak was generated using PCI Ge-
is done using the image corner locations given in the meta-               omatica (Bhattacharya et al., 2021). The fine coregistration
data of KH-9PC imagery available from the USGS. These                     of these DEMs has been performed using the method of Nuth
approximate camera parameters are then optimized in a bun-                and Kääb (2011), and the biases due to tilt in the DEMs have
dle adjustment using GCPs and tie points of the stereo pair.              been removed using polynomial trend surfaces.
   To map the corresponding image points of the stereo
                                                                          4.3    DEM differencing and elevation change
pair to the same image row, we use the generic epipolar
                                                                                 post-processing
resampling algorithm presented in Deseilligny and Rupnik
(2020). Then, we use the semi-global matching algorithm                   The coregistered DEMs were differenced from their refer-
(Hirschmuller, 2007) for dense matching of the resampled                  ence DEMs (i.e., SPOT-6 DEM for Ak-Shirak and Pléiades
stereo image pair. These dense stereo correspondences are                 DEM for Passu). To enable the robust estimation of geode-
then triangulated to generate a 3D point cloud using the esti-            tic glacier mass balance over the Passu and Petrov glaciers,

https://doi.org/10.5194/tc-17-1299-2023                                                           The Cryosphere, 17, 1299–1306, 2023
1302 S. Ghuffar et al.: Very high-resolution Hexagon KH-9 panoramic imagery (1971–1984)
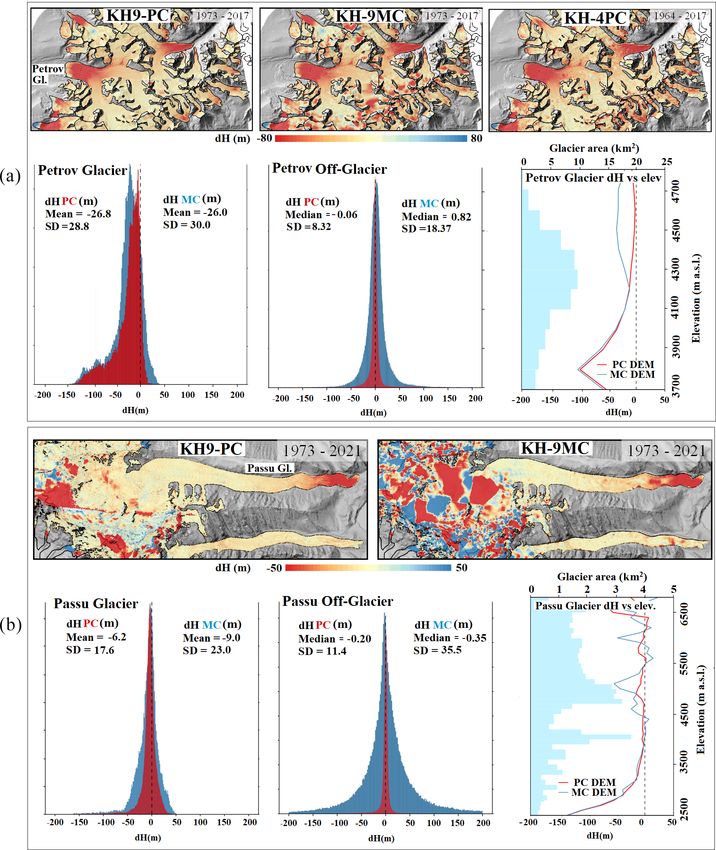
we firstly remove erroneous elevation change (dH) estimates Table 1. Mass balance (MB) of Petrov and Passu glaciers using KH-
most common in glacier accumulation zones (Fig. 2). We dis- 9PC and KH-9MC data and dH statistics of stable terrain between
card dH values outside ±200 m under the assumption that the KH-9 and the contemporary DEMs. The dH statistics over stable
glacier thinning or thickening outside of this range is un- terrain from Dehecq et al. (2020)∗ and Zhou et al. (2017)∗∗ are
likely. We then further filter the remaining dH data using given for a comparison. SD is the standard deviation.
a threshold of < ±3× the standard deviation (SD) of dH
within 50 m elevation bands of glacier surfaces through the Petrov Glacier MB Passu Glacier MB
1973–2017 (m w.e. a−1 ) 1973–2021 (m w.e. a−1 )
full elevation range of each glacier. We fill the resulting
gaps in the dH grids using the mean value of dH from the KH-9PC KH-9MC KH-9PC KH-9MC
same 50 m elevation band (McNabb et al., 2019). We convert
−0.41 ± 0.04 −0.46 ± 0.07 −0.09 ± 0.04 −0.1 ± 0.14
glacier-wide dH to volume change estimates considering the
pixel size of the dH grids and then to mass change using a Stable terrain statistics
conversion factor of 850 kg m−3 (Huss, 2013). Camera Median NMAD SD 68 % 95 %
The uncertainty associated with geodetic mass balance es-
Ak-Shirak
timates over Petrov and Passu glaciers was calculated follow- KH-9PC −0.06 3.35 8.32 3.55 15.68
ing the approach of Fischer et al. (2015) (following Rolstad KH-9MC 0.82 12.66 18.37 13.64 39.43
et al., 2009), which considers the variance of dH data over
KH-4PC 0.10 9.30 17.14 9.75 37.89
stable off-glacier areas as being representative of the uncer-
Passu
tainty of dH estimates on-glacier. The calculated correlation KH-9PC −0.20 3.54 11.44 3.80 19.95
length was 605 m in the case of the KH-9PC dH data and KH-9MC −0.35 27.78 35.53 31.60 78.06
873 m in the case of the KH-9MC data over Passu Glacier. ∗ KH-9MC – – – 5.00 15.00
The correlation length was 1488 m in the case of the KH- ∗∗ KH-9MC 0.04 19.14 22.61 – –
9PC-derived dH data and 1220 m for the KH-9MC-derived
dH data over Petrov Glacier. We include the uncertainty of
the density conversion factor proposed by Huss (2013) when
converting ice volume to mass changes, and we also follow and KH-9MC (−9.0 m) again produced similar dH estimates
the approach of Malz et al. (2018) to consider the impact of between 1973–2021, whilst the SDs of KH-9PC dH data
a changing glacier area on overall glacier mass balance esti- (17.6 m) were slightly lower than those of the KH-9MC dH
mates. data (23.0 m). Unfiltered dH data (Fig. 2) clearly show the
extent of glacier accumulation zones affected by low surface
contrast in DEM generation, and resulting blunders caused
5 Results anomalous, high-magnitude (−50 m) dH estimates (Fig. 2)
over both study sites. The area affected by such errors was
The differencing of KH-9PC DEMs with the SPOT-6 and much smaller in the KH-9PC DEM than the KH-9MC DEM.
Pléiades DEMs shows a normalized median absolute devi- Over Passu Glacier 82.0 % of KH-9PC dH data were retained
ation (NMAD) and 68 % quantile (confidence interval) of after filtering, compared to 56.6 % in the case of the KH-
less than 4 m over stable terrain (Table 1), while the KH- 9MC dH grid. Over Petrov Glacier, KH-9PC dH data cov-
9MC DEMs show an NMAD of 12.66 m for Ak-Shirak and ered 80.2 % of the glacier area following filtering, whereas
27.28 m for the Passu area. Although the KH-9PC DEMs 68.2 % of KH-9MC dH data were retained.
show significantly better accuracy, it should be emphasized The mass balance of Petrov Glacier (after outlier filtering
that the quality of the KH-9MC and KH-4PC DEMs (Ta- and gap filling) was estimated to be −0.41 ± 0.04 m w.e. a−1
ble 1) is also dependent on the DEM generation workflows for 1973–2017 when using KH-9PC data, while, using KH-
adopted in the respective studies. The accuracy of the KH- 9MC data, we estimate the mass balance of the glacier to be
9MC DEMs reported in earlier studies show significant vari- −0.46 ± 0.07 m w.e. a−1 . The mass balance of Passu Glacier
ation due to processing differences (Dehecq et al., 2020; was estimated to be −0.09 ± 0.04 m w.e. a−1 for 1973–2021
Bolch et al., 2017; Zhou et al., 2017). The best accuracy re- based on KH-9PC data, while, using KH-9MC data, the esti-
ported for KH-9MC data is around 5 m (68 %) with respect mated mass balance was −0.10 ± 0.14 m w.e. a−1 .
to the Shuttle Radar Topography Mission (SRTM) DEM us-
ing the KH-9MC imagery over the European Alps (Dehecq 5.1 Towards large-scale mapping with KH-9PC
et al., 2020).
Over Petrov Glacier (Ak-Shirak), the mean thinning esti- The differencing of the AW3D30 DEM with DEMs derived
mates after outlier filtering were similar for dH data derived from successive KH-9PC stereo pairs over the wider Karako-
using the KH-9PC (−26.8 m) and KH-9MC (−26.0 m), and ram region surrounding Passu Glacier (using the entire im-
the data were similarly dispersed (SD 28.8 m for PC, 30.0 m age, i.e., −60 to 30◦ scan angle) shows that the systematic
for MC) (Fig. 2). Over Passu Glacier, the KH-9PC (−6.2 m) errors are relatively low up to 45◦ scan angle (Fig. 3). The
The Cryosphere, 17, 1299–1306, 2023 https://doi.org/10.5194/tc-17-1299-2023S. Ghuffar et al.: Very high-resolution Hexagon KH-9 panoramic imagery (1971–1984) 1303 Figure 2. (a) dH of KH-9PC (1973), KH-9MC (1973) and KH-4PC (1964) DEMs with the SPOT-6 (2017) DEM over Ak-Shirak. (b) dH of the KH-9PC (1973) and KH-9MC (1973) DEMs with Pléiades (2021) DEM over Passu Glacier. Bottom graphs: the corresponding dH histograms for glacier and off-glacier pixels and change in dH with respect to the elevation. These dH grids and the corresponding histograms show elevation differences without the filtering and gap filling, which is performed before mass balance computation. The filtered versions of the dH grids are available in Fig. S5. The linear feature visible in the dH image over the accumulation zone of Passu Glacier is due to the boundary of successive images having only a small overlap. NMAD of elevation differences over stable terrain is around age area. Most moderate to large glaciers require mosaicking 5.5 m from −45 to 30◦ scan angle, which shows that suc- of multiple successive KH-9PC DEMs, and fine coregistra- cessive stereo DEMs are well coregistered and consistent tion and filtering of any boundary artifacts are important to with each other. However, the overlap between the successive avoid introducing bias in the DEMs. frames is relatively small, i.e., around 3 % towards the nadir, At higher scan angles (i.e., > 45◦ ) the occlusions (from which may lead to data gaps at the boundary of successive mountains due to slant viewing angle) increase significantly, DEMs especially if the boundary falls over a textureless im- and higher perspective distortions lead to systematic bias in https://doi.org/10.5194/tc-17-1299-2023 The Cryosphere, 17, 1299–1306, 2023
1304                                S. Ghuffar et al.: Very high-resolution Hexagon KH-9 panoramic imagery (1971–1984)

Figure 3. Elevation differences using the entire KH-9 panoramic swath width of successive KH-9PC stereo images (D3C1206-200215F049-
F52 and D3C1206-200215A050-A052) and the AW3D30 covering parts of the Karakoram and Hindu Kush mountains. The near-vertical
lines show approximate 15◦ intervals of the panoramic scan. The NMADs of the elevation differences over stable terrain are shown at the
bottom for each 15◦ scan area. The footprint of scene D3C1206-200215A051 is overlaid for reference. The part of the DEM beyond 30 and
−60◦ scan angles has been clipped. Occlusions due to high relief and slant viewing angle cause data gaps between −60 to −35◦ scan angles,
while some data gaps and outliers are due to clouds (see Fig. S4).

the DEM differences due to uncompensated systematic er-                reaches of mountain glaciers could be significant when ex-
rors (Fig. 3). Even with an improved coregistration and bias           amining processes such as quiescent-phase ice mass build-up
and trend correction approach, reliable DEM and orthoimage             over surge-type glaciers or concentrated ice mass accumula-
generation for higher scan angles will be quite challenging            tion prior to glacier instabilities (Kääb et al., 2018).
especially for mountainous regions. Therefore, the scan an-               The VHR KH-9PC imagery complements the data from
gle range of the KH-9PC acquisitions should always be con-             KH-9MC and KH-4PC in terms of area coverage and resolu-
sidered when investigating the ground coverage of KH-9PC               tion and offers potential for improved glacier mapping capa-
images.                                                                bilities. Although the radiometric resolution of scanned KH-
                                                                       9PC imagery is less compared to Pléiades and SPOT-6 (8 bits
                                                                       vs. 12 bits), the spatial details are quite similar to contempo-
6   Discussion                                                         rary VHR satellite imagery (Fig. S7), and therefore KH-9PC
                                                                       has the capability of characterizing small-scale glacier sur-
The accuracy of optical- and stereo-derived elevation data             face features such as supraglacial ponds and ice cliffs. This
depends in particular on the image resolution, and our results         improves our ability to study the role of these ablative fea-
show that KH-9PC data can achieve better accuracy in com-              tures over longer timescales than is currently possible. The
parison to KH-9MC and KH-4PC, reducing uncertainties                   different ground footprint of KH-9PC (Fig. S2) compared
associated with the estimation of glacier surface elevation            to KH-9MC, as well as acquisitions from higher number of
change. Our results demonstrate the ability of the KH-9PC              KH-9 missions, also enhances the chances of identifying and
to better resolve surface conditions in glacier accumulation           mapping glacier surge events from the 1970s to 1980s (see
zones, therefore providing a greater coverage of dH data to            Fig. S8, which shows the Hispar Glacier (Karakoram) tribu-
be used in the study of glacier accumulation and ablation pro-         tary surge in multi-temporal KH-9PC imagery). The crevasse
cesses (Figs. 2 and S6). Geodetic studies incorporating KH-            pattern indicative of surge activity is also recognizable in
9MC data (e.g., Zhou et al., 2017; King et al., 2019; Mau-             VHR KH-9PC imagery. In addition, the KH-9PC imagery
rer et al., 2019) report considerable data gaps (up to 40 %),          enhances the potential for the mapping of glacial lake out-
primarily over the higher reaches of glaciers, and therefore           burst flood events (from the 1970s to 1980s) in high spatial
provide little information on their accumulation regime over           detail (Fig. S8).
multi-decadal time periods. In combination with contempo-                 The presence of film distortions due to long-term storage
rary sensors capable of capturing accumulation zone condi-             poses a limitation in processing historical imagery. The re-
tions (e.g., Pléiades), KH-9PC data can be used to more com-           seau marks in the KH-9MC film enables correction of the
pletely capture glacier accumulation and ablation processes            film distortion (Pieczonka and Bolch, 2015). However, such
over longer time periods than is currently possible. In our two        a reseau grid is not available in PC imagery due to the dis-
case studies, this improved coverage resulted in relatively mi-        tinctive imaging mechanism. To the best of our knowledge,
nor differences in geodetic mass budgets (Table 1), likely be-         there exists no established methodology for the correction
cause of the effectiveness of outlier filtering and subsequent         of film distortions in declassified panoramic imagery. In ad-
gap filling techniques in minimizing the impact of erroneous           dition, the scanning artifacts have also been reported in the
dH estimates on glacier volume change (and therefore mass              scanned imagery, which may further limit the accuracy of
balance) calculations (e.g., McNabb et al., 2019). Still, the          the derived data (Ghuffar et al., 2022; Dehecq et al., 2020).
improved coverage afforded by KH-9PC data over the higher

The Cryosphere, 17, 1299–1306, 2023                                                        https://doi.org/10.5194/tc-17-1299-2023
S. Ghuffar et al.: Very high-resolution Hexagon KH-9 panoramic imagery (1971–1984) 1305
7 Conclusions Acknowledgements. We thank the reviewers and the scientific edi-
tor for their constructive comments.
This study shows that KH-9PC DEMs can achieve accu-
racy better than 4m over mountainous terrain, which is Financial support. This study was supported by the Swiss National
an improvement on the accuracy reported for KH-9MC Science Foundation (grant no. 200021E_177652/1) and the Strate-
and KH-4PC DEMs. The very high resolution and bet- gic Priority Research Program of the Chinese Academy of Sciences
ter image quality lead to more reliable elevation esti- (grant no. XDA20100300).
mates towards the accumulation region of the glaciers.
The estimated geodetic mass balance using KH-9PC data
(−0.09 ± 0.04 m w.e. a−1 for Passu Glacier and −0.41 ± Review statement. This paper was edited by Bert Wouters and re-
0.04 m w.e. a−1 for Petrov Glacier) and KH-9MC data viewed by Amaury Dehecq and one anonymous referee.
(−0.10 ± 0.14 m w.e. a−1 for Passu Glacier and −0.46 ±
0.07 m w.e. a−1 for Petrov Glacier) are quite similar, which
shows the effectiveness of the outlier filtering approach. References
However, the uncertainty associated with mass balance es-
timates is significantly reduced when considering KH-9PC ALOS: https://www.eorc.jaxa.jp/ALOS/en/dataset/aw3d30/
data due to fewer outliers in derived dH data and lower aw3d30_e.htm, last access: 17 March 2023.
height differences over stable terrain. As cloud-free acqui- Bhattacharya, A., Bolch, T., Mukherjee, K., King, O., Menounos,
sitions in declassified imagery during late summer to early B., Kapitsa, V., Neckel, N., Yang, W., and Yao, T.: High Moun-
winter months over glacierized areas are rather limited, the tain Asian glacier response to climate revealed by multi-temporal
satellite observations since the 1960s, Nat. Commun., 12, 1–13,
VHR KH-9PC imagery with variable footprint offers mul-
https://doi.org/10.1038/s41467-021-24180-y, 2021.
tiple benefits in the context of glacier mapping and change Bolch, T., Pieczonka, T., and Benn, D. I.: Multi-decadal mass
estimation. loss of glaciers in the Everest area (Nepal Himalaya) de-
rived from stereo imagery, The Cryosphere, 5, 349–358,
https://doi.org/10.5194/tc-5-349-2011, 2011.
Data availability. The DEM differencing grids and orthoimages Bolch, T., Pieczonka, T., Mukherjee, K., and Shea, J.: Brief com-
are available from http://mountcryo.org/datasets (MountCryo, munication: Glaciers in the Hunza catchment (Karakoram) have
2023). The KH-9PC (https://doi.org/10.5066/F7WD3Z10; USGS, been nearly in balance since the 1970s, The Cryosphere, 11, 531–
2018c), KH-9MC (https://doi.org/10.5066/F74X5684; USGS, 539, https://doi.org/10.5194/tc-11-531-2017, 2017.
2018a), KH-4 (https://doi.org/10.5066/F78P5XZM; USGS, Burnett, M. G.: Hexagon (KH-9) Mapping Camera Program
2018b) and Landsat 7 ETM+ (https://doi.org/10.5066/P9TU80IG; and Evolution, Center for the Study of National Reconnais-
USGS, 2020) images can be ordered and downloaded from sance, https://www.nro.gov/Portals/65/documents/foia/declass/
https://earthexplorer.usgs.gov (last access: 14 March 2023; mapping1.pdf (last access: 17 March 2023), 2012.
USGS, 2023) and the ALOS data (Tadono, 2014) from Dehecq, A., Gardner, A. S., Alexandrov, O., McMichael, S.,
https://www.eorc.jaxa.jp/ALOS/en/dataset/aw3d30/aw3d30_e.htm Hugonnet, R., Shean, D., and Marty, M.: Automated process-
(last access: 17 March 2023; ALOS, 2023). ing of declassified KH-9 Hexagon satellite images for global
elevation change analysis since the 1970s, Front. Earth Sci., 8,
Supplement. The supplement related to this article is available on- 566802, https://doi.org/10.3389/feart.2020.566802, 2020.
line at: https://doi.org/10.5194/tc-17-1299-2023-supplement. Deseilligny, M. P. and Rupnik, E.: Epipolar rectification of a generic
camera, IPOL Journal, in review, https://doi.org/10.5201/ipol,
2020.
Fischer, M., Huss, M., and Hoelzle, M.: Surface elevation and mass
Author contributions. SG and TB designed the study. SG, sup-
changes of all Swiss glaciers 1980–2010, The Cryosphere, 9,
ported by ER, processed the KH-9 panoramic camera images. OK
525–540, https://doi.org/10.5194/tc-9-525-2015, 2015.
and GG computed the mass balance and uncertainty estimates. SG,
Fowler, M. J.: The archaeological potential of declassified
supported by TB, OK and GG, wrote the manuscript. All authors
HEXAGON KH-9 panoramic camera satellite photographs,
contributed to the final form of the article.
AARG News, 53, 30–36, 2016.
Geyman, E. C., van Pelt, J. J., W., Maloof, A. C., Aas, H. F.,
and Kohler, J.: Historical glacier change on Svalbard pre-
Competing interests. At least one of the (co-)authors is a member dicts doubling of mass loss by 2100, Nature, 601, 374–379,
of the editorial board of The Cryosphere. The peer-review process https://doi.org/10.1038/s41586-021-04314-4, 2022.
was guided by an independent editor, and the authors also have no Ghuffar, S., Bolch, T., Rupnik, E., and Bhattacharya, A.: A pipeline
other competing interests to declare. for automated processing of declassified Corona KH-4 (1962–
1972) stereo imagery, IEEE T. Geosci. Remote, 60, 1–14,
Disclaimer. Publisher’s note: Copernicus Publications remains https://doi.org/10.1109/TGRS.2022.3200151, 2022.
neutral with regard to jurisdictional claims in published maps and Goerlich, F., Bolch, T., Mukherjee, K., and Pieczonka, T.:
institutional affiliations. Glacier mass loss during the 1960s and 1970s in the
https://doi.org/10.5194/tc-17-1299-2023 The Cryosphere, 17, 1299–1306, 20231306 S. Ghuffar et al.: Very high-resolution Hexagon KH-9 panoramic imagery (1971–1984) Ak-Shirak range (Kyrgyzstan) from multiple stereoscopic Pfeifer, N., Mandlburger, G., Otepka, J., and Karel, W.: OPALS– Corona and Hexagon imagery, Remote Sensing, 9, 275, A framework for Airborne Laser Scanning data analysis, https://doi.org/10.3390/rs9030275, 2017. Computers, Environment and Urban Systems, 45, 125–136, Hirschmuller, H.: Stereo processing by semiglobal matching and https://doi.org/10.1016/j.compenvurbsys.2013.11.002, 2014. mutual information, IEEE T. Pattern Anal., 30, 328–341, Pieczonka, T. and Bolch, T.: Region-wide glacier mass budgets and https://doi.org/10.1109/TPAMI.2007.1166, 2007. area changes for the Central Tien Shan between 1975 and 1999 Hugonnet, R., McNabb, R., Berthier, E., Menounos, B., Nuth, using Hexagon KH-9 imagery, Global Planet. Change, 128, 1– C., Girod, L., Farinotti, D., Huss, M., Dussaillant, I., Brun, 13, https://doi.org/10.1016/j.gloplacha.2014.11.014, 2015. F., and Kääb, A.: Accelerated global glacier mass loss Pierrot-Deseilligny, M., Jouin, D., Belvaux, J., Maillet, G., Girod, in the early twenty-first century, Nature, 592, 726–731, L., Rupnik, E., Muller, J., Daakir, M., Choqueux, G., and De- https://doi.org/10.1038/s41586-021-03436-z, 2021. veau, M.: Micmac, apero, pastis and other beverages in a nut- Huss, M.: Density assumptions for converting geodetic glacier shell, Institut Géographique National, 2014. volume change to mass change, The Cryosphere, 7, 877–887, Rolstad, C., Haug, T., and Denby, B.: Spatially integrated https://doi.org/10.5194/tc-7-877-2013, 2013. geodetic glacier mass balance and its uncertainty based Kääb, A., Leinss, S., Gilbert, A., Bühler, Y., Gascoin, S., Evans, on geostatistical analysis: application to the western S. G., Bartelt, P., Berthier, E., Brun, F., Chao, W.-A., Farinotti, Svartisen ice cap, Norway, J. Glaciol., 55, 666–680, D., Gimbert, F., Guo, W., Huggel, C., Kargel, J. S., Leonard, G. https://doi.org/10.3189/002214309789470950, 2009. J., Tian, L., Treichler, D., and Yao, T.: Massive collapse of two Sarlin, P.-E., DeTone, D., Malisiewicz, T., and Rabinovich, A.: glaciers in western Tibet in 2016 after surge-like instability, Nat. Superglue: Learning feature matching with graph neural net- Geosci., 11, 114–120, https://doi.org/10.1038/s41561-017-0039- works, in: Proceedings of the IEEE/CVF Conference on Com- 7, 2018. puter Vision and Pattern Recognition, 13–19 June 2020, Los King, O., Bhattacharya, A., Bhambri, R., and Bolch, T.: Glacial Alamitos, CA, USA, IEEE Computer Society, 4938–4947, lakes exacerbate Himalayan glacier mass loss, Sci. Rep.-UK, 9, https://doi.org/10.1109/CVPR42600.2020.00499, 2020. 1–9, https://doi.org/10.1038/s41598-019-53733-x, 2019. Tadono, T., Ishida, H., Oda, F., Naito, S., Minakawa, K., and Korsgaard, N. J., Nuth, C., Khan, S. A., Kjeldsen, K. K., Iwamoto, H.: Precise global DEM generation by ALOS Bjørk, A. A., Schomacker, A., and Kjær, K. H.: Digital PRISM, ISPRS Annals of the Photogrammetry, Remote elevation model and orthophotographs of Greenland based Sensing and Spatial Information Sciences, II4, 71–76, on aerial photographs from 1978–1987, Sci. Data, 3, 1–15, https://doi.org/10.5194/isprsannals-II-4-71-2014, 2014. https://doi.org/10.1038/sdata.2016.32, 2016. USGS: USGS EROS Archive – Declassified Data – De- Malz, P., Meier, W., Casassa, G., Jaña, R., Skvarca, P., and Braun, classified Satellite Imagery – 2, USGS [data set], M. H.: Elevation and mass changes of the Southern Patagonia https://doi.org/10.5066/F74X5684, 2018a. Icefield derived from TanDEM-X and SRTM data, Remote Sens- USGS: USGS EROS Archive – Declassified Data – De- ing, 10, 188, https://doi.org/10.3390/rs10020188, 2018. classified Satellite Imagery – 1, USGS [data set], Maurer, J. and Rupper, S.: Tapping into the Hexagon spy https://doi.org/10.5066/F78P5XZM, 2018b. imagery database: A new automated pipeline for geomor- USGS: USGS EROS Archive – Declassified Data – De- phic change detection, ISPRS J. Photogramm., 108, 113–127, classified Satellite Imagery – 3, USGS [data set], https://doi.org/10.1016/j.isprsjprs.2015.06.008, 2015. https://doi.org/10.5066/F7WD3Z10, 2018c. Maurer, J. M., Schaefer, J., Rupper, S., and Corley, A.: Acceleration USGS: USGS EROS Archive – Landsat Archives – Landsat 7 En- of ice loss across the Himalayas over the past 40 years, Sci. Adv., hanced Thematic Mapper Plus Collection 2 Level-1 Data, USGS 5, eaav7266, https://doi.org/10.1126/sciadv.aav7266, 2019. [data set], https://doi.org/10.5066/P9TU80IG, 2020. McNabb, R., Nuth, C., Kääb, A., and Girod, L.: Sensitivity USGS: EarthExplorer, https://earthexplorer.usgs.gov, last access: of glacier volume change estimation to DEM void interpola- 14 March 2023. tion, The Cryosphere, 13, 895–910, https://doi.org/10.5194/tc- Zemp, M., Huss, M., Thibert, E., Eckert, N., McNabb, R., Huber, 13-895-2019, 2019. J., Barandun, M., Machguth, H., Nussbaumer, S. U., Gärtner- MountCryo: Data, http://mountcryo.org/datasets, last access: Roer, I., Thomson, L., Paul, F., Maussion, F., Kutuzov, S., and 17 March 2023. Cogley, J. G.: Global glacier mass changes and their contribu- NRO: Prelimnary KH-9 Camera Manual, Tech. rep., In National Re- tions to sea-level rise from 1961 to 2016, Nature, 568, 382–386, connaissance Office Data Book, https://www.nro.gov/Portals/65/ https://doi.org/10.1038/s41586-019-1071-0, 2019. documents/foia/declass/ForAll/101917/F-2017-00094b.pdf (last Zhou, Y., Li, Z., and Li, J.: Slight glacier mass loss in the access: 6 June 2022), 1968. Karakoram region during the 1970s to 2000 revealed by NRO: Critical to US Security, The Gambit and Hexagon satellite KH-9 images and SRTM DEM, J. Glaciol., 63, 331–342, reconnaissance systems, Tech. rep., In National Reconnaissance https://doi.org/10.1017/jog.2016.142, 2017. Office Data Book, https://www.nro.gov/Portals/65/documents/ Zhou, Y., Chen, G., Qiao, X., and Lu, L.: Mining High-Resolution history/csnr/gambhex/Docs/CriticaltoUSSecurity.pdf (last ac- KH-9 Panoramic Imagery to Determine Earthquake Deforma- cess: 6 June 2022), 2011. tion: Methods and Applications, IEEE T. Geosci. Remote, 60, Nuth, C. and Kääb, A.: Co-registration and bias corrections of satel- 4506012, https://doi.org/10.1109/TGRS.2021.3116441, 2021. lite elevation data sets for quantifying glacier thickness change, The Cryosphere, 5, 271–290, https://doi.org/10.5194/tc-5-271- 2011, 2011. The Cryosphere, 17, 1299–1306, 2023 https://doi.org/10.5194/tc-17-1299-2023
You can also read