BRIEF 54 GLOBAL STATUS OF COMMERCIALIZED BIOTECH/GM CROPS IN 2018
←
→
Page content transcription
If your browser does not render page correctly, please read the page content below
ISAAA Briefs

                          brief 54
      Global Status of Commercialized
         Biotech/GM Crops in 2018:
Biotech Crops Continue to Help Meet the Challenges
    of Increased Population and Climate Change

         In 2018, 191.7 million hectares of biotech crops
      were grown in 26 countries by up to 17 million farmers.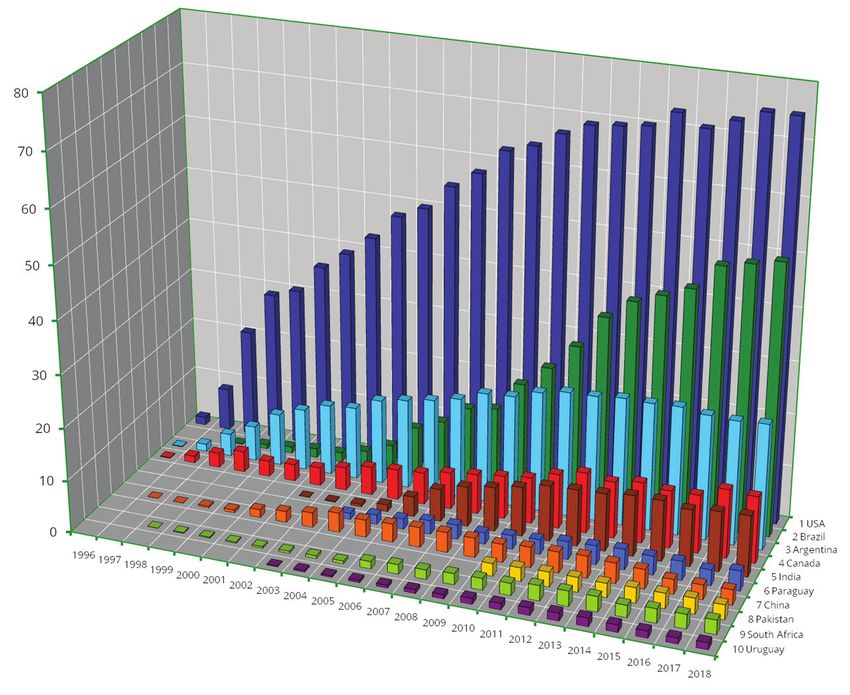
Over the last 22 years, ISAAA has devoted considerable            reflecting the usage of these words in different regions
effort to consolidate all the available data on the adoption of   of the world, with biotech crops being used exclusively in
officially approved biotech crops globally; it is important to    this text because of its growing usage worldwide. Similarly,
note that the database does not include plantings of biotech      the words corn, used in North America, and maize, used
crops that are not officially approved. The database draws        more commonly elsewhere in the world, are synonymous,
on a large number of sources of approved biotech crops            with maize being used consistently in this Brief, except for
from both the public and private sectors in many countries        common names like corn rootworm where global usage
throughout the world. The range of crops is those defined         dictates the use of the word corn. All $ dollar values in this
as food, feed and fiber crops in the Food and Agriculture         Brief are US dollars unless otherwise noted. Some of the listed
Organization of the United Nations (FAO) database, which          references may not be cited in the text – for convenience
totaled ~10 billion metric tons of production in 2010 (http://    they have been included because they are considered useful
www.geohive.com. Charts/ag_crops.aspx). Data sources              reading material and were used as preparatory documents
vary by country and include, where available, government          for this Brief. Global sum of millions of hectares planted with
statistics, independent surveys, and estimates from               biotech crops have in some cases been rounded off to the
commodity groups, seed associations and other groups,             nearest million and similarly, subtotals to the nearest 100,000
plus a range of proprietary databases. In the interest of         hectares, using both < and > characters; hence in some cases
uniformity, continuity, and comparability, wherever possible,     this leads to insignificant approximations, and there may
ISAAA utilizes the same published data source annually;           be minor variances in some figures, sum, and percentage
for example, for Brazil, the October biotech reports of           estimates that do not always add up exactly to 100% due to
Celeres are used; similarly, for the US, the US Department        rounding off. It is also important to note that countries in the
of Agriculture National Agricultural Statistics Service (USDA     Southern Hemisphere plant their crops in the last quarter
NASS) crop acreage reports published in June annually are         of the calendar year. The biotech crop areas reported in this
used. Published ISAAA estimates are, wherever possible,           publication are planted, not necessarily harvested hectarage,
based on more than one source of information and thus             in the year stated. Thus, for example, the 2018 information
are usually not attributable to one specific source. Multiple     for Argentina, Brazil, Australia, South Africa, and Uruguay
sources of information for the same data point greatly            is hectares usually planted in the last quarter of 2018 and
facilitate assessment, verification, and validation of specific   harvested in the first quarter of 2019, or later, with some
estimates. The “proprietary” ISAAA database on biotech crops      countries like the Philippines planting crops in more than
is unique from two points of view; first, it provides a global    one season per year. Thus, for countries of the Southern
perspective; second, it has used the same basic methodology,      hemisphere, such as Brazil and Argentina the estimates are
improved continuously for the last 20 years and hence             projections, and thus are always subject to change due to
provides continuity from the genesis of the commercialization     weather, which may increase or decrease actual planted
of biotech crops in 1996, to the present. The database has        area before the end of the planting season when this Brief
gained acceptance internationally as a reliable benchmark of      went to press. For Brazil, the winter maize crop (safrinha)
the global status of biotech food, feed and fiber crops and is    planted at the end of December 2018 and more intensively
widely cited in the scientific literature and the international   through January and February 2019, is classified as a 2018
press. Whereas individual data points make-up the database,       crop in this Brief, consistent with a policy which uses the first
the most valuable information is the trends of adoption over      date of planting to determine the crop year. All biotech crop
time, for example the increasing dominance of developing          hectare estimates in this Brief, and all ISAAA publications,
countries which is clearly evident.                               are only counted once, irrespective of how many traits are
                                                                  incorporated in the crops. Country figures were sourced
Note that the words rapeseed, canola, and Argentine               from The Economist, supplemented by data from World
canola are used synonymously, as well as transgenic crops,        Bank, FAO, and the United Nations Conference on Trade and
genetically modified crops, GM crops, and biotech crops,          Development (UNCTAD), when necessary.
ISAAA Briefs

                        brief 54

Global Status of Commercialized Biotech/GM Crops in 2018:
    Biotech Crops Continue to Help Meet the Challenges
        of Increased Population and Climate Change

                        No. 54 – 2018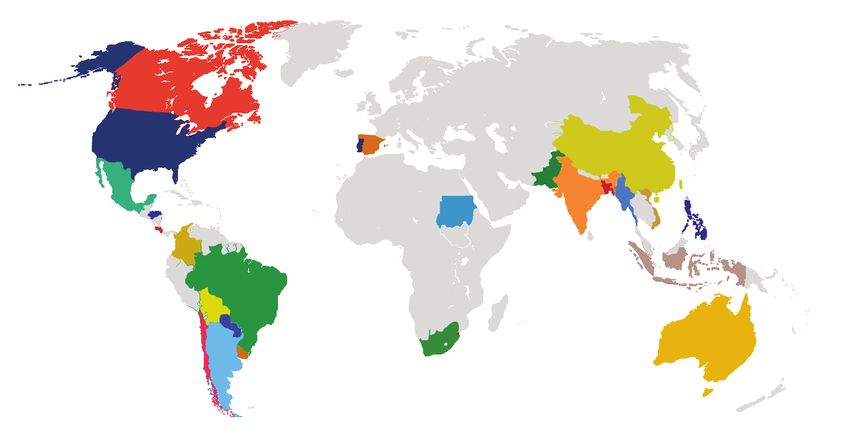
ISAAA prepares this Brief to provide information and knowledge to the scientific community and
                       society on biotech/GM crops to facilitate a more informed and transparent discussion regarding
                       their potential role in contributing to global food, feed, fiber and fuel security, and a more
                       sustainable agriculture. ISAAA takes full responsibility for the views expressed in this publication and
                       for any errors of omission or misinterpretation.

     Published by:     The International Service for the Acquisition of Agri-biotech Applications (ISAAA).

        Copyright:     ISAAA 2018. All rights reserved. Whereas ISAAA encourages the global sharing of information in
                       Brief 54, no part of this publication may be reproduced in any form or by any means, electronically,
                       mechanically, by photocopying, recording or otherwise without the permission of the copyright
                       owners. Reproduction of this publication, or parts thereof, for educational and non-commercial
                       purposes is encouraged with due acknowledgment, subsequent to permission being granted by
                       ISAAA.

          Citation:    ISAAA. 2018. Global Status of Commercialized Biotech/GM Crops in 2018: Biotech Crops Continue
                       to Help Meet the Challenges of Increased Population and Climate Change. ISAAA Brief No. 54. ISAAA:
                       Ithaca, NY.

              isbn:    978-1-892456-68-0

Publication Orders:    The Executive Summary is downloadable from the ISAAA website (http://www.isaaa.org).
                       Please contact the ISAAA SEAsiaCenter to purchase a copy of the full version of Brief 54 (print or
                       electronic).

                       ISAAA SEAsiaCenter
                       c/o IRRI
                       DAPO Box 7777
                       Metro Manila, Philippines

                       Email: publications@isaaa.org

     Info on ISAAA:    For information about ISAAA, please contact the Center nearest you:

                       ISAAA AmeriCenter			 ISAAA AfriCenter					                       ISAAA SEAsiaCenter
                       c/o IP CALs			 PO Box 70, ILRI Campus			                         c/o IRRI
                       B75 Mann Library			 Old Naivasha Road				                        DAPO Box 7777
                       Cornell University			 Uthiru, Nairobi 00605			                   Metro Manila
                       Ithaca NY 14853, U.S.A.			 Kenya					                            Philippines

     Electronically:   or email to info@isaaa.org

                       For Executive Summaries of all ISAAA Briefs, please visit http://www.isaaa.org
Table of Contents
List of Tables and Figures ii European Union 66
Introduction 1 Spain 69
Global Area of Biotech Crops in 2018 4 Portugal 69
Distribution of Biotech Crops in 4 Benefits from Biotech Maize in 71
Industrial and Developing Countries the EU
Distribution of Biotech Crops, by 5 Summary and Future Prospects 72
Country Distribution of Biotech Crops: by Crop 72
Economic Benefits of Biotech Crops 9 Biotech soybean area is 50% of the 72
Country Chapters global biotech area
Top Ten Biotech Crop Countries 10 Biotech maize area slightly 75
United States of America 10 decreased in 2018
Brazil 15 Biotech cotton adoption increased 75
Argentina 18 by 3%
Canada 21 Biotech canola area decreased by 6% 76
India 24 Biotech alfalfa HarvXtra™ area 77
Paraguay 27 increased by 295%
China 29 Other biotech crops 77
Pakistan 31 Distribution of Biotech Crops, by Trait 77
South Africa 35 Trends in Biotech Crop Approvals 1992- 79
Uruguay 37 2018
Latin America 38 Biotech Crop Importing Countries 80
Bolivia 38 New Approvals, Events, and 82
Mexico 40 Countries
Colombia 41 Contribution of Biotech Crops to Food 83
Honduras 42 Security, Sustainability, and Climate
Chile 43 Change Mitigation
Costa Rica 44 Closing Comments and Conclusion 84
Summary and Future Prospects 44 Acknowledgments 86
for Latin America References 87
Asia and the Pacific 45
Australia 46
Philippines 49
Myanmar 53
Vietnam 54
Bangladesh 55
Indonesia 59
Summary and Future Prospects 61
in Asia and the Pacific
The African Continent 62
Sudan 65
eSwatini 66
iList of Tables and Figures
Tables
Table 1. Global Area of Biotech Crops, 23 Years, 1996 to 2018
Table 2. Global Area of Biotech Crops, 2017 and 2018: Industrialized and Developing Countries (Million
Hectares)
Table 3. Global Area of Biotech Crops in 2017 and 2018: by Country (Million Hectares**)
Table 4. Total and Trait Hectares of Biotech Maize in the USA, 2017-2018
Table 5. Trait Hectares of Biotech Cotton in the USA, 2017-2108
Table 6. Total and Trait Hectares of Biotech Maize in Brazil, 2017-2018
Table 7. Total and Trait Hectares of Biotech Cotton in Brazil, 2017-2018
Table 8. Total and Trait Hectares of Biotech Soybeans in Argentina, 2017-2018
Table 9. Total and Trait Hectares of Biotech Maize in Argentina, 2017-2018
Table 10. Maize Events Approval in Argentina in 2018
Table 11. Total and Trait Hectares of Biotech Maize in Canada, 2017-2018
Table 12. Total and Trait Hectares of Biotech Soybeans in Paraguay, 2017-2018
Table 13. Total and Trait Hectares of Biotech Maize in Paraguay, 2017-2018
Table 14. Area of Biotech Papaya Planted in China, 2018 (Hectares)
Table 15. Approval of Field Trials of Maize Events by FSCRC, 2018
Table 16. Biosafety Approval of IR/HT Maize Events by Federal NBC in Pakistan, 2018
Table 17. Approved Biotech Crops for Field Testing Developed by Public Sector, 2018
Table 18. Total and Trait Hectares of Biotech Soybeans in Uruguay, 2017-2018
Table 19. Total and Trait Hectares of Biotech Maize in Uruguay, 2017-2018
Table 20. Biotech Canola Area in Three States in Australia, 2018
Table 21. Total and Trait Hectares of Biotech Cotton in Australia, 2017-2018
Table 22. Total and Trait Hectares of Biotech Maize in the Philippines, 2017-2018
Table 23. Adoption of IR Brinjal in Bangladesh, 2018
Table 24. Yield Difference between Bt and Non-Bt Eggplant Varieties During Winter 2016-17 in the Study
Areas
Table 25. Per Hectare Return from Eggplant Production in the Study Areas
Table 26. Mean Yields and Economic Returns in Brinjal by Fruit and Shoot Borer (BFSB) Relative to
Insecticides and Varieties
Table 27. List of Articles on Biotech Developments in Africa
Table 28. Area of Biotech Maize by Region in Spain (Hectares)
Table 29. Area of Biotech Maize by Region in Portugal, 2011-2018 (Hectares)
Table 30. Global Area of Biotech Crops, 2017-2018: by Trait (Million Hectares)
Table 31. Global Area of Biotech Crops, 2017 and 2018: by Crop (Million Hectares)
Table 32. Global Area of Biotech Crops, 2017-2018: by Trait (Million Hectares)
Table 33. Non-planting Countries which Granted Approvals for Import (Food, Feed, and Processing) from
1996 to 2018
iiList of Tables and Figures
figures
Figure 1. Global Area of Biotech Crops, 1996 to 2018: Industrialized and Developing Countries (Million
Hectares)
Figure 2. Global Area (Million Hectares) of Biotech Crops, 1996 to 2018, by Country, Mega-Countries, and
for the Top Ten Countries
Figure 3. Biotech Crops Planted in the USA, 2018
Figure 4. Biotech Crops Planted in Brazil, 2018
Figure 5. Biotech Crops Planted in Argentina, 2018
Figure 6. Biotech Crops Planted in Canada, 2018
Figure 7. Seventeen Years of Adoption of IR (Bt) Cotton in India, 2002 to 2018
Figure 8. Biotech Crops Planted in Paraguay, 2018
Figure 9. Adoption of IR Cotton in Pakistan, 2010 to 2019
Figure 10. Biotech Crops Planted in South Africa, 2018
Figure 11. Adoption of IR (Bt) Cotton in Myanmar, 2006 to 2018
Figure 12. Africa Biotech/GM Research and Commercialization Status in 2018
Figure 13. Crop Traits Under Various Stages of Research in Africa in 2018
Figure 14. IR Cotton Adoption in Sudan 2012-2018
Figure 15. Biotech Maize Area in the European Union, 2006-2018, Hectares
Figure 16. Global Area of Biotech Crops, 1996 to 2018: by Crop (Million Hectares)
Figure 17. Global Adoption Rates (%) for Principal Biotech Crops, 2018 (Million Hectares)
Figure 18. Global Area of Biotech Crops, 1996 to 2018: by Trait (Million Hectares)
Figure 19. Number of Countries that Issued Food, Feed, and Cultivation Approvals (1992-2018)
Figure 20. Number of Biotech Events (Single and Stacked) Approved per Year (1992-2018)
Figure 21. Distribution of Traits of Approved GM Events (1992-2018)
Figure 22. Distribution of Approved GM Crops (1992-2018)
iiiGlobal
Global Status of Commercialized Status
Biotech/GM of2018
Crops: Commercialized Biotech/GM Crops in 2018:
Biotech Crops Continue to Help Meet the Challenges
of Increased Population and Climate Change
Introduction which includes child stunting and adult obesity,
making the health of hundreds of millions of
The first 22 years of commercialization of people at risk. These findings translate into a
biotech crops (1996 to 2017) has confirmed clear warning that more efforts must be done
that biotech crops have delivered substantial rapidly to achieve the Sustainable Development
agronomic, environmental, economic, Goal of Zero Hunger by 2030 (Crop Biotech
health, and social benefits to farmers, Update, September 19, 2018).
and increasingly to the consumers (ISAAA,
2017). The rapid adoption of biotech crops It was also emphasized that the main drivers
reflects the substantial multiple benefits that slow down economic growth and incite
realized by both large and small farmers in hunger were climate variability, impacting
industrial and developing countries who have rainfall patterns and agricultural seasons, and
commercially grown biotech crops. In 22 extreme climate conditions such as drought and
years, an accumulated 2.34 billion hectares of floods. There were also countries whose people
biotech crops have been grown commercially, are affected by conflict and were hungry.
comprised of 1.13 billion hectares of biotech
soybean, 0.7 billion hectares of biotech maize, Climate change, as predicted by studies in
0.36 billion hectares of biotech cotton, and the early 2000s, cause significant reduction in
0.14 billion hectares of biotech canola. Biotech crop yields directly and indirectly as climate
products derived from 2.34 billion hectares warms. A report by the Food and Agriculture
significantly contributes food, feed, fiber, and Organization of the United Nations (FAO)
fuel to the current world population of almost revealed that among the natural disasters that
7.7 billion people. Hence, feeding the world cause agricultural losses, drought is the most
population, which is continuously increasing destructive (Crop Biotech Update, March 28,
and predicted to be 9.9 billion in 2050 and 11.2 2018). The report titled The Impact of Disasters
billion in 2100 (UN, 2018), is indeed a daunting and Crises on Agriculture and Food Security
task. highlights that natural disasters, including
drought, floods, forest fires, storms, plant pests,
The Global Report on Food Crises 2017 revealed animal disease outbreaks, chemical spills,
that the targets of the United Nations (UN) and toxic algal blooms, have cost developing
Millennium Development Goals (UN-MDG) countries US$96 billion losses from 2005 to
that ended in 2015 were not achieved, and 2015. About 50 percent of the damages (US$48
that around 108 million people in 48 food billion worth) occurred in Asia. Drought was
crisis-affected countries are still at risk or in found to be the leading threat among all the
severe acute food insecurity since 2016 (FAO, natural disasters. Around 80 percent of the
2017). Moreover, the 2018 UN report on the economic losses caused by drought were
State of Food Security and Nutrition in the absorbed by agriculture, amounting to US$29
World indicated that for three years in a row billion.
(since 2016), there was a continuous increase
of hunger worldwide, with current levels Indirectly, climate change and its accompanying
equivalent to records a decade ago. The report warming temperature result to crop losses
also emphasized that there was a slow progress caused by insect pests. According to the
in addressing the multiple forms of malnutrition researchers of the University of Vermont, losses
1Introduction Global Status of Commercialized Biotech/GM Crops: 2018
in staple crops rice, maize, and wheat are radical changes are made on the dietary
projected to rise by 10-25 percent per degree choices of most (replacing most meat and
of increase in temperature. These losses are dairy with plant-based alternatives, and greater
due to the increase in insect metabolism and acceptance of human-edible crops currently
population growth rates. When it becomes fed to animals, especially maize, as directly-
hotter, the insects’ metabolism increases, and consumed human food) would be necessary,
they tend to eat more, leading to an eventual under all scenarios (Crop Biotech Update, July
rise in insect population. The losses will be 25, 2018).
greatest in temperate areas, but less severe
in the tropics where temperature is close to Since biotech crops were commercialized in
optimal for survival of insect pests (Crop Biotech 1996, it has contributed to:
Update, September 5, 2018). • Increased productivity that contributes
to global food, feed, and fiber security;
One important example is the fall armyworm • Self-sufficiency on a nation’s arable
which was native to the Americas. It has spread land;
across Africa and expected to spread to India • Conserving biodiversity, precluding
and to other countries in Southeast Asia and deforestation and protecting
South China, putting food security and farmer biodiversity sanctuaries;
livelihoods at risk, according to FAO (Crop • Mitigating the challenges associated
Biotech Update, August 15, 2018). Its population with climate change; and
has reached an epidemic size with the warming • Improving economic, health, and social
temperatures. The insect has the ability to benefits.
fly over long distances (100 km per night)
and destroy staple crops such as maize, rice, The current problem on fall armyworm can
vegetables, groundnut, and cotton. be solved by biotech crops that contain insect
resistant (IR) genes, according to a study
In the midst of climate change, there is an conducted at the Iowa State University. Bt
urgent and united call to reverse the reported maize could help farmers in Africa to combat
increasing hungry people. As José Graziano da this emerging pest capable of devastating
Silva, FAO Director-General said, “There is no their crops, but fear of GM crops has slowed
time to lose, poverty will not be eradicated, adoption of the technology in the continent.
natural resources will continue to degrade, and Bt maize could fight the pest immediately
forced migration will continue to rise…if every compared to developing resistant varieties
person is sustainably food secure in 2030, that through traditional breeding which takes several
will be the most consequential turning point years. Thus, delaying the adoption of biotech
in history” (Crop Biotech Update, October 17, crops such as IR (Bt) maize in the developing
2018). world presents risks to both humans and the
environment (Crop Biotech Update, December
In a study conducted by Lancaster University 19, 2018).
and Small World Consulting, the researchers
stressed that if the world population continues New biotech crops and traits have been
a “business-as-usual” dietary trajectory, a 119% developed to tolerate extreme weather
increase in edible crops grown will be necessary conditions. The drought tolerant maize was
by 2050. Moreover, the current production of released to drought-stricken farmers in 2013,
crops could be sufficient to provide enough and drought tolerant sugarcane and soybean
food for the projected global population if have been commercialized or are undergoing
2Global Status of Commercialized Biotech/GM Crops: 2018 Introduction
final stages of evaluation before eventual For instance, a 2015 Pew Research Center study
release to the farmers. The contribution of found that 88% of American Association for
this technology and accompanying cultural the Advancement of Science member scientists
management could offset the effects of climate consider GM foods safe to consume, while
change in the long run (Crop Biotech Update, only 37% of the general public consider them
November 21, 2018). safe and 57% deem GM foods unsafe to eat.
The resulting 51% gap between the views of
Biotech crops are safe for humans and the scientists and those of the public on GMO food
environment and risks associated with biotech safety amounts to an opinion difference greater
crops have proven to be low to non-existent. than divisions over other controversial issues
Two 2018 Nobel Laureates in chemistry such as climate change, childhood vaccines, and
Prof. Frances Arnold from the US and Sir human evolution, the study authors reported
Gregory Winter from Great Britain believe (Crop Biotech Update, February 11, 2015).
in biotechnology. “We’ve been modifying
the biological world at the level of DNA for Biotechnology can be used to develop stress-
thousands of years,” Arnold said at a news tolerant and more nutritious crop varieties
conference, citing examples such as new dog and to protect natural resources and human
breeds. “Somehow there is this new fear health. Each biotech crop is evaluated on a
of what we already have been doing and case-by-case basis, approved commercial
that fear has limited our ability to provide products in the market have been subjected
real solutions.” Arnold opined that biotech to rigorous scientific scrutiny. Biotech crops
crops could make food production more should be considered as a tool for improving
environmentally sustainable and help feed crop yields, food safety, and income for food-
the world’s growing population. Genetic insecure farmers. These economic benefits,
modifications can make crops drought and health improvement, and social gains obtained
disease resistant. Winter said that current through biotech crop adoption should be
regulations on biotech crops needed to be made known to the global community so that
“loosened up” (The Guardian, December 7, farmers and consumers can make informed-
2018). decisions on what crops to grow and consume,
respectively; to the policy makers and regulators
Other international bodies such as the World to craft enabling biosafety guidelines for
Health Organization, the American Medical commercialization and adoption of biotech
Association, the U.S. National Academy crops; and to the science communicators and
of Sciences, the British Royal Society, and the media to facilitate dissemination of the
many other respected organizations support benefits and potentials of the technology.
biotechnology. They unanimously stated in
many different ways that “consuming foods The International Service for the Acquisition
containing ingredients derived from biotech of Agri-biotech Applications (ISAAA) strongly
crops is no riskier than consuming the same supports the above statements and the
foods that contain ingredients from crop plants scientific truths underpinning them with the
modified by conventional plant improvement publication of Global Status of Commercialized
techniques. Despite this, there are still skeptics Biotech/GM Crops in 2018 (ISAAA Brief 54). This
and a widening perception gap between publication documents the latest information
scientific knowledge and the general public’s on the subject, global database on the adoption
views. and distribution of biotech crops since the first
year of commercialization in 1996, country
3Introduction Global Status of Commercialized Biotech/GM Crops: 2018
situations and future prospects of the great advocates of biotechnology and biotech
technology in the adopting countries and the products and believe that ISAAA can make a
world. Termed as ISAAA Briefs, the annual difference in enhancing the knowledge and
reports from 1997 to 2015 were authored by capacities of the global community in order to
Dr. Clive James, and the 1996 report was co- benefit from the technology, especially the poor
authored with Dr. Anatole Krattiger. and marginalized people of the world.
In 2018, the global area of biotech crops
increased from 189.8 million hectares to Global Area of Biotech Crops in 2018
191.7 million hectares, a 1% increase from
2017 equivalent to 1.9 million hectares, and In 2018, the accumulated biotech area (planted
planted by 26 countries. As predicted by since 1996) surged to a record 2.5 billion
James (2015), the slight decline in biotech hectares or 6.2 billion acres (Table 1). Of the
crop area in 2015 easily reverted back to total number of 26 countries planting biotech
the increasing trend of biotech crop area in crops in 2018, 21 were developing countries
2016, 2017, and a slight increase in 2018, and 5 were industrialized countries (Table 2,
with changes in global prices of commodities, Figure 1). The 1.1% increase between 2017 and
demand for biofuels, need for livestock 2018 is equivalent to 1.9 million hectares or 4.7
and poultry feeds, environmental stresses, million acres (Table 1). This is a manifestation of
disease/pest pressure, country policies, how fast the technology has been adopted in an
political situations, and consumer perception. increasing number of countries and expanded
Thus, adoption of biotech crops in 2018, area, contributing benefits to the global
detailed in each country chapter was a result community and preserving the environment.
of an interplay of these various factors, but it
is noteworthy that the majority has reached
90% saturation in principal markets in both Distribution of Biotech Crops in
developing and industrial countries. High Industrial and Developing Countries
adoption rates reflect farmer satisfaction with
the products that offer substantial benefits Developing countries continued to outperform
ranging from more convenient and flexible industrialized countries since 2012. Prior to
crop management, lower cost of production, 2011, industrial countries consistently exceeded
higher productivity and/or net returns per the adoption of developing countries, and by
hectare, health and social benefits, and a 2011, the global area of biotech crops was
cleaner environment through decreased use evenly distributed between industrialized and
of conventional pesticides, which collectively developing countries. Starting 2012, developing
contribute to a more sustainable agriculture. countries consistently increased their planting
area and by 2018, there was a difference of
ISAAA dedicates this Brief to Dr. Clive James, 14.5 million hectares between developing and
Founder and Emeritus Chair of ISAAA, who industrialized countries. Developing countries
has painstakingly authored the 20 Annual grew 54% of the global biotech hectares
Reports making it the most credible source compared to 46% for industrialized countries
of information on biotech crops in the last (Table 2, Figure 1). Moreover, developing
two decades. We also dedicate this Brief to countries increased by 2.5% in 2018, compared
the late Dr. Randy A. Hautea, former ISAAA to 2017, while industrialized countries
Global Coordinator and SEAsiaCenter Director decreased by 0.7%.
for more than two decades. They have been
4Global Status of Commercialized Biotech/GM Crops: 2018 Distribution of Biotech Crops, by Country
Table 1. Global Area of Biotech Crops, 23 hectares), India, and Uruguay (200,000 hectares
Years, 1996 to 2018 each), and China and Mexico (100,000 hectares
each) and small increases in Sudan, Honduras,
Year Hectares (million) Acres (million) and Vietnam.
1996 1.7 4.2
1997 11.0 27.2 The largest percentage expansion was obtained
by Mexico at 100% increase in biotech cotton
1998 27.8 68.7
area, followed by Paraguay and Sudan (27%),
1999 39.9 98.6 Uruguay (18%), and small increases in China
2000 44.2 109.2 (4%), India and Brazil (2% each), and Argentina
2001 52.6 130.0 (1%). There were minimal decreases in
2002 58.7 145.0 industrialized countries area wise: Canada
with 400,000 hectares, Australia with 100,000
2003 67.7 167.3
hectares, and small decreases in Spain and
2004 81.0 200.2 Portugal.
2005 90.0 222.4
2006 102.0 252.0 The trend for a higher share of global biotech
crops in developing countries is likely to
2007 114.3 282.4
continue in the near-, mid-, and long-term,
2008 125.0 308.9 firstly, due to more countries from the South,
2009 134.0 331.1 especially in Africa and Asia adopting biotech
2010 148.0 365.7 crops and secondly, adoption of crops such as
2011 160.0 395.4 rice and potato, which are grown in developing
countries, and will be deployed as “new” biotech
2012 170.3 420.8
crops.
2013 175.2 432.9
2014 181.5 448.5
2015 179.7 444.0 Distribution of Biotech Crops, by
Country
2016 185.1 457.4
2017 189.8 469.0 A total of 26 countries, 21 developing and 5
2018 191.7 473.7 industrialized countries, planted biotech crops
Total 2,531.2 6,254.5 in 2018. The top ten countries, each of which
grew over 1 million hectares, was led by the USA
*Global area of biotech crops in 2018 slightly increased
to 191.7 million hectares compared with 189.8 million
which grew 75 million hectares (39% of global
hectares in 2017, equivalent to 1.0% or 1.9 million total), Brazil with 51.3 million hectares (27%),
hectares (4.7 million acres). Argentina with 23.9 million hectares (12%),
Canada with 12.7 million hectares (7%), India
Source: ISAAA, 2018 with 11.6 million hectares (6%), Paraguay with
3.8 million hectares (2%), China with 2.9 million
hectares (2%), Pakistan with 2.8 million hectares
The 14.5 million hectares increment between (1%), South Africa with 2.7 million hectares (1%)
the developing countries and industrialized and Uruguay with 1.3 million hectares (1%), for
countries in 2018 is due mainly to increases in a total of 188.0 million hectares. An additional
areas in Brazil (1.1 million hectares), Paraguay 16 countries grew a total of approximately 3.7
(800,000 hectares), Argentina (300,000 million hectares in 2018 (Table 3 and Figure 3).
5Distribution of Biotech Crops, by Country Global Status of Commercialized Biotech/GM Crops: 2018
Table 2. Global Area of Biotech Crops, 2017 and 2018: Industrialized and Developing Countries
(Million Hectares)
2017 % 2018 % +/– %
Industrialized countries 89.2 46 88.6 46 -0.6 -0.7
Developing countries 100.6 54 103.1 54 2.5 2.5
Total 189.8 100 191.7 100 1.9 1.0
Source: ISAAA, 2018
220
200
180
160
140
Million Hectares
120
100
80
60
40
20
0
1996 1997 1998 1999 2000 2001 2002 2003 2004 2005 2006 2007 2008 2009 2010 2011 2012 2013 2014 2015 2016 2017 2018
Total Industrialized Countries Developing Countries
Figure 1. Global Area of Biotech Crops, 1996 to 2018: Industrialized and Developing Countries
(Million Hectares)
Source: ISAAA, 2018
Two new developing countries planted biotech biotech crops, the majority (8 out of 10) were
crops in 2018: Indonesia (Southeast Asia) with developing countries, with Brazil, Argentina,
1,315 hectares of drought tolerant sugarcane India, Paraguay, China, South Africa, Pakistan,
planted in a government owned corporation and Uruguay, compared with only two
and few farmers fields, and 250 hectares of Bt industrialized countries, USA and Canada.
cotton in eSwatini (formerly Swaziland in Africa).
A total of 18 biotech mega-countries (countries
It should be noted that of the top ten countries, which grew 50,000 hectares, or more, of biotech
each growing 1.0 million hectares or more of crops) was recorded in 2018, the same as 2017.
6Global Status of Commercialized Biotech/GM Crops: 2018 Distribution of Biotech Crops, by Country
Table 3. Global Area of Biotech Crops in 2017 and 2018: by Country (Million Hectares**)
Country 2017 % 2018 % +/– %
1 USA* 75.0 39 75.0 39 0 0
2 Brazil* 50.2 26 51.3 27 1.1 2
3 Argentina* 23.6 12 23.9 12 0.3 1
4 Canada* 13.1 7 12.7 7 -0.4 -3
5 India* 11.4 6 11.6 6 0.2 2
6 Paraguay* 3.0 2 3.8 2 0.8 27
7 China* 2.8 1 2.9 2 0.1 4
8 Pakistan* 3.0 2 2.8 1 -0.2 -7
9 South Africa* 2.7 1 2.7 1 0 0
10 Uruguay* 1.1 1 1.3 1 0.2 18
11 Bolivia* 1.3 1 1.3 1 0 0
12 Australia* 0.9Distribution of Biotech Crops, by Country Global Status of Commercialized Biotech/GM Crops: 2018
Figure 2. Global Area (Million Hectares) of Biotech Crops, 1996 to 2018, by Country, Mega-
Countries, and for the Top Ten Countries
50,000 hectares, or more
1. USA 75.0 million
2. Brazil* 51.3 million
3. Argentina* 23.9 million
4. Canada 12.7 million
5. India* 11.6 million
6. Paraguay* 3.8 million
7. China* 2.9 million
8 Pakistan* 2.8 million
9. South Africa* 2.7 million
10. Uruguay* 1.3 million
11. Bolivia* 1.3 million
12. Australia 0.8 million
13. Philippines* 0.6 million
14. Myanmar* 0.3 million
26 countries which have adopted biotech crops 15. Sudan* 0.2 million
16. Mexico* 0.2 million
17. Spain 0.1 million
In 2018, global area of biotech 18. Colombia* 0.1 million
crops was 191.7 million hectares,
Less than 50,000 hectares
representing an increase of 1.1%
1.1% from 2017, equivalent to 1.9 Vietnam*
Honduras*
Bangladesh*
Costa Rica*
Increase million hectares. Chile* Indonesia*
from 2017 Portugal eSwatini*
Source: ISAAA, 2018 * Developing countries
Million Hectares
Top 10 countries
growing 1 million
hectares, or more
in 2018
Source: ISAAA, 2018
8Global Status of Commercialized Biotech/GM Crops: 2018 Economic Benefits of Biotech Crops
Notably, 14 of the 18 mega-countries were 13 traits under different stages of planting
developing countries from Latin America, Asia, and research. There is also a strong wave of
and Africa. The high proportion of biotech endorsement of technology benefits through
mega-countries in 2018, 18 out of 26, equivalent increased expressions of political goodwill and
to 69%, reflects the significant broadening, budget allocations by various governments.
deepening, and stabilizing in biotech crop
adoption that has occurred within the group Two EU countries, Spain and Portugal,
of more progressive mega-countries adopting continued to plant biotech crops in 2018 at
more than 50,000 hectares of biotech crops, on 120,733 hectares, a slight decrease of 9% from
all six continents. 131,535 hectares in 2017.
Of the 26 countries that planted biotech crops
in 2018, 12 (46%) of the countries were in the Economic benefits of biotech crops
Americas, 9 (35%) were in Asia, 2 (8%) were in
Europe, and 3 (11%) were in Africa. In terms The six principal countries that have gained
of biotech crop area, of the 26 countries that the most economically from biotech crops,
planted biotech crops in 2018, 88.5% of the area during the first 21 years of commercialization of
was in the Americas, 10% in Asia, 1.5% in Africa, biotech crops, 1996 to 2016 were, in descending
and 0.1% in Europe. order of magnitude, the USA (US$80.3 billion),
Argentina (US$23.7 billion), India (US$21.1
There were 10 countries in Latin America, which billion, Brazil (US$19.8 billion), China (US$19.6
benefit from the extensive adoption of biotech billion), Canada (US$8 billion), and others
crops. Listed in descending order of biotech (US$13.6 billion) for a total of US$186.1 billion
area, they were Brazil, Argentina, Paraguay, (Brookes and Barfoot, 2018).
Uruguay, Bolivia, Mexico, Colombia, Honduras,
Chile, and Costa Rica. There were nine countries In 2016 alone, the six countries that gained the
that planted biotech crops in Asia and the most economically from biotech crops were:
Pacific led by India, China, Pakistan, Australia, the USA (US$7.3 billion), Brazil (US$3.8 billion),
Philippines, Myanmar, Vietnam, Bangladesh, India (US$1.5 billion), Argentina (US$2.1 billion),
and Indonesia. For the sixth year since its China (US$1 billion), Canada (US$0.82 billion),
approval, Japan grew blue carnation and blue and others (US$1.8 billion) for a total of US$18.2
rose which are commercial biotech flowers. billion (Brookes and Barfoot, 2018).
They were grown on 12 hectares under partially
covered conditions and not in “open field” The global economic benefits of US$18.2 billion
conditions like the food, feed, and fiber biotech in 2016 were divided between the developing
crops grown in other countries listed in this countries at US$10 billion and US$8.2 for
Brief. Australia and Colombia also grew biotech industrial countries.
carnation.
In Africa, Sudan, South Africa, and eSwatini grew
a total of 2.9 million hectares of biotech crops;
South Africa for 2.7 million hectares of biotech
soybean, maize, and cotton, Sudan for 243,000
hectares of biotech cotton, and eSwatini with
250 hectares of biotech cotton. Africa currently
has 13 biotech crops in 13 countries and
9Top Ten Biotech Crop Countries Global Status of Commercialized Biotech/GM Crops: 2018
TOP TEN BIOTECH CROP COUNTRIES Biotech Alfalfa
1.26 Mhas
(2%)
Other Biotech Crops*
In 2018, the top 10 biotech crop planting Biotech Cotton 1.39 Mhas (2%)
countries included the USA (75 million hectares), 5.1 Mhas
Brazil (51.3 million hectares), Argentina (23.9 (7%)
million hectares), Canada (12.7 million hectares),
India (11.6 million hectares), Paraguay (3.8
million hectares), China (2.9 million hectares),
Pakistan (2.8 million hectares), South Africa Biotech Soybeans
34.09 Mhas
(2.7 million hectares), and Uruguay (1.3 million Biotech Maize (45%)
hectares), which planted a total of 188.0 million 33.14 Mhas
(44%)
hectares or 98% of the total 191.7 million
hectares biotech crop area. Details on the
biotech crops planted, adoption trends, country
situations, and future prospects are discussed
below.
Figure 3. Biotech Crops Planted in the USA,
2018
United States of America * Canola, sugar beets, potato, apples, squash, and
papaya.
As in the past 22 years, the area planted to
Source: ISAAA, 2018
biotech crops in 2018 in the United States of
America (USA) remained the highest globally.
A total of 75 million hectares of biotech crops
were planted comprised of 34.09 million 2018 biotech crop area in the USA of 75 million
hectares biotech soybeans, 33.14 million hectares is the same as 2017.
hectares biotech maize, 5.1 million hectares
biotech cotton, 1.26 million hectares biotech Biotech maize adoption slightly decreased to
alfalfa, 0.9 million hectares biotech canola, 92%
491,000 hectares biotech sugar beets, 1,700
hectares biotech potato, and some 1,000 For 2018, the USDA National Agricultural
hectares of biotech apples, squash, and papaya Statistical Service (USDA NASS) reported that the
(Figure 3). The biotech crop area in the USA biotech maize area slightly decreased to 33.17
was 39% of the 191.7 million hectares global million hectares at 92% adoption rate. The 33.17
biotech crop area, confirming the country’s million hectares biotech maize was comprised
leadership in biotech crop farming. of 721,000 hectares insect resistant (IR), 3.61
million hectares herbicide tolerant (HT), and
Estimates from the United States Department 28.85 million hectares stacked insect resistant
of Agriculture (USDA) indicate that each of the and herbicide tolerant (IR/HT) traits (Table 4).
percentage adoption of the three principal
biotech crops was at, or close to maximum Biotech soybean adoption rate remained at
penetration: soybeans at 94% (similar to 2017), 94%
maize at 92% (decrease of 1.4% from 2017),
and biotech cotton at 94% (2% decrease from Soybeans are the second most important crop
2017). The average adoption rate for the three in the USA, with a total planted area of 36.26
crops is 93.3%, 1.2% lower than in 2017. The million hectares in 2018, 94% (similar to 2017)
10Global Status of Commercialized Biotech/GM Crops: 2018 United States of America
Table 4. Total and Trait Hectares of Biotech Maize in the USA, 2017-2018
Area Planted (MHa) % Trait Hectares
2017 2018 2017 2018
Total Maize 36.79 36.059
IR 1.10 0.72 3.3 2
HT 4.41 3.61 13.0 11
IR/HT** 28.34 28.85 83.7 87
Total Biotech Maize 33.84 33.17 93.4* 92*
* Adoption rate ** Includes 2 million hectares with drought tolerance trait
Source: ISAAA, 2018
or 34.08 million hectares were biotech, a slight achieve a 25% higher yield potential by delaying
increase of 0.11% from 2017. Biotech soybeans harvesting to 35-day cutting intervals. This is
contain herbicide tolerant traits that control based on three cuttings at 35-day intervals
various kinds of weeds depending on the compared to four cuttings at 28-day intervals,
genes deployed. The other traits incorporated with the three-cut system yielding more over
in HT soybeans include consumer traits such the life of the stand. Futhermore, delaying
as event 260-05 (approved in 1997) with high the cutting leads to huge benefits such as soil
monounsaturated oleic acid; event DP 305423- preservation, savings in equipment like custom
1 (2009) and Vistive Gold MON87705-6 (2011); choppers, and less time used (Hay & Forage
and omega-fatty acid enriched soybeans MON Grower, 2018).
87769 (2011).
Biotech cotton area increased by 10%
Biotech alfalfa HarvXtra™ area increased
slightly at 50% adoption Upland cotton planted in the USA increased by
12.7% in 2017, equivalent to 161,000 hectares,
Alfalfa is the third most planted crop in the from 4.8 million hectares in 2017 to 5.4 million
USA at 8.5 million hectares, with 15% or 1.26 hectares in 2018. The biotech cotton area also
million hectares were biotech. Since 2015, increased by 10.4% from 4.6 million hectares in
biotech alfalfa has offered herbicide tolerance 2017 to 5.1 million hectares in 2018. Notably,
and low lignin traits (HarvXtra™) to livestock adoption of biotech cotton in 2018 was 94%,
farmers. Herbicide tolerant alfalfa was planted 2% less than 2017. The 5.06 million hectares
on 1.14 million hectares and 120,000 hectares of biotech cotton was comprised of 161,000
to HarvXtra™ in 2018. The area planted to hectares insect resistant, 484,000 hectares
HarvXtra™ increased by 6-fold from 20,000 herbicide tolerant, and 4.4 million hectares
hectares in 2016—when it was first planted— stacked IR/HT (Table 5).
to 120,000 hectares in 2018, a manifestation
of acceptance by US cattle producers for a Biotech canola adoption rate remained at
product that is highly digestible and offers a 100%
15 to 20% increase in yield. In addition, with
HarvXtra™ alfalfa, growers have the option to The area covered by canola increased by
11United States of America Global Status of Commercialized Biotech/GM Crops: 2018
Table 5. Trait Hectares of Biotech Cotton in the USA, 2017-2108
Area Planted (MHa) % Trait Hectares
2017 2018 2017 2018
Total Cotton 4.78 5.38
IR 0.24 0.16 5.2 3
HT 0.53 0.48 11.5 10
IR/HT 3.82 4.42 83.3 87
Total Biotech Cotton 4.58 5.06 96.0* 94.0*
* Adoption rate
Source: ISAAA, 2018
2.5% (from 876,000 hectares in 2017 to personal communication, 2018). This year,
898,000 hectares). Adoption rate of 100% was the area planted to sugar beets increased by
maintained since 2017. Some biotech canola 7.2%.
events have improved oil content for the health-
conscious public, such as high lauric acid canola Across the country, the sugar beet growing
(Laurical™ Canola), Event 18 and Event 23 season faces variability in sugar content and
approved in 1994. Event MPS 963 Phytaseed™ yield which affect the area planted and the
(1998) with high lauric acid approved in 1994 amount of sugar harvested per area from
also contains an enzyme that breaks down year to year. The high price of sugar beets in
plant phytases, making phosphorous available 2016, which averaged US$45 to US$48 per ton
to monogastric animals. In 2017, glufosinate compared to the US$46 per ton average in
tolerant canola was approved for food, feed, 2015, resulted in increased area and bountiful
and cultivation. harvest in 2016. Thus, ending stocks of sugar
beet sugar in 2016, as well as the competing
Farmers in the USA planted more canola and sugar from cane could have resulted to a
other alternate crops for wheat due to low minimal decrease in sugar beet area in 2017
wheat prices, as well as the increasing local (Idaho Farm Bureau Federation, October 12,
market for canola in the country. Canola 2017). Since 2009, three herbicide tolerant
prices ranged from US$15.76 to US$18.76 per sugar beet events have been approved for
hundredweight, while soft wheat averaged food, feed, and commercialization in the USA.
US$4.49 to US$4.80 per bushel (Capital Press,
April 6, 2017). This is a positive incentive for Virus resistant papaya and squash sustain
biotech canola farmers in the USA. small hectarage
Biotech sugar beets remain at 100% Virus resistance traits deployed in papaya and
adoption rate squash have been in the US market since the
mid-90’s. Papaya ringspot virus is a potyvirus
In 2018, sugar beets were planted in the USA and resistant papaya was developed through
at 491,000 hectares, which is 100% biotech the insertion of the coat protein genes of the
herbicide tolerant (American Sugar Beet, virus. Papaya ringspot virus resistant (PRSV-R)
12Global Status of Commercialized Biotech/GM Crops: 2018 United States of America
Rainbow papaya was developed in 1997 by two Biotech potatoes Innate® generations 1 and
public research institutions Cornell University 2 planted in the USA
and University of Hawaii, and commercialized
in the USA since 1998. USDA estimated that Biotech Generation 1 potato varieties (Russet
77% (405 hectares) of 526 hectares of papaya in Burbank, Ranger Russet, Atlantic, and Snowden)
Hawaii in 2018 was PRSV-R papaya. that are non-browning, resistant to bruising
and black spots, and with less asparagine
Similar to PRSV-R, the yellow crookneck squash were deregulated successively since 2014
(Cucurbita pepo L.) varieties were developed and planting commenced in 2015 on 160
by Seminis Vegetable Seeds Inc. through the hectares. In 2018, a total of 1,700 hectares of
insertion of the viral coat protein genes of Innate® potatoes comprised of 800 hectares of
potyviruses watermelon mosaic virus 2 and Generation 1 and 900 hectares of Generation
zucchini yellow mosaic virus. Biotech squash 2 (with additional late blight resistance trait)
resistant to mosaic and yellow mosaic virus were planted (J.R. Simplot Co., personal
diseases was planted in an estimated 1,000 communication, 2019).
hectares in the USA in 2018.
Benefits of Biotech Crops
Biotech non-browning Arctic®Apples area
increased 2.4-fold According to Brookes and Barfoot (2018), in
the 21 years of commercialization of biotech
In 2018, Arctic® apples (varieties ®Golden crops (1996-2016), the USA accrued the highest
Delicious, ®Granny, and ®Fuji) were planted benefits of US$80.3 billion and US$7.3 billion
on 240 hectares, a 2.4-fold increase from 101 for 2016 alone. The USA, one of the first six
hectares in 2017, when it was first planted. countries to commercialize biotech crops, has
This is comprised of 912,000 trees of the three been benefiting from the technology and is
apple varieties. The total volume of the 2017 expected to retain its position with the most
harvest was close to 200,000 lbs of fruit and number of new biotech crops and traits being
sold in 2018, including fresh market product as developed and commercialized.
sliced Arctic ®Golden apples plus dried Arctic
ApBitz™ apple snacks (dehydrated, fruit-cut Summary and Future Prospects
apples). The fresh slices were test marketed in
conventional retail outlets in limited quantities. In 2018, the biotech area in the USA was 75
Arctic®ApBitz™ dried apples were sold through million hectares, covering 39% of the global
Amazon.com from late March until product was biotech area, with an average adoption rate of
sold out in late summer. There was positive 93% for major crops. The biotech crops planted
market acceptance for the 2018 limited release were soybeans (34.08 million hectares), maize
of Arctic® apples fresh slices in select grocery (33.17 million hectares), cotton (5.06 million
stores and with Arctic ApBitz™ dried apples. hectares), canola (900,000 hectares), sugar
Thus, the availability of the product is being beets (491,000 hectares), alfalfa (1.26 million
expanded in US retail market in 2019. It is hectares), and some 1,000 hectares or so of
projected that approximately 10,000 bins of papaya, squash, potatoes, and apples.
Arctic® apples will be available from the 2019
harvest, which will be composed of Arctic® Weather patterns in the beginning of spring
Golden and Arctic® Granny (Okanagan Specialty 2018 characterized by cold April to warm
Fruits, personal communication, 2019). May, the over supply of water in some
parts in California and some drought in
13United States of America Global Status of Commercialized Biotech/GM Crops: 2018
the southwestern and south central USA biotech IR (Bt) rice developed by Huazhong
contributed to reduced yield. There were Agricultural University. US FDA ruled that
also late spring downpours in the middle and the biotech event Huahui No.1 rice are not
southern Atlantic states that curtailed fieldwork materially different in composition, safety and
and caused local flooding. Despite the reduced other relevant parameters from rice-derived
drought in some parts of the USA, a core human and animal food currently on the
drought area persisted across the southern market, and that genetically engineered Huahui
High Plains and South West. These, among No.1 grain does not raise issues that would
other things contributed to the reduced planting require premarket review or approval by FDA
of biotech crops in the USA. (Crop Biotech Update, January 24, 2018). US
FDA also approved the biosafety of Golden Rice
The USA has been a leader in the discovery, GR2E, a rice genetically engineered to produce
development, and commercialization of biotech provitamin A carotenoids. The agency concurs
crops. Under the US President Donald J. Trump’s with the assessment of the International Rice
administration, various initiatives have been Research Institute (IRRI), regarding the safety
put in place to expedite and make regulations and nutrition of Golden Rice. This is the third
transparent including the conscious effort of positive food safety evaluation of Golden Rice,
biotech food labelling. after the approval granted by Food Standards
Australia New Zealand (FSANZ) and Health
During the American Farm Bureau Federation’s Canada in February and March 2018 (Crop
2018 Annual Convention held in Nashville, Biotech Update, May 30, 2018). In addition, US
Tennessee on January 5-10, 2018, President FDA approved Bt sugarcane developed from
Trump said, “We are streamlining regulations Brazil which produces raw and refined sugar
that have blocked cutting edge biotechnology, not materially different in composition from
setting free our farmers to innovate, thrive raw and refined sugar from other sugarcane
and to grow.” His remarks were delivered to varieties (Crop Biotech Update, August 15,
7,500 farmers and ranchers gathered at the 2018).
Convention. Moreover, he decried the costs of
excessive regulation, and touched on issues USDA APHIS on the other hand, approved
of particular importance to agriculturists for environmental release biotech cotton
such as regulations, labor, and trade (Crop with resistance to herbicides glyphosate and
Biotech Update, January 17, 2018). The USDA isoxaflutole from Bayer (Crop Biotech Update,
and FDA are committed to modernize the July 25, 2018); a canola variety developed by
Coordinated Framework for the Regulation Nuseed Americas Inc. that contains high levels
of Biotechnology and the U.S. agricultural of docosahexaenoic acid (DHA), an omega
biotechnology regulatory system to develop 3-fatty acid (Crop Biotech Update, August 29,
efficient, science-based regulatory practices for 2018); and a GE low-gossypol cotton developed
products of biotechnology with assistance from by Texas A&M, which reduces refining cost of
other federal agencies, as part of the National cottonseed oil (to get rid of cotton protectant
Strategy for Modernizing the Regulatory gossypol) and expands the application of
Systems for Biotechnology Products (Crop cottonseed in the livestock and aquaculture
Biotech Update, February 7, 20018). feed industries (Crop Biotech Update, October
24, 2018).
New and impactful regulatory approvals for
controversial biotech crops were conducted in Biotech crops that are in the pipeline and in
2018 including USA FDA’s approval of China’s field trials include triple stack trait biotech
14Global Status of Commercialized Biotech/GM Crops: 2018 Brazil
rice with better yield amidst abiotic stresses, Biotech Cotton Biotech Sugarcane
1.0 Mhas
biotech chestnut tree with resistance to (2%)
0.4 Mhas
(1%)
chestnut blight, biotech citrus greening
resistant citrus, and an upcoming potato
enriched with beta carotene developed by
Italian and American scientists, among others.
Biotech Maize
15.38 Mhas
Animal biotechnology has also gained ground (30%)
Biotech Soybeans
in the USA with biotech salmon that matures 34.86 Mhas
half the time compared to the non-biotech (67%)
counterpart. Aquabounty, the US-based
company that developed the biotech salmon,
sold some 7 tons of the GM fish in Canada
since 2017, and has been given approval by
the US FDA for its commercialization in the
USA in 2019 (AquaBounty, 2019). Figure 4. Biotech Crops Planted in Brazil,
2018
Source: ISAAA, 2018
BRAZIL
Brazil planted the second largest area of
biotech crops globally in 2018 at 51.3 million compared to 2017. The 34.86 million hectares
hectares compared to 50.2 million hectares of biotech soybeans was comprised of 42%
in 2017, a 2% increase or 1 million hectares, (14.6 million hectares) HT and 58% (20.2 million
and represents 27% of the global biotech area hectares) stacked IR/HT. The stacked trait IR/HT
of 191.7 million hectares. The biotech crops (Intacta™), which was first introduced in 2013 on
planted in the country include soybeans at 2.2 million hectares, increased to 20.2 million
34.86 million hectares; maize (summer and hectares in 2018, compared to 20.1 million
winter) at 15.38 million hectares; cotton at 1.0 hectares in 2017, a slight increase due to lower
million hectares; and 400 hectares sugarcane, pest incidence.
the first time in Brazil. The total planted area of
soybeans, maize, and cotton (conventional and In a study by Brookes and Barfoot (2018),
biotech) in Brazil was 54.88 million hectares, the increased use of stacked IR/HT soybeans
a 1% increase from 53.39 million hectares in (Intacta™) in the whole of South America has
2017. The 51.3 million hectares of biotech crop benefitted farmers with an increase in income
area is a 93% adoption rate, a 1% reduction of US$7.64 billion for the first five years of
from 2017 (Figure 4). adoption. The study highlighted the benefits
that accrued over the five-year period with 73.6
Biotech soybean adoption rate was ~96% million total hectares. For every additional US$1
spent on Intacta™ soybean seed, farmers have
Biotech soybeans were planted on 34.86 gained US$3.88 additional profit. This income
million hectares at 96% adoption rate gains are due to increase in yields and reduced
(compared to 97% in 2017), of the total 36.39 expenses for weed and pest control. The
million hectares soybeans in 2018. The total technology has decreased pesticide spraying by
soybean area increased by 4.8%, while biotech 10.44 million kg and reduced greenhouse gas
soybean area increased by 3.4% in 2018 emissions equivalent to removing 3.3 million
15Brazil Global Status of Commercialized Biotech/GM Crops: 2018
cars off the roads (Crop Biotech Update, August hectares), 16.9% HT (173,000 hectares) and
29, 2018). 73.6% IR/HT (754,000 hectares). The adoption
rate of biotech cotton was similar to 2017 at
Biotech maize adoption rate was 89% 84% (Table 7).
The total summer and winter maize planted Biotech insect resistant sugarcane planted
in Brazil decreased slightly by 1.5% (279,000 in Brazil for the first time
hectares) from 17.6 million hectares in 2017 to
17.3 million hectares in 2018. However, biotech In 2018, 100 sugar mills in Brazil planted
maize adoption rate increased slightly from some 400 hectares of insect resistant
88.9% (at 15.6 million hectares) in 2017 to 89% biotech sugarcane variety, developed by
(15.4 million hectares) in 2018. The 15.4 million Centro de Technologica Canavieira (CTC)
hectares biotech maize was comprised of 4.4 (Reuters, March 3, 2018). The National
million hectares IR, 646,000 hectares HT and Biosafety Technical Commission approved
10.3 million hectares IR/HT. The stacked trait Bt sugarcane after proving that the sugar
maize decreased by 1.4 million hectares (-11%) and ethanol obtained from it are identical
(Table 6). to conventional sugarcane. The biotech
sugarcane is one of the best solutions against
Biotech cotton adoption was 84%, similar to the cane borer which costs US$1.5 billion
2017 losses and insecticide expense annually. This
first planting of Bt sugarcane is projected to
The total cotton area in 2018 increased by improve yields, reduce production costs, and
100,000 hectares from 1.1 million hectares increase profits. Studies also showed that
in 2017 to 1.2 million hectares in 2018. The the Bt gene and protein were completely
increased total cotton area contributed to eliminated from sugarcane products after
the 19% increase of biotech cotton area from processing. Environmental studies further
940,000 hectares in 2017 to 1.025 million showed that Bt sugarcane does not cause
hectares in 2018. The 1.025 million hectares of negative effects.
biotech cotton was comprised of 9.6% IR (98,000
Table 6. Total and Trait Hectares of Biotech Maize in Brazil, 2017-2018
Area Planted (MHa) % Trait Hectares
2017 2018 2017 2018
Total Maize 17.55 17.28
IR 3.26 4.43 20.9 28.8
HT 0.66 0.65 4.2 4.2
IR/HT 11.69 10.30 74.9 67.0
Total Biotech Maize 15.60 15.38 88.9* 89.0*
* Adoption rate
Source: ISAAA, 2018
16You can also read