BLUE CARBON STOCKS AND ACCUMULATION ANALYSIS FOR SECRETARY OF STATE (SOS) REGION: AUTHOR(S): RUTH PARKER, LISA BENSON, CAROLYN GRAVES, SILKE ...
←
→
Page content transcription
If your browser does not render page correctly, please read the page content below
World Class Science for the Marine and Freshwater Environment

Blue Carbon stocks and
accumulation analysis for Secretary
of State (SoS) region:

Author(s): Ruth Parker, Lisa Benson, Carolyn Graves, Silke Kröger, Rui Vieira

Issue Date: March 2021
Cefas Document Control

Submitted to:                Laura Harland

Date submitted:              24/05/2021

Project Manager:             Jacqueline Read

Report compiled by:          Ruth Parker, Lisa Benson, Carolyn Graves, Silke Kröger, Rui Vieira

Quality control by:          Stephen Dye

Approved by and date:        Stephen Dye (26/10/2020)

Version:                     V6

                     Ruth Parker, Lisa Benson, Carolyn Graves, Silke Kröger, Rui Vieira
Recommended citation Carbon stocks and accumulation analysis for Secretary of State (SoS)
for this report:     region: (2020) Cefas Project Report for Defra, 42 pp.

                                     Version Control History

Version         Author              Date               Comment

V1              Parker et al.       22/10/2020         Initial draft for Cefas Review
V2              Parker et al.       22/10/2020         Final version to Defra for comment
                                                       Final version to       Defra for     finalising
V3              Parker et al.       05/11/2020
                                                       comments
V4              Parker et al.,      16/12/2020         Final draft to Defra
V5              Parker et al.,      16/03/2021         Response to Defra comments
V6              Parker et al.,      24/05/2021         Response to final Defra comments

                                                                                                         2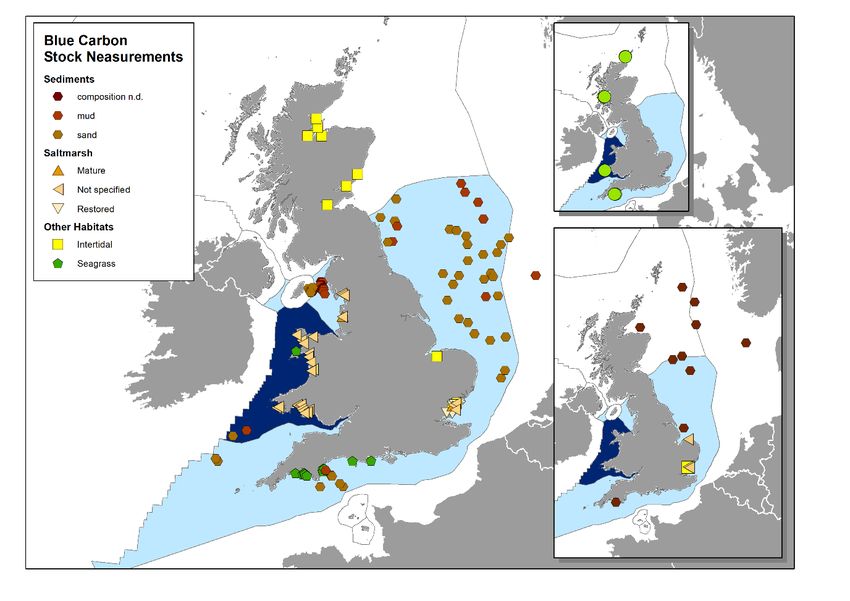
Introduction:
The ocean and climate are closely linked through the global carbon cycle, with marine
processes both removing and adding carbon dioxide (CO 2) and other greenhouse gases from
or to the atmosphere. Safeguarding blue carbon uptake and storage therefore helps to
mitigate global warming, ocean acidification and sea-level rise. Management, restoration and
protection of marine blue carbon habitats are potential nature-based solutions to mitigate
against climate change. An overview of carbon storage services provided by different habitats,
and how different activities influence this process, is a fundamental requirement to the
effective management of this component of the marine system. A significant evidence gap
has been a baseline understanding of present stocks and fluxes1 associated with blue carbon
habitats in Secretary of State (SoS) waters (the waters for which the Secretary of State has
responsibility: the English inshore and offshore and Northern Ireland offshore zones) and UK
Exclusive Economic Zone (EEZ); a gap this report addresses through an extensive review of
the relevant literature.
Which habitats are considered most important?
Habitats internationally considered most important in terms of their contribution to the
formation and storage of blue carbon are saltmarshes, seagrass meadows and mangroves
(though the latter not in the UK context). Coastal vegetation is very effective in sequestering
carbon (taking it out of circulation from the atmosphere) by burying it in root system s and
surrounding muddy sediments. This process is primarily driven by local plant growth but may
also involve the trapping of organic material originating elsewhere. Recently though,
macroalgae (including kelp), intertidal sediments, subtidal sediments and deep mud / slope
(>200m) habitats have also received attention as having potential to act as key stocks/sources
of organic material, carbon reservoirs, or habitats which actively store carbon long-term
(Diesing et al., 2017; Kröger et al., 2018; Wilson et al., 2018; Attwood et al., 2020; Legge et
al., 2020; Turrell et al., 2020).
Methodology:
A review of the published literature was undertaken to provide a meta-analysis of the
evidence base and report carbon stock (carbon stored within the habitat) and accumulation
rate 1 information of Particulate Organic Carbon (POC) for the key blue carbon habitats within
SoS (and where possible UK EEZ) waters. The associated data were compiled into a database
of over 500 records, extracted from 114 publications. The focus was on literature reporting
measurements within the UK but also some global-scale reviews to enable comparison of
contrasting CO2 sequestration capacity for a given habitat where UK values were absent
(namely seagrasses). Where raw data from the literature were available these were added
into the database. Raw data includes where original measured values for carbon density,

1
  Carbon fluxes, in the context of accumulation of buried carbon in sediments of blue carbon habitats, are
referred to throughout this report as “carbon accumulation rates”, to clarify that blue carbon sediments
provide long-term carbon storage. The carbon flux is therefore considered unidirectional: with carbon flowing
into, but not out of, blue carbon sediments. In addition to providing long-term storage of carbon in marine
sediments, these habitats exchange carbon (and other greenhouse gasses) with the atmosphere and ocean
environments. Net carbon fluxes, in terms of CO 2 equivalence and climate mitigation, should consider both
carbon accumulation and these other, shorter timescale, greenhouse gas exchange processes.

                                                                                                            3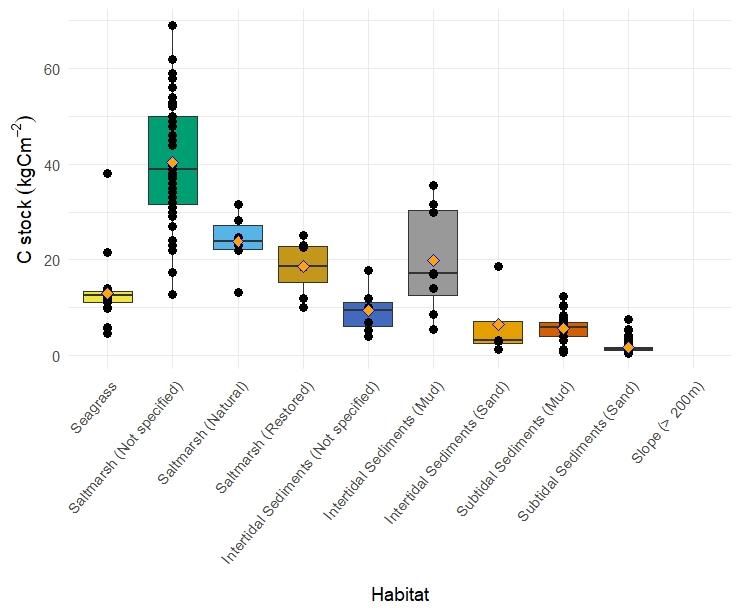
carbon stock, or carbon accumulation were reported for individual sediment samples,
replicates, or in some cases aggregation of sites.
The stock and accumulation rate information were then examined and analysed within
habitat categories to determine if the evidence base was sufficient; whether conservation;
management or restoration measures affected the blue carbon status (condition) of the
habitats and associated estimates of average stocks and accumulation rates.
The evidence summaries and literature list (see Annex 1) were reviewed by selected UK
experts for each habitat to ensure that the evidence base had been captured accurately and
that associated recommendations represented research community consensus.
Stocks and accumulation summary:
A summary of the compilation of carbon stocks and accumulation rates for the key blue
carbon (BC) habitats and resulting ranges and average values are reported in Table 1 below
for Secretary of State (SoS) waters (Annex 1 for UK EEZ). The stock and accumulation rate
information provides a good initial assessment of the ranges in carbon stores and burial rates.
The final average stock and accumulation rates provided (in Figures 1 and 2; Table s 1) provide
the best available summary of evidence from observations within SoS waters. It should be
noted that there is an inherent uncertainty associated with each measurement itself (black
points in the figures) and the habitat averages will include geographical and site specific biases
depending on the distribution of sampling locations at local and regional scales. As indicated
by n values within Table 1, there are also differing numbers of samples underlying average
values across each habitat. For example only 4 data points could be summarised to calculate
an average for intertidal sand carbon stocks whereas 68 data points were available to be
summarised for subtidal sands. For accumulation rates low sample numbers combined with
varied results contribute to average accumulation rates with large error values, which it is
important not to overlook when progressing to consider habitats across their whole extents
(see footnote of Table 2). A fuller narrative of the evidence base, caveats and assumptions
appear in the ‘evidence review’ sections by habitat in Annex 1. The literature from which the
data are compiled appears in the ‘references’ section after each habitat review in Annex 1.
Carbon stocks (kg C m-2) for the different ecosystems across SoS waters are given in Figure 1
and in Table 1.

                                                                                                4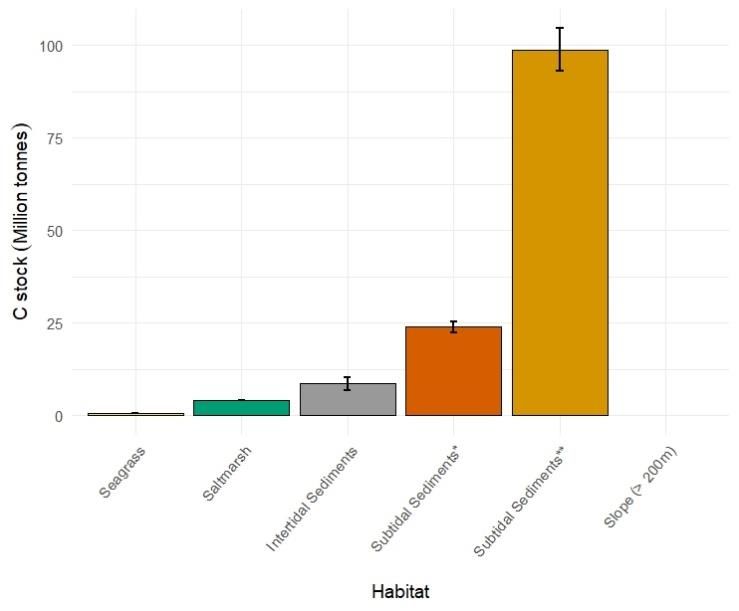
Figure 1: Box plots showing the data distribution of sediment carbon stock values (C stock; kg C m-2) for the SoS waters, to
1m depth, including the minimum, the maximum, the median, and the first and third quartiles of the data. The orange
diamond shows the mean value. Gaps indicate a lack of available data for that habitat.

The highest stocks are observed in the saltmarsh habitats (ranging from 10 to 70 kg C m-2
across natural and restored settings) and intertidal muds (ranging from 5 to 35 kg C m-2). Both
these habitats have high levels of variability associated with them. Seagrass values show much
less variability with an average stock of 13.7 ± 0.2 kg C m-2. Intertidal sands and subtidal
sediments (muds and sands) all show a lower stock level of 6.5 (± 4.0); 6.4 (± 0.4) and 1.8 (±
0.2) kg C m-2 respectively as would be expected with increased sediment oxygenation due to
seabed mobility, reduced supply of POC and increased depth of substrates offshore. The kelp
standing stock biomass numbers are an order of magnitude smaller, with an average 0.31 ±
0.02 kg C m-2, which is expected because these habitats do not include a stored stock in
underlying sediments.
To achieve comparability across habitats, we chose to standardise to a sediment depth of 1 m
below 1 m2 (a total sediment volume of 1 m3) as per IPCC Wetlands Guidance (IPCC, 2014).
Overall, few studies measured or reported POC stocks to this depth (reported depths ranged
from 1 cm to 50 cm and so standarisation to 1m assumes a uniform POC distribution with
depth and hence may over or underestimate stocks depending on the actual POC distribution
with depth). There is a developing convention for subtidal sediments to be reported to 10 cm
but this includes the active processing layer of the sediment, not the full sediment depth. This
is partly a reflection in differences between terrestrial and marine sampling conventions but
especially for subtidal environments is largely a result of monitoring conventions for seas onal
biogeochemical carbon cycling studies, resulting in the largest available datasets being
focused on 0-10cm depth. Agreement on a convention for future measurements across the
coastal-offshore continuum would be ideal.

                                                                                                                               5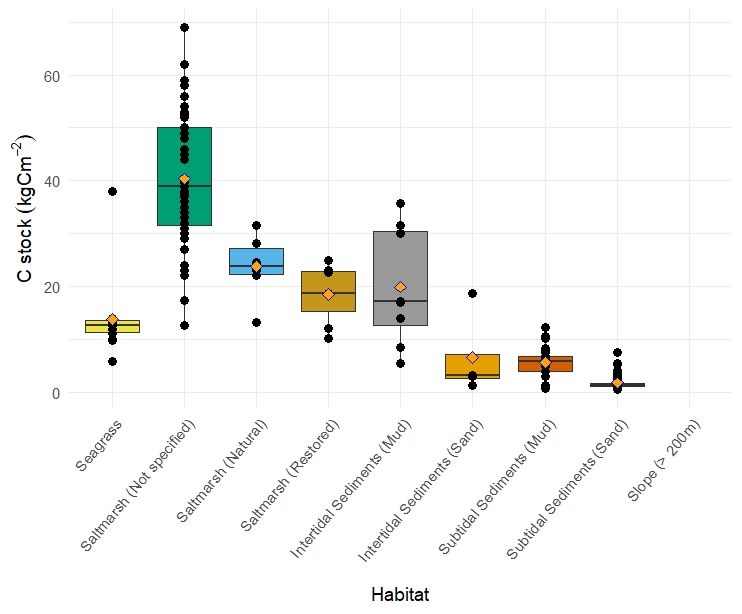
Carbon accumulation rates (g C m-2 yr-1) for the different ecosystems across the UK SoS are
given in Figure 2 and in Table 1.

Figure 2: Box plots showing the data distribution of carbon accumulation rates (gCm -2yr-1) in SoS waters, to 1 m depth
including the minimum, the maximum, the median, and the first and third quartiles of the data. There are no available
seagrass accumulation data for the UK. Data represented for seagrass here are the mean (orange square) and standard
error values reported by Novak et al. (2020) for the Northwest Atlantic. The orange diamond shows the mean value. Gaps
indicate a lack of available data for that habitat.
The evidence base for carbon accumulation rates in SoS water habitats is poor overall. There
is no information for seagrasses, intertidal sands or slope areas.
For seagrass beds in particular, no values were found that had been measured within the SoS
or UK EEZ. UK studies that included values for accumulation rates cited a global average value
based on limited observations in regions not representative of UK habitats (e.g. n=5 studies;
non-temperate; Mediterranean; Duarte et al., 2005). In the absence of measurements in the
UK, the most relevant observations are likely to be those of UK seagrass species (Zostera sp.)
within temperate settings, cite in reviews including multiple measurement sites (e.g. Novak
et al., 2020; Z. marina in North Western Atlantic; Prentice et al., 2020). We propose that
currently, the estimate of Novak et al., of 86 ± 19 g C m-2 yr-1 is the most appropriate estimate.
However, the ranges of values, indicates that the average of even a large number of
observations is unlikely to describe any particular site, so filling this UK evidence gap should
be a priority.
Looking at carbon accumulation rates for the remaining habitats, (Figure 2), saltmarshes
yielded by far the highest values, but also display the biggest range of accumulation rates
across the differing habitat histories (66 to 196 g C m-2 yr-1). Intertidal muds and subtidal
sediments showed lower reported accumulation rates (averages of 83.5 and 29.5 g C m-2 yr-1
respectively) but the evidence base is very poor with
Literature constraints: there is an issue both in the saltmarsh and seagrass literature that
some reports (e.g. Burrows et al., 2014; 2017) have had to use the best available alternative
data where no UK measurements were available but the limitations of doing so are not clear.
These may not reflect the BC storage and accumulation rates of UK habitats. Subsequent
studies have gone on to cite these values as if they represent measurements of UK habitats,
resulting in a growing distance between the cited references in reports and the studies where
the measurements were originally reported, which complicates identification of the primary
evidence base. This potential error can then propagate up to economic valuation studies (e.g.
Watson et al., 2020) without maintaining the original assumptions and caveats.
Early studies, which pre-date the research focus on ‘blue carbon’, made measurements which
can be used to derive stocks and accumulation rates, but often did not publish the information
on all parameters required to derive these values. We expect that more UK data may be
available if unpublished supplemental data could be obtained, and from other older
unpublished datasets. In some cases, reasonable estimates can be made by deriving
estimated sediment bulk density for example, but these calculations introduce additional
sources of uncertainty and have not been considered for this data aggregation. There are
instances (e.g. Atwood et al., 2020) where publications have manipulated data from earlier
studies without clearly identifying methodology, the assumptions made or their implications
on uncertainty.
Habitat status and timescales of change:
Habitat state: For most habitats (seagrasses, intertidal sediments, macroalgae (kelp), subtidal
sediments and slope) there were not sufficient data (not enough measurements) to allow any
statistical assessment of status variability driven by habitat management, history or
impact/degradation. Similarly, for saltmarshes specifically, the habitat state information (for
example; natural/mature, restored, created, management regime) was often not recorded
during all measurements (appears as ‘not specified’ in the figures/tables), so it was not
possible to assign an overall condition level.
The evidence base for saltmarshes does show some difference between restored and natural
sites with both stocks and accumulation rates being lower in the restored sites. However, the
number of measurements of accumulation rates is low (n < 5). The bulk of saltmarsh values
sit in the ‘not specified’ category but it is clear from the distribution that the literature cover
both natural/mature and restored sites.
Similarly, a comparison of natural saltmarsh and managed realignment sites in the Blackwater
estuary (Adam et al., 2012) found that less vegetationally developed (younger) sites had lower
carbon densities and stocks then natural saltmarshes, while those with better developed
vegetation were equal or even higher than their natural counterparts. The factors influencing
vegetation development were not explored in this study but are likely to be complex and
changeable with time, involving for example climate, pressures from uses and state of
adjacent sites, as well as inherent sediment characteristics. A study by Kellaway et al. (2016)
in Australian saltmarshes found that sediment factors were key.
Additionally, UK studies investigating the impacts of grazing intensity across 22 saltmarshes
showed no difference in soil organic carbon content (see saltmarsh review in Annex 1 for
more info).

                                                                                                 7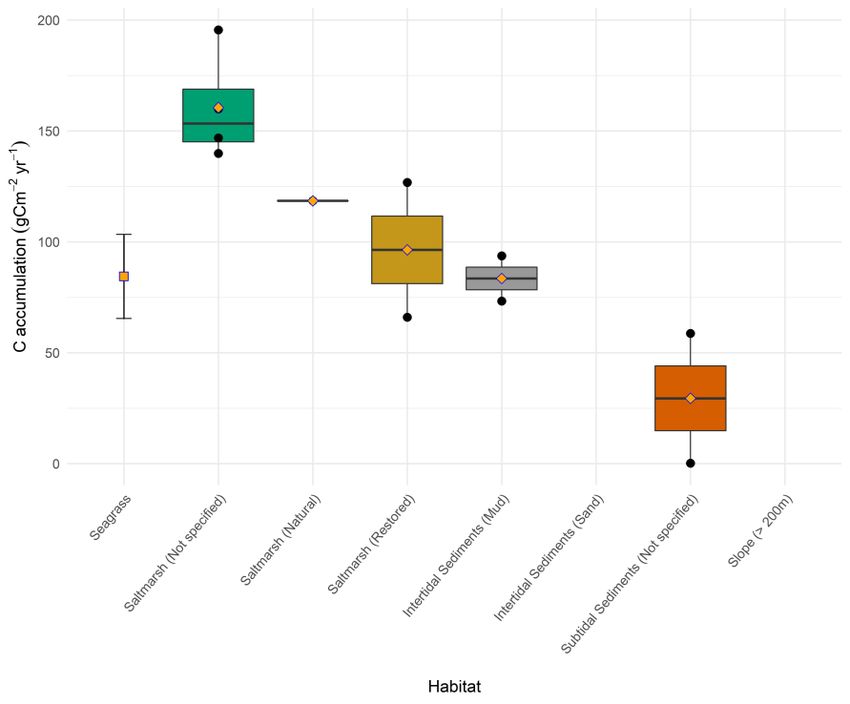
Timescales of change: The timescale associated with habitat age/condition/history was only
reported for saltmarshes. In one study (Burden et al., 2019; see saltmarsh review) evaluating
the length of time a recreated marsh will take to become functionally equivalent to a natural
system, the authors conclude that carbon accumulation was initially rapid then slowed to a
steady rate and that it would take approximately 100 years for a restored saltmarsh to reach
the same carbon stock as a natural site.
A study exploring the effect of returning some 26 km 2 of reclaimed land in the Humber estuary
to intertidal habitats such as mudflats and saltmarshes (Andrew et al., 2008), through
managed realignment, suggests it could result in extra storage of about 800 t of carbon per
year, along with extra storage of nitrogen, phosphorus and heavy metals. The authors state,
that over the last 50 years almost 14,000 tonnes of organic carbon were stored in Welwick
Marsh. Furthermore, historic reclamation between 1744 and 1965 of about 35 km2 of
saltmarsh in the same area has probably prevented burial of some 200,000 tonnes of organic
carbon and 11,000 tonnes of organic nitrogen . While the authors do not specifically discuss
future restoration timescales, they do suggest based on their previous work that managed
realignment schemes are likely to be cost effective on a 50-year time frame. Generally, time-
scale analysis of land reclamation or habitat restoration and their effect on carbon
accumulation and long-term storage are sparse and should be considered as a next step.

SoS total POC stock and accumulation rates:
Linking the stock and accumulation rate information together with the habitat extent (JNCC,
2020) allows an initial understanding of the total carbon stock or carbon sequestration rates
associated across the SoS. The extents, total stock and accumulation, and CO 2 equivalents
across the SoS are shown in Table 2 and Figure 3a (stock) and b (accumulation) below.

                                                                                            8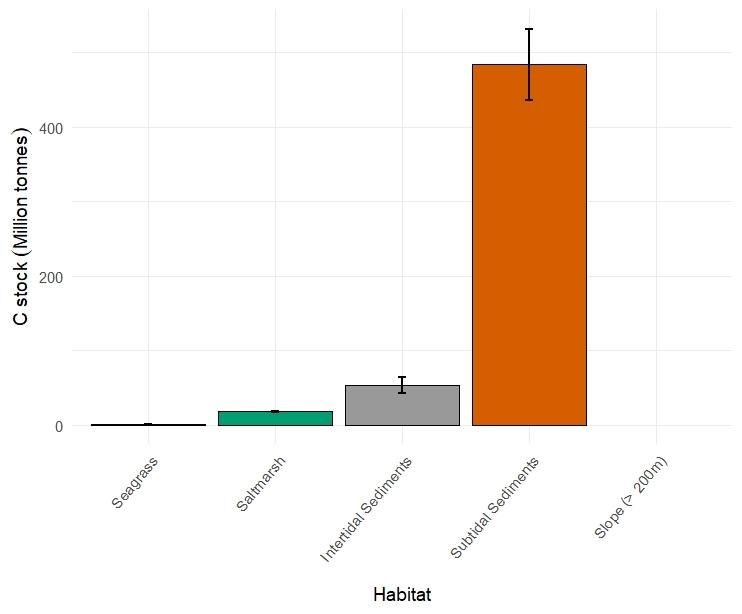
Table 1: A summary of SoS blue carbon habitat sediment organic carbon stocks and accumulation rates. ‘nd’ = not determined

                                                                                          Range of organic       Average organic carbon
                                    Range of sediment       Average organic carbon
                                                                                              carbon               accumulation rate
    Habitat       Granularity      organic carbon stock    sediment stock (kg C m-2)                                                      Number of studies / references
                                                                                         accumulation rate            (gC m-2 yr-1)
                                        (kg C m-2)                  (± SE)
                                                                                            (gC m-2 yr-1)                (± SE)
                                                                                                                                          Sediment carbon stocks = 2 studies (Green et al.,
                                                                      13.7
                                                                                                                                          2018; Röhr et al., 2018); Sediment C accumulation
    Seagrass                             5.9 - 38.0                  (± 0.2)                    nd                     [86 ± 19] *
                                                                                                                                          rates – Novak et al., 2020 (non-UK - summary
                                                                    (n = 14)
                                                                                                                                          estimate temperate, N. W. Atlantic sites)
                                                                      40.3                                               160.6
                  Not specified         12.7 - 69.0                  (± 0.4)               139.9 - 195.5                (± 12.4)          Sediment C stocks = 7 studies; (Adams et al., 2012;
                                                                    (n = 59)                                             (n = 4)          Beaumont et al., 2014; Burden et al., 2019;
                                                                      23.8                                                                Burrows et al., 2014; Cannell et al., 1999; Chmura
                                                                                                                         118.5
   Saltmarsh         Natural            13.2 - 31.6                  (± 0.2)                    NA                                        et al., 2003a; Ford et al., 2019)
                                                                                                                         (n = 1)
                                                                    (n = 16)
                                                                      18.6                                                96.4            Sediment C Accumulation = 2 studies (Callaway et
                    Restored            10.1 - 25.0                  (± 0.4)                66.0 - 126.8                (± 30.4)          al., 1996; Adams et al., 2012)
                                                                     (n = 7)                                             (n = 2)
                                                                      19.9                                                83.5
                      Mud                5.4 - 35.6                  (± 4.0)                73.3 - 93.7                 (± 10.2)          Sediment carbon stocks = 3 studies (Trimmer et al.,
    Intertidal                                                       (n = 8)                                             (n = 2)          1998; Thornton et al., 2002; Adams et al., 2012)
   Sediments                                                           6.5                                                                Sediment carbon accumulation rates = 1 study
                      Sand               1.3 - 18.6                  (± 4.0)                    nd                           Nd           (Adams et al., 2012)
                                                                     (n = 4)
                                                                   6.4 (± 0.4)
                      Mud                3.1 - 12.3                                                                       29.5            Sediment carbon stocks - Multiple Cefas surveys
    Subtidal                                                        (n = 23)
                                                                                             0.2 – 58.7                 (± 29.3)          Sediment C accumulation rates = 2 studies (De Haas
   Sediments                                                       1.8 (± 0.2)
                      Sand               0.4 - 7.6                                                                       (n = 2)          et al., 1997; Queirós et al., 2019)
                                                                    (n = 68)

      Slope
                                            nd                         nd                       nd                           nd           NA
    (>200m)
                                                           Average biomass standing
                                                                 stock (kgCm-2)
                                                                0.309 (± 0.017)
      Kelp                                  nd                                                  NA                           NA           Pessarrodona et al., 2018
                                                                     (n = 4)

                                                                                                                                                                                     9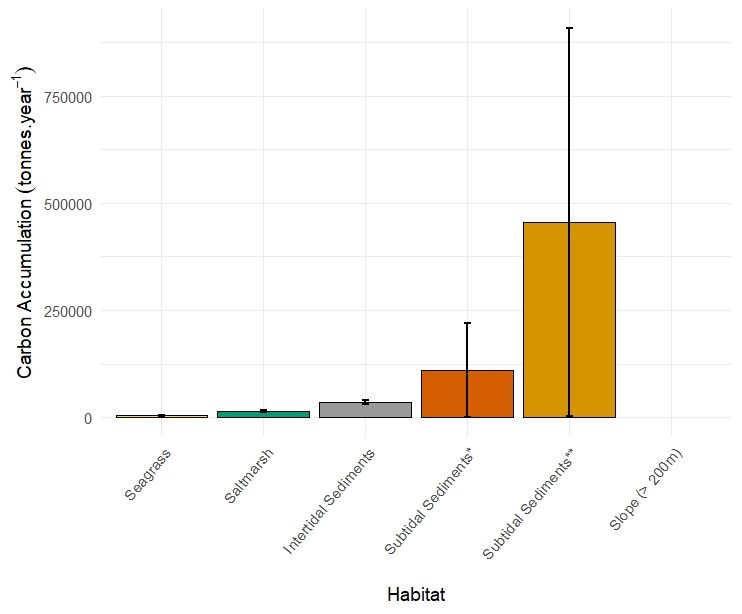
Table 2: a summary table of SoS blue carbon Habitat extents, average habitat carbon stocks and accumulation rates, total stock and total accumulation rates, and CO2 equivalents. ‘nd’
indicates not determined.

                        Extent (km2)                               Average carbon                                      Total                                          CO2 equivalent
                                           Average carbon                                   Total stock                                 CO2 equivalent stock
      Habitat          (Flavell et al.,                             accumulation                                   accumulation                                        accumulation
                                            stock (kgCm-2)                               (million tonnes C)                             (million tonnes CO 2)
                           2020)                                     (gC m-2yr -1)                                 (tonnes C yr -1)                                  (tonnes CO 2 yr -1)
                                                  13.7                                           0.66                  4080                       2.4                      15,000
     Seagrass                48                                       [86 ± 19] *
                                                 (± 0.2)                                       (± 0.01)               (± 912)                  (± 0.03)                   (± 3,300)
                                                  36.8                   136.2                   4.05                 15,000                     14.8                      55,000
     Saltmarsh              110
                                                 (± 0.5)                (± 15.1)               (± 0.06)              (± 1,700)                  (± 0.2)                   (± 6,000)
 Intertidal (mud)                                 19.9                    83.5                    8.6                 36,000                     31.4                      132,000
                            431
    sediments                                    (± 4.0)                (± 10.2)                (± 1.7)              (± 4,000)                  (± 6.3)                  (± 16,000)
                                                                                                 23.9                 110,000                    87.5                     403,000
                           3732
  Subtidal (mud)                                   6.4                    29.5                  (± 1.4)             (± 109,000)                (± 5.07)                 (± 400,000)
    sediments                                    (± 0.4)                (± 29.3)                 98.8                 455,000                   362.1                    1,667,000
                          15,440
                                                                                                (± 5.7)             (± 452,000)                 (± 21)                 (± 1,656,000)
       Slope                131                    nd                      nd                     nd                     nd                       nd                         nd
                                            Average biomass                                  Total biomass                               CO2 equivalent total
                                          standing stock (kgCm-                              standing stock                             biomass standing stock
                                                    2)                                      (million tonnes)                               (million tonnes)
                                                  0.31                                          0.074                                           0.271
        Kelp                239                                            na                                            na                                                  na
                                               (± 0.017)                                       (± 0.004)                                       (± 0.015)

NB: For both tables - saltmarsh in this case includes saline reedbeds; intertidal sediments includes mud and sand (extent is “littoral mud”), subtidal sediments includes
mud and sand (extent is “sublittoral mud’) and kelp/macroalgae is only kelp biomass. The subtidal sediment (mud) extents and stock and accumulation levels are reported
using the 50% and 10% mud/sand boundaries respectively as described below. All habitat organic carbon (OC) stocks are reported to a sediment depth of 1 m as per IPCC
guidance. The standard error (±) provided for total stock and accumulation rates is based only on the reported standard error of the average stock and accumulation rate
derived in this report and does not take into account the unquantified uncertainty of the habitat extent values of Flavel et al., 2020 which were reported with a confidence
rating but not an uncertainty range. Any uncertainty in the habitat extent would need to be propagated through the calculation of total stock and accumulation rate values.
In sum, the ‘total’ values presented here are therefore minimum potential variances rather then complete. The SoS stock and accumulation rate averages include data
from Wales as well (mainly saltmarshes) to improve the confidence level of this average and in light of the little variance between geographic areas across England and
Wales. The burial rates for seagrasses use a Northwest Atlantic average (Novak et al., 2020) in the absence of UK information.

                                                                                                                                                                                           10
a) b)
Figure 3: Box plots showing the total carbon stock a) and annual accumulation b) for the SoS waters, to 1 m depth as listed in Table 2. The error bars are the +/- as standard errors.
The gap in slope data indicates where totals have not been determined due to gaps in stock and burial evi dence. The subtidal sediment (mud) totals for stock and accumulation
are reported using the 50%* and 10%* mud/sand boundaries respectively.
11Overall, the POC stock held in the non-conventional blue carbon habitats, intertidal and
seabed sediments (8.6 and 23.9 million tonnes respectively) is nearly an order of magnitude
bigger than the other coastal habitats (0.7 and 4.1 million tonnes for seagrasses and saltmarsh
respectively). This is consistent with findings in Legge et al. (2020) and Kröger et al. (2018) for
the UK Shelf and North–West European Shelf regions. The seabed sediments (sublittoral
muds) have the largest potential accumulation total, compared to other habitats, at ~ 0.1 to
0.5 million tonnes C per annum, although this is based on very few rate measurements, so
has significant uncertainties and is produced largely by the large extents of this habitat. This
gives some context in the comparative reservoirs of carbon residing within these habitats and
their role in sequestering atmospheric CO 2 long-term.
Habitat boundaries: EUNIS (European Nature Information System) habitat classification
carbon processing - The extents used here are derived from the JNCC report (2020) on SoS
habitat extents based on EUNIS habitat classification. It should be noted that EUNIS is based
on Folk classification sediment types (mud and sandy-mud for littoral, sublittoral and deep-
sea muds defined as approximately 50% fines/sand). This does not account directly for
sediment permeability transitions which drive POC storage and fate which occur at ~ 10%
fines alone (Parker et al., 2012; Silburn et al., 2018). This means that the area extents for these
habitats relevant to areas of POC storage are very likely significant underestimates. The stock
and accumulation values (Table 2 and Figures 1 and 2) for the subtidal sediment take the
~10% fines boundaries into account. When scaled to total stock and accumulation rates the
extents of both the 50% and 10% fines boundaries are reported for the sub-tidal sediments.
CO2 equivalents: the total carbon stored as CO2 equivalents, held in SoS blue carbon habitats
(excluding a small slope extent which has no measurements) is ~136 million tonnes, with shelf
and intertidal sediment stocks accounting for ~64% and 23% of this stock respectively. The
total stock is equivalent to about 37% of the UK total annual emissions in 2019. Combining
the stock and accumulation rate CO2 equivalents for each habitat allows some estimation of
the potential achievable impact on CO 2 sinks of different policies on habitat management
creation, restoration or protection. For example: if 15% of saltmarsh extent is re-
established/created it will allow an additional storage of 2.25 million tonnes once the habitat
is fully established (~100yrs; Burden et al., 2019) and increases the annual accumulation by
8250 tonnes of CO2. The trajectories of carbon burial and green house gas emissions (and
hence net C sequestration) can be complex and non-linear over time (Adams et al., 2012).
Considering the timescales of this service delivery (under habitat creation or restoration),
change under impact / recovery and also future change (under climate change) of carbon and
CO2 stock/accumulation rate, it is important to understand the future benefits these habitats
can offer in terms of climate mitigation. Similarly, protection of seabed stocks or coastal
habitats have the potential to avoid emissions in future, although the evidence base to
understand changes of this type needs improvement. While it is apparent that GHG emissions
occur if coastal habitats (seagrasses, saltmarshes) are disturbed, eroded or destroyed, the
understanding of the net effects of disturbance on intertidal, subtidal and slope sediments on
GHG release is still unclear (Legge et al., 2020). Similarly, the dynamics of irrecoverability (i.e.
what proportion of carbon loss is permanent or can be recovered under
protection/restoration) and the associated timescales of the achievable benefits needs
systematic understanding (Goldstein et al., 2020).
12Status of the SoS waters evidence base:
Below is a summary of the confidence level of the evidence base for stocks/accumulation
rates associated with each blue carbon habitat across the SoS waters. The confidence rating
used is the Marine Climate Change Impacts PartnershipPartnership approach (MCCIP 2011)
based upon level of evidence and consensus across the literature relevant to SoS waters.
Seagrasses: LOW/LOW Existing information indicates that seagrass stock per unit area is
significant at 13.7 (± 0.2) Kg C m-2 which scales to a total SoS stock of 0.7 million tonnes.
Linking to the temperate storage rates (86 +/- 19 g C m-2 yr-1) gives considerable SoS total
accumulation of 4080 g C per annum. While this ecosystem has by far the smallest extent,
and thus very likely plays only a minor role in the total carbon accumulation and storage
budget in SoS waters, it is evident that very little is known about POC stocks across the SoS
waters and particularly about region-specific accumulation rates.
Saltmarshes: MEDIUM/LOW these ecosystems are hugely important both in terms of total
stocks and annual carbon accumulation rates and the evidence base is the most robust across
the coastal habitats. However, existing observations are focused on Welsh and Essex estuaries
(see Figure A1). A better geographical spread of observations is required to reduce the
uncertainty in the SoS-wide or UK-wide average. A significant dataset of stocks and some
accumulation rate measurements will be coming on-line in mid-2021 as part of the NERC
CSide (Carbon Storage in Intertidal Environments) project2.
Intertidal mud and sandflats: LOW/LOW These ecosystems have not yet received the
attention they deserve in the blue carbon context as the literature base has largely focused
on establishing the seasonal variability in the processing of carbon. However, as the numbers
in Table 1 illustrate, they are likely to contain significant total carbon stores and with their
high annual accumulation rates contribute to capturing large amounts of carbon. The
evidence base is focused on a few locations on the east coast (Colne, Ouse, Blackwater and
Humber) so further measurements with a more even geographical distribution are advisable.
Shelf seabed: MEDIUM/LOW This review highlights the dominance of the shelf seabed as a
carbon reservoir and its potential capacity to annually sequester carbon and store it long -
term. However, despite good stock information (for the upper 10 cm of sediment) the
evidence base for sequestration rates is very poor and biased, to an unknown degree, across
the UK EEZ towards measurements in high sequestration environments (namely, sea lochs).
Deeper measurements (ideally to 1 m sediment depth) would shed light on long-term carbon
fate and enable extrapolation to an equivalent depth as used for other habitats. For more
accurate assessments of total seabed stocks and accumulation, some refinement of the
extents (beyond mud/sandy-mud) would be useful to represent all substrates which can store
POC.
Slopes: LOW/LOW These are sea areas where carbon parameters are particularly
underrepresented in terms of measurements, with no measurements within the SoS waters,
which is understandable given their inaccessible nature. Nevertheless, a dedicated
2
NERC CSide (Carbon Storage in Intertidal Environments) project information will be
available via https://www.c-side.org/
13programme to evaluate their role in carbon storage is desirable, given the large sequestration
potential due to the deep, cold nature of these substrates.
Kelp: MEDIUM/LOW This review has shown that the macroalgal (kelp) biomass carbon
storage is potentially significant per unit area (0.31 Kg C m-2). Across the UK SoS waters these
data scale to a biomass reservoir of 0.074 million tonnes C. However, this only contributes to
long-term carbon storage if the biomass is buried long-term in a receiving habitat area
(intertidal or shelf seabed). The evidence base on the fate of macroalgal / kelp carbon is very
poorly constrained (with ranges from 4 to 9% of biomass being stored in sediments; Querios
et al., 2019) and remains a key gap.
14Linking gaps in the evidence base and recommendations for priorities, next
steps:
This review provides a good but snap-shot understanding of the status of the evidence base
for SoS blue carbon habitats. There are significant gaps in the evidence base, perhaps not
initially apparent from the literature due to the large number of reviews and global
measurements used in publications relating to the UK. This work has led to a number of
recommendations;
1. Targeted observations of carbon stocks and accumulation rates are required across
the main blue carbon habitats to improve the evidence base overall and gap-fill in
certain geographical locations to understand regional variability and ensure
aggregated values are representative of any spatial variability or site specific
controlling mechanisms (salinity, temperature, context). This is true especially for
seagrasses (where the carbon evidence base for both stocks and accumulation rates
is poor), intertidal and shelf sediments as well as slope sediments, due to the very low
numbers of measurements of accumulation rates and the potential overall stock
significance of these habitats due to their significant extents.
Furthermore, it must be stressed that a SoS or UK EEZ wide stock or accumulation
average (even if well constrained by numerous geographically dispersed
measurements) may not be representative of actual stock or accumulation rates for
any given site. The spread of available measurements within the UK to date represent,
not uncertainty in those values for the sites studied, but uncertainty in an appropriate
average over the extent of any habitat in the UK. As observations increase in both
number and geographical spread, these should include the information needed to
parameterise the between-site variability so that future SoS and UK-wide estimates
can account for differences of relevant habitat condition and context controlling
factors for blue carbon.
2. Provenance of the shelf Particulate Organic Carbon (POC) stock is also key (terrestrial
vs marine, POC source such as from coastal habitats, macroalgae (kelp) or other
sources) to aid management decisions. Particular habitats such as macroalgae (kelp)
act as carbon donors rather than burying in situ and understanding supply amounts
and pathways from these carbon capture habitats to receiver areas on the shelf are
key, both to understand fate/sink but also in terms of management and protection of
stocks from disturbance. While focus on the fate of macroalgal carbon is increasing,
the broader evidence base around shelf carbon provenance remains poor.
3. Inclusion in monitoring: The sampling protocols required for determining POC stocks
and accumulation rates are relatively low cost and routine (core sampling, POC
concentration determination). The only higher costs element is isotopic analysis for
sediment accumulation rates, but again these are standard geochemical techniques.
Given this fact and that the evidence base is generally so poor there is scope for urgent
inclusion of key blue carbon parameters in existing monitoring of the main blue carbon
habitats to rapidly raise the confidence of the evidence base. There is an urgent need
to link up monitoring in a systematic way to allow reporting of robust
stocks/accumulation rate assessments across SoS / UK EEZ and also to consider how
15IPCC/UNFCCC or other requirements can be included. For coastal wetland habitats (i.e.
saltmarsh and seagrass) to meet the IPCC reporting standards for UK GHG emission
accounting, there are several data gaps to resolve, such as the collection of accurate
spatial data of habitats, including changes and loss due to specific activities and the
establishment of consistent baseline time series. UK-based measurements of carbon
stock and accumulation rates would also be required to provide accurate emission or
removal totals. There are considerable present opportunities across coastal
biodiversity sampling programmes such as the Natural England ReMEDIES
(Seagrasses) and Environment Agency ReMeMaRe (Restoring Meadows, Marshes and
Reefs) initiatives as well as various intertidal and offshore sampling opportunities,
including in Scotland and other Devolved Administrations, and they provide integrated
sampling opportunities for various requirements which will add considerable value to
these programmes. Understanding the requirements for differing policy drivers across
climate mitigation/blue carbon (including requirements for future Greenhouse Gas
Inventory reporting), Natural Capital accounts and valuation, in support for Nature-
based Solutions and Marine Protected Area/Highly Protected Marine Area
(MPA/HPMA) objectives offshore, may allow full integration of carbon sequestration
alongside assessments and observations of other habitat functions and services.
4. Status, irrecoverability and management: Improved understanding of the effects of
management, including protection and restoration, and pressures on the carbon
storage of all the habitats is urgently needed as this will allow insights into the gains
possible through habitat restoration, management or protection and the timescales
upon which they can be delivered. Key questions are: what mechanisms produce and
maintain carbon stocks and accumulation; are existing degraded stocks recoverable
or irrecoverable once pressures are removed and over what timescales?
Assessing the impacts of management on habitat condition (grazing, impact levels)
and timescales of recovery/change was outside the scope of this review. However,
applying the existing baseline stock and accumulation levels provided in this review to
future management or climate pressure considerations would be of merit in future. In
particular, improved understanding of the impacts of trawling (Parker et al., 2012) and
other activities, could give useful insights to stock or accumulation degradation,
timescales of change (including irrecoverability) and help inform management actions
(including HPMAs or other Nature-based Solutions) to preserve, protect or restore the
considerable carbon stocks offshore.
5. Predicting future habitat carbon stocks and accumulation: Linking all the
recommendations (1-4) above is the need to test and develop tools (models) which
can be used to investigate habitat specific carbon cycles (including carbon stocks and
accumulation), their sensitivity to various impacts or associated policy and
management decisions (including climate forcing itself) and timescales of response.
6. Formation of a UK blue carbon technical group: To build on the baseline information
(across SoS and UK EEZ) collated in this project, to collate any unpublished data and
support the Defra and other policy makers with state-of-the-art information and
identified evidence gaps. This group could also facilitate legacy for a ‘live’ stocks and
16accumulation rates portal across the UK EEZ. This could be based on the reviewers
group here with links to key Defra Arm’s Length Bodies (ALBs) and Devolved
Administrations (DAs). This group could draw together and update the evidence base
required to support policy objectives relating to Blue Carbon.
References:
Adams, C.A., Andrews, J.E. and Jickells, T. (2012) Nitrous oxide and methane fluxes vs.
carbon, nitrogen and phosphorous burial in new intertidal and saltmarsh sediments. Sci
Total Environ 434:240–251.
Atwood, T. B., Witt, A., Mayorga, J., Hammill, E. and Sala, E. (2020). Global Patterns in
Marine Sediment Carbon Stocks. Frontiers in Marine Science, 7: 165, 1–9. Doi
10.3389/fmars.2020.00165.
Beaumont, N.J., Jones, L., Garbutt, A., Hansom, J.D. and Toberman, M. (2014) The value of
carbon sequestration and storage in coastal habitats. Estuar Coast Shelf Sci 137:32–40.
Burden, A., Garbutt, A. and Evans, C.D. (2019) Effect of restoration on saltmarsh carbon
accumulation in Eastern England. Biol Lett 15:0–3.
Burrows, M.T., Hughes, D.J., Austin, W.E.N., Smeaton, C., Hicks, N., Howe, J.A., Allen, C.,
Taylor, P. and Vare, L.L. (2017) Assessment of Blue Carbon Resources in Scotland’s
Inshore Marine Protected Area Network. Scottish Nat Herit Comm Rep:1–283.
Burrows, M.T., Kamenos, N.A., Hughes, D.J., Stahl, H., Howe, J.A. and Tett, P. (2014)
Assessment of carbon budgets and potential blue carbon stores in Scotland’s coastal
and marine environment. Project Report. Scottish Natural Heritage Commissioned
Report No. 761. 90 pp.
Callaway, J.C., DeLaune, R.D. andPatrick, W.H. (1996) Chernobyl 137Cs used to determine
sediment accretion rates at selected northern European coastal wetlands. Limnol
Oceanogr 41:444–450.
Cannell, M.G.R., Milne, R., Hargreaves, K.J., Brown, T.A.W, Cruickshank, M.M., Bradley, R.I.,
Spencer, T., Hope, D., Billett, M.F., Adger, W.N. and Subak, S. (1999) National
inventories of terrestrial carbon sources and sinks: The U.K. Experience. Clim Change
42:505–530.
Chmura, G.L., Anisfeld, S.C., Cahoon, D.R. and Lynch, J.C. (2003) Global carbon sequestration
in tidal, saline wetland soils. Global Biogeochem Cycles 17.
De Haas, H., Boer. W. and Van Weering, T.C.E. (1997) Recent sedimentation and organic
carbon burial in a shelf sea: The North Sea. Mar Geol 144:131–146.
Diesing, M., Kröger, S., Parker, R., Jenkins, C., Mason, C. and Weston, K. (2017). Predicting
the standing stock of organic carbon in surface sediments of the North–West European
continental shelf. Biogeochemistry, 135: 183-200. Doi: 10.1007/s10533-017-0310-4.
Flavell, B., Carr, H., Robson, L., Byford, S., Chaniotis, P., Last, E., Long, M., Matear, L. and
Novak, E. (2020). Developing the evidence-base to support climate-smart decision
making on MPAs. JNCC Report No. 648. JNCC, Peterborough, ISSN 0963-8091.
17Ford, H., Garbutt, A., Duggan-Edwards, M., Pagès, J.F., Harvey, R., Ladd, C. and Skov, M.W.
(2019) Large-scale predictions of salt-marsh carbon stock based on simple observations
of plant community and soil type. Biogeosciences 16:425–436.
Goldstein, A., Turner, W.R., Spawn, S.A., Anderson-Teixeira, K.J., Cook-Patton, S., Fargione,
J., Gibbs, H.K., Griscom, B., Hewson, J.H., Howard, J.F., Ledezma, J.C., Page, S., Pin Koh, L.,
Rockström, J., Sanderman, J. and Hole, D.G. (2020).. Protecting irrecoverable carbon in
Earth’s ecosystems. Nature Climate Change 10: 287–295. Doi: 10.1038/s41558-020-0738-
8.
Green, A., Chadwick, M.A. and Jones, P.J.S. (2018) Variability of UK seagrass sediment
carbon: Implications for blue carbon estimates and marine conservation management.
PLoS One 13:1–18.
IPCC, 2014. 2013 Supplement to the 2006 IPPC Guidelines for National Greenhouse Gas
Inventories: Wetlands. Hiraishi, T., Krung, T., Tanabe, K, Srivastava, N., Jamsranjav, B.
Fukuda, M., Troxler, T. (Eds.) Published IPCC, Switzerland.
Kelleway, J.J., Saintilan, N., Macreadie, P.I. and Ralph P.J. (2016) Sedimentary Factors are
Key Predictors of Carbon Storage in SE Australian Saltmarshes. Ecosystems 19: 865–880.
DOI: 10.1007/s10021-016-9972-3
Kennedy, H. andBjörk, M. (2009) Seagrass Meadows. In: Laffoley, D.d’A. & Grimsditch, G.
(eds). 2009. The management of natural coastal carbon sinks. IUCN, Gland, Switzerland.
53 pp.
Kröger, S., Parker, R., Cripps, G. and Williamson, P. (Eds.) 2018. Shelf Seas: The Engine of
Productivity, Policy Report on NERC-Defra Shelf Sea Biogeochemistry programme. Cefas,
Lowestoft. DOI: 10.14465/2018.ssb18.pbd
Kröger, S., Bolam, S. and Parker, P. (2019) Progress towards the development of operational
indicators of seabed integrity. Summary report for Defra-Cefas project ME5316/C6264
Legge, O., Johnson, M., Hicks, N., Jickells, T., Diesing, M., Aldridge, J., Andrews, J., Artioli, Y.,
Bakker, DCE., Burrows, MT., Carr, N., Cripps, G., Felgate, SL., Fernand, L., Greenwood, N.,
Hartman, S., Kröger, S., Lessin, G., Mahaffey, C., Mayor, DJ., Parker, R., Queirós, AM.,
Shutler, JD., Silva, T., Stahl, H., Tinker, J., Underwood, GJC., Van Der Molen, J., Wakelin, S.,
Weston, K. and Williamson, P., (2020). Carbon on the Northwest European Shelf:
Contemporary Budget and Future Influences. Frontiers in Marine Science 7: 143. Doi:
10.3389/fmars.2020.00143.
MCCIP (2011) http://www.mccip.org.uk/impacts-report-cards/full-report-cards/2010-
2011/confidence-assessments/
McLeod, E., Chmura, G.L., Bouillon, S., Salm, R., Björk, M., Duarte, C.M., Lovelock, C.E.,
Schlesinger, W.H. and Silliman, B.R. (2011) A blueprint for blue carbon: toward an
improved understanding of the role of vegetated coastal habitats in sequestering CO 2.
Frontiers in Ecology and the Environment 9(10):552-560. doi: 1 0.1890/110004.
Novak, A. B., Pelletier, M. C., Colarusso, P., Simpson, J., Gutierrez, M. N. , Arias-Ortiz, A.,
Charpentier, M., Masque, P. and Vella, P. (2020). Factors influencing carbon stocks and
accumulation rates in eelgrass meadows across New England, USA. Estuaries and Coasts,
1-16. doi: 10.1007/s12237-020-00754-9.
18Parker, R., Barry, J., Bolam, S., Eggleton, J., Powell, C., Weston, K. and Coggan, R. (2012)
Alternative metrics for assessing ‘sea-floor integrity’ under the Marine Strategy
Framework Directive. Contract report E5301.
Parker, R., Weston, K., Barry, J. and C. Powell (2012). Recommended biogeochemical targets
and indicators for MSFD monitoring and management of the UK seabed. Contract report
ME5301.
Pessarrodona, A., Moore, P.J., Sayer, M.D.J. and Smale, D.A. (2018) Carbon assimilation and
transfer through kelp forests in the NE Atlantic is diminished under a warmer ocean
climate. Glob Chang Biol 24:4386–4398.
Queirós, A.M., Stephens, N., Widdicombe, S., Tait, K., McCoy, S.J., Ingels, J., Rühl, S., Airs, R.,
Beesley. A., Carnovale, G., Cazenave, P., Dashfield, S., Hua, E., Jones, M., Lindeque, P.,
McNeill, C.L., Nunes, J., Parry, H., Pascoe, C., Widdicombe, C., Smyth, T., Atkinson, A.,
Krause-Jensen, D. and Somerfield, P.J. (2019) Connected macroalgal-sediment systems:
blue carbon and food webs in the deep coastal ocean. Ecol Monogr 89:1–21.
Röhr, M.E., Holmer, M., Baum, J.K., Björk, M., Chin, D., Chalifour, L., Cimon, S., Cusson, M.,
Dahl, M., Deyanova, D., Duffy, J.E., Eklöf, J.S., Geyer, J.K., Griffin, J.N., Gullström, M.,
Hereu, C.M., Hori, M., Hovel, K.A., Hughes, A.R., Jorgensen, P., Kiriakopolos, S.,
Moksnes, P.O., Nakaoka, M., O’Connor, M.I., Peterson, B., Reiss, K., Reynolds, P.L.,
Rossi, F., Ruesink, J., Santos, R., Stachowicz, J.J., Tomas, F., Lee, K.S., Unsworth, R.K.F.
and Boström, C. (2018) Blue Carbon Storage Capacity of Temperate Eelgrass (Zostera
marina) Meadows. Global Biogeochem Cycles 32:1457–1475.
Silburn, B., Parker, R., Mason, C. and Parker, R. (2018). Rapid fines assessment: A
quantitative volumetric method to assess fines content in marine soft sediments.
Limnology and Oceanography: Methods 16: 376-389. Doi: 10.1002/lom3.10252.
Smale, D.A., Burrows, M.T., Evans, A.J., King, N., Sayer, M.D.J, Yunnie, A.L.E.and Moore, P.J.
(2016) Linking environmental variables with regional scale variability in ecological
structure and standing stock of carbon within UK kelp forests. Mar Ecol Prog Ser
542:79–95.
Thornton, D.C.O., Dong,L.F., Underwood, G.J.C. and Nedwell, D.B. (2002) Factors affecting
microphytobenthic biomass, species composition and production in the Colne Estuary
(UK). Aquat Microb Ecol 27:285–300.
Trimmer, M., Nedwell, D.B., Sivyer, D.B. and Malcolm, S.J. (1998) Nitrogen fluxes through
the lower estuary of the river Great Ouse, England: The role of the bottom sediments.
Mar Ecol Prog Ser 163:109–124.
Turrell, W.R (2020). A Compendium of Marine Related Carbon Stores, Sequestrations and
Emissions. Scottish Marine and Freshwater Science Vol 11 No 1, 70pp. Doi:
10.7489/12261-1.
Watson, S.C.L., Preston, J., Beaumont, N.J. and Watson, G.J. (2020) Assessing the natural
capital value of water quality and climate regulation in temperate marine systems
using a EUNIS biotope classification approach. Sci Total Environ 744:140688.
19Wilson, R. J., Speirs, D. C., Sabatino, A. and Heath, M. R. (2018). A synthetic map of the
north-west European Shelf sedimentary environment for applications in marine science.
Earth System Science Data, 10(1): 109–130. Doi: 10.5194/essd-10-109-2018.
20Annex 1: Summaries of reviews of the existing evidence base, uncertainties, and gaps for
each of the main blue carbon habitats within UK EEZ / SoS waters.
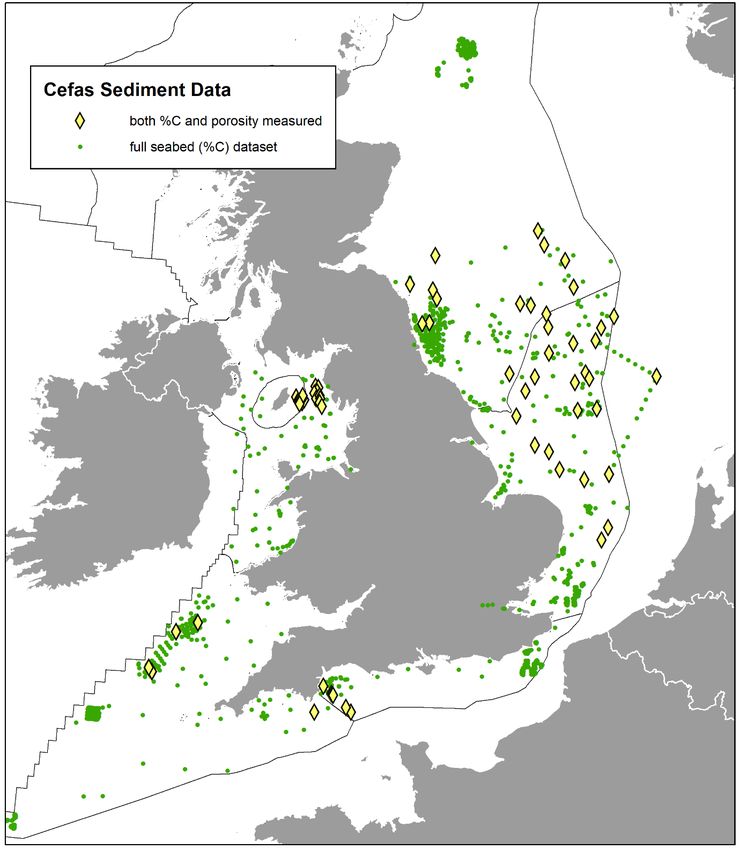
An overview of the evidence base for SoS/UK EEZ waters (as of October 2020) is illustrated in the map
below.
Figure A1: Locations of measurements of blue carbon habitat carbon stocks (large map), kelp biomass (small
inset map) and carbon accumulation rates (upper right-hand inset). Sea areas delineated by the light grey lines
are Devolved Administration Boundaries from the ADMIRALTY Marine Data Portal (UK Hydrographic Office).
Discrepancies were found in the original data and while those were addressed, these amendments were not
agreed upon by the DAs. English and Northern Irish Offshore waters (together making up the SoS) are shaded
in light blue, Welsh waters dark blue. Data for both areas have been used to determine the average
stock/accumulation levels but SoS water habitat extents only for scaling.
21Methodology:
A total of 116 sources of data (reports, peer-reviewed publications, datasets, etc.) were reviewed
during this exercise and, where available, the following key information was extracted:
- Habitat type
- Habitat condition (e.g. degraded/pristine and/or natural/restored)
- Sediment type (e.g. mud/sand)
- Location information/geographic coordinates of specific sites sampled
- Sediment organic carbon (%), or organic matter (%)
- Sediment dry bulk density (DBD)
- Carbon stock
- Sediment depth to which carbon stock data were measured and reported
- Carbon accumulation rate
Additional information also recorded where available, e.g. organic matter content, vegetation biomass
and sediment accumulation rates in case of future usefulness.
Where papers conducted a review or used carbon stock or accumulation rate values from other
sources (not original measurements) the original data source was reviewed and cited directly in the
data summary. This avoided potential “double counting” of observations which had been re-reported
in multiple studies. Of all data sources reviewed 12 contained original measurements of carbon stock
and/or carbon accumulation rates within the SoS region. There were three more sources that reported
original measurements for stocks and/or accumulation rates within the UK as a whole.
Where carbon stocks were not reported, but sediment carbon content was presented as either organic
matter (%OM) or organic carbon (%OC) content, carbon stock was calculated as follows. Where
organic matter content (often as “loss on ignition”) was reported and organic carbon measurements
were not available, the equation of Howard et al. (2017) was used to convert organic matter (OM) to
organic carbon (OC) (Equation 1). Carbon stock was calculated from dry bulk density (DBD) and organic
carbon content using Equation 2.
OC(%) = 0.40 * OM(%) + 0.0025 * [OM(%)]2 (Equation 1)
Carbon Stock (g C cm-3 ) = OC(%)/100 * DBD(g cm-3 ) (Equation 2)
Where possible, data for individual samples was extracted from the evidence base. However, many
data sources presented measurements as means (with variance) of replicates or averaged over several
sites. These were recorded along with the sample size information. Where sample size (e.g. number
of replicates) was not reported, the corresponding mean values could not be included in the data
summaries due to the inability to calculate the resulting variances. Including these data would have
made it impossible to estimate uncertainty in the SoS averages presented, or more importantly,
represent the observed variability of carbon stocks and accumulation rates across the SoS.
For subtidal and intertidal sediment carbon stocks, all data sources reported singular original
observations (not averages) therefore, mean and standard errors for SoS and UK EEZ were calculated
directly.
22Conversely, all saltmarsh and seagrass observations were presented in data sources as mean values.
The following procedure was followed in order to summarise these data while preserving a
quantification of variability (uncertainty):
1. Each reported measure of variation, from the original data source, was converted into a
standard error for its accompanying carbon flux or accumulation rate value.
2. A “mean of means” (MOM) was calculated for each habitat. Note that it was deemed not
appropriate to weight the values (e.g. by their standard error) for the calculation of the mean,
since the standard error reflects the natural variability within the measured samples. The
assumption was made that surveys within a habitat were representative and approximately
unbiased.
3. Assuming independence between surveys (data sources), the variance (var) of the MOM
was calculated as sum of the variances of each survey’s mean value (m i), all divided by N2,
where N is the total number of surveys for that habitat:
var(MOM) = [var(m1 ) + var(m2 ) + … + var(mN)] / N2
The variance of each survey’s mean value is the square of the standard error associated with
that mean.
4. The standard error of the MOM was calculated as the square root of var(MOM).
23Seagrasses- Carolyn Graves
Reviewed by H. Kennedy, Bangor University
Stocks:
To date, there are only two published records of UK seagrass sediment carbon stocks. These report
on 13 sites from the western Channel (subtidal; Green et al., 2018), and one site from north–west
Wales (inter/subtidal not reported; Röhr et al., 2018). A PhD thesis (Potouroglou, 2017) reports carbon
stocks for seven intertidal sites along the west coast of Scotland. Based on these limited
measurements, the SoS seagrass carbon stock, to 1 m sediment depth, is: 13.7 ± 0.2, and the UK stock
is: 13.0 ± 0.1 kg C m-2 .
From the few UK sites which have been surveyed, seagrass carbon stocks are highly variable. In the
western Channel, most 13 of 14 sites reported had between 9.6 and 15.0 kg C m-2 , while one had 38.0
± 7.2 kg C m-2 (Green et al., 2018). This clearly demonstrates the risk (inappropriateness) of
extrapolating the average of a heterogenous property across the habitat extent for the whole SoS or
UK EEZ. More measurements are needed to determine the spatial variability of stocks and improve
the validity of a UK or SoS-wide stock estimate.
Published measurements of seagrass-associated carbon stocks, reported in global scaled reviews,
were initially biased towards the species Posidonia oceanica in the Mediterranean Sea. However, now
clear differences between species have been established (e.g. Lavery et al., 2013). It is widely accepted
that Posidonia oceanica store more carbon than other species, however between other seagrasses
species site specific factors (sediment type, proximity sources of allochthonous carbon) are expected
to be a more significant driver of carbon storage variability (Kennedy et al., 2010).
All seagrass in the UK (also called eelgrass) is Zostera spp. (Wilding et al., 2009). Applying average
carbon stocks from global reviews based on other species to UK seagrass (e.g. Burrows et al., 2014) is
therefore not appropriate. All SoS measurements to date are for Z. marina, while in Scotland both Z.
marina and Z. noltii meadows were sampled and the latter found to have higher carbon stocks
(Potouroglou, 2017).
On average the available UK data are at the upper end of the reported range of European Zostera
marina stocks (0.15 ± 0.9 to 4.3 ± 1.2 kg C m-2 ; Green et al., 2018). For comparison, Posidonia oceania
stocks have been reported as up to 40 - 410 kg C m-2 (e.g. Lavery et al., 2013), while Z. marina stocks
are 2.3-35.2 kg C m-2 (Röhr et al., 2018).
Accumulation rates:
For English, Northern Irish, and Welsh waters there are no reported observations of seagrass carbon
sequestration. For Scotland, a carbon sequestration capacity of 1321 t C/yr has been reported
(Burrows et al., 2014; 2017; Turrell, 2020). This flux is based on the roughly estimated Scottish habitat
area of Burrows et al. (2014), combined with a seagrass carbon sequestration value of 83 g C m -2 yr-1
which is the average of a limited number of observations (range: 10-350 g C m-2 yr-1 ; n=5,
geographically limited to the Mediterranean) reported in the global review of Duarte et al. (2005a).
McLeod et al (2011) presented an updated higher global estimate of 138 ± 38 g C m-2 yr-1 (range 45-
190, n=123 sites). This is much smaller than the more recent global, all species, accumulation rate of
Forqurean et al. 2012 (251 ± 49 g C m-2 yr-1 ), However a recently reported Z. marina specific value of
85 ± 19 g C m-2 yr-1 based on seven sites in the north-western Atlantic (Novak et al. 2020), is close to
the mediterranean estimate used in the Scottish reports, and is currently the most appropriate
estimate for UK waters in the absence of observations or more comprehensive relevant reviews.
Summary:
The evidence base for seagrasses is limited, and more measurements are required for both UK
seagrass carbon stocks and fluxes (for which there are currently no measurements) across the SoS and
UK EEZ.
24Seagrass references:
SoS data:
Green, A., Chadwick, M. A., and Jones, P. J. S. (2018). Variability of UK seagrass sediment carbon:
Implications for blue carbon estimates and marine conservation management. PLoS ONE, 13(9), 1–
18. doi: 10.1371/journal.pone.0204431.
Potouroglou, M. (2017). Assessing the Role of Intertidal Seagrasses as Coastal Carbon Sinks in
Scotland. PhD Thesis. School of Applied Sciences, Edinburgh Napier University.
Röhr, M. E., Holmer, M., Baum, J. K., Björk, M., Boyer, K., Chin, D., et al. (2018). Blue carbon storage
capacity of temperate eelgrass (Zostera marina) meadows. Global Biogeochemical Cycles, 32,
1457–1475. doi: 10.1029/2018GB005941.
Other references cited:
Burrows, M. T., Hughes, D. J., Austin, W. E. N., Smeaton, C., Hicks, N., Howe, J. A., Allen, C., Taylor, P.
and Vare, L. L. (2017). Assessment of Blue Carbon Resources in Scotland’s Inshore Marine Protected
Area Network. Scottish Natural Heritage Commissioned Report, 9, 1–283.
Burrows, M. T., Kamenos, N. A., Hughes, D. J., Stahl, H., Howe, J. A. and Tett, P. (2014). Assessment of
carbon budgets and potential blue carbon stores in Scotland’s coastal and marine environment.
Project Report. Scottish Natural Heritage Commissioned Report No. 761. 7, 90 pp.
Duarte, C. M., Middelburg, J. J. and Caraco, N. (2005). Major role of marine vegetation on the oceanic
carbon cycle. Biogeosciences, 1, 1–8. doi: 10.5194/bg-2-1-2005
Fourqurean, J. W., Duarte, C. M., Kennedy, H., Marbà, N., Holmer, M., Mateo, M. A., Apostolaki, E.T.,
Kendrick, G.A., Krause-Jensen, D., McGlathery, K.J. and Serrano, O. (2012). Seagrass ecosystems as
a globally significant carbon stock. Nature Geoscience, 5(7), 505-509. doi: 10.1038/ngeo1477
Kennedy, H., Beggins, J., Duarte, C.M., Fourqurean, J.W., Holmer, M., Marbà, N. and Middelburg, J.J.
(2010). Seagrass sediments as a global carbon sink: Isotopic constraints. Global Geochemical Cycles,
24: GB4026. Doi: 10.1029/2010GB003848.
Lavery, P. S., Mateo, M. Á., Serrano, O. and Rozaimi, M. (2013). Variability in the Carbon Storage of
Seagrass Habitats and Its Implications for Global Estimates of Blue Carbon Ecosystem Service. PLoS
ONE, 8(9). doi: 10.1371/journal.pone.0073748
Novak, A. B., Pelletier, M. C., Colarusso, P., Simpson, J., Gutierrez, M. N., Arias-Ortiz, A., Charpentier,
M., Masque, P. and Vella, P. (2020). Factors influencing carbon stocks and accumulation rates in
eelgrass meadows across New England, USA. Estuaries and Coasts, 1-16. doi: 10.1007/s12237-020-
00754-9.
Turrell, W. R. (2020). A Compendium of Marine Related Carbon Stores, Sequestrations and Emissions.
Scottish Marine and Freshwater Science 11(1) Marine Scotland Science. doi: 10.7489/12261-1
25You can also read