BIS - BIS Quarterly Review International banking and financial market developments June 2019 - International banking and financial ...

Page created by Mark Burton
 
CONTINUE READING
BIS - BIS Quarterly Review International banking and financial market developments June 2019 - International banking and financial ...
BIS

BIS Quarterly Review
International banking and financial
market developments
June 2019
BIS Quarterly Review
 Monetary and Economic Department

 Editorial Committee:

 Claudio Borio       Stijn Claessens        Benoît Mojon          Hyun Song Shin          Philip Wooldridge

 General queries concerning this commentary should be addressed to Philip Wooldridge
 (tel +41 61 280 8006, e-mail: philip.wooldridge@bis.org), queries concerning specific parts to the authors,
 whose details appear at the head of each section, and queries concerning the statistics to
 Patrick McGuire (tel +41 61 280 8921, e-mail: patrick.mcguire@bis.org).

 This publication is available on the BIS website (www.bis.org/publ/qtrpdf/r_qt1906.htm).

©   Bank for International Settlements 2019. All rights reserved. Brief excerpts may be
    reproduced or translated provided the source is stated.

ISSN 1683-0121 (print)
ISSN 1683-013X (online)
BIS Quarterly Review

June 2019

The June issue focuses on BIS statistics. Analyses of financial market
developments will be included in the BIS Annual Economic Report to be published
on 30 June 2019.

International banking and financial market developments

Concentration in cross-border banking ................................................................................... 1
Iñaki Aldasoro and Torsten Ehlers
       Key takeaways ........................................................................................................................... 2
       Distribution of cross-border banking relationships ................................................... 2
       Box A: Analysing bilateral country links using the
          BIS international banking statistics ............................................................................ 4
       Concentration and the fall in cross-border interbank credit .................................. 5
       Conclusions ................................................................................................................................ 8
       Box B: The importance of small cross-border banking
          links for emerging market economies ...................................................................... 9

BIS statistics: Charts ............................................................................................................... A1

Special features in the BIS Quarterly Review ..................................................... B1
List of recent BIS publications ....................................................................................... C1

Notations used in this Review

billion            thousand million
e                  estimated
lhs, rhs           left-hand scale, right-hand scale
$                  US dollar unless specified otherwise
…                  not available
.                  not applicable
–                  nil or negligible

Differences in totals are due to rounding.

The term “country” as used in this publication also covers territorial entities that
are not states as understood by international law and practice but for which data
are separately and independently maintained.

BIS Quarterly Review, June 2019                                                                                                                         iii
Abbreviations

Currencies
     ARS         Argentine peso            MAD                           Moroccan dirham
     AUD         Australian dollar         MXN                           Mexican peso
     BGN         Bulgarian lev             MYR                           Malaysian ringgit
     BHD         Bahraini dinar            NOK                           Norwegian krone
     BRL         Brazilian real            NZD                           New Zealand dollar
     CAD         Canadian dollar           OTH                           all other currencies
     CHF         Swiss franc               PEN                           Peruvian sol
     CLP         Chilean peso              PHP                           Philippine peso
     CNY (RMB)   Chinese yuan (renminbi)   PLN                           Polish zloty
     COP         Colombian peso            RON                           Romanian leu
     CZK         Czech koruna              RUB                           Russian rouble
     DKK         Danish krone              SAR                           Saudi riyal
     EUR         euro                      SEK                           Swedish krona
     GBP         pound sterling            SGD                           Singapore dollar
     HKD         Hong Kong dollar          THB                           Thai baht
     HUF         Hungarian forint          TRY                           Turkish lira
     IDR         Indonesian rupiah         TWD                           New Taiwan dollar
     ILS         Israeli new shekel        USD                           US dollar
     INR         Indian rupee              VES                           bolívar soberano
     JPY         Japanese yen              ZAR                           South African rand
     KRW         Korean won

iv                                               BIS Quarterly Review, June 2019
Countries
  AE        United Arab Emirates               CY   Cyprus
  AF        Afghanistan                        CZ   Czech Republic
  AL        Albania                            DE   Germany
  AM        Armenia                            DJ   Djibouti
  AO        Angola                             DK   Denmark
  AR        Argentina                          DM   Dominica
  AT        Austria                            DO   Dominican Republic
  AU        Australia                          DZ   Algeria
  AZ        Azerbaijan                         EA   euro area
  BA        Bosnia and Herzegovina             EC   Ecuador
  BD        Bangladesh                         EE   Estonia
  BE        Belgium                            EG   Egypt
  BF        Burkina Faso                       ER   Eritrea
  BG        Bulgaria                           ES   Spain
  BH        Bahrain                            ET   Ethiopia
  BI        Burundi                            FI   Finland
  BJ        Benin                              FJ   Fiji
  BM        Bermuda                            FO   Faeroe Islands
  BN        Brunei                             FR   France
  BO        Bolivia                            GA   Gabon
  BR        Brazil                             GB   United Kingdom
  BS        The Bahamas                        GD   Grenada
  BT        Bhutan                             GE   Georgia
  BY        Belarus                            GH   Ghana
  BZ        Belize                             GN   Guinea
  CA        Canada                             GQ   Equatorial Guinea
  CD        Democratic Republic of the Congo   GR   Greece
  CF        Central African Republic           GT   Guatemala
  CG        Republic of Congo                  GW   Guinea-Bissau
  CH        Switzerland                        GY   Guyana
  CI        Côte d’Ivoire                      HN   Honduras
  CL        Chile                              HK   Hong Kong SAR
  CM        Cameroon                           HR   Croatia
  CN        China                              HT   Haiti
  CO        Colombia                           HU   Hungary
  CR        Costa Rica                         ID   Indonesia
  CV        Cape Verde                         IE   Ireland

             BIS Quarterly Review, June 2019                             v
Countries (cont)
     IL            Israel            MW                           Malawi
     IN            India             MX                           Mexico
     IQ            Iraq              MY                           Malaysia
     IR            Iran              MZ                           Mozambique
     IS            Iceland           NG                           Nigeria
     IT            Italy             NL                           Netherlands
     JE            Jersey            NO                           Norway
     JM            Jamaica           NR                           Nauru
     JO            Jordan            NZ                           New Zealand
     JP            Japan             OM                           Oman
     KE            Kenya             PA                           Panama
     KG            Kyrgyz Republic   PE                           Peru
     KH            Cambodia          PG                           Papua New Guinea
     KR            Korea             PH                           Philippines
     KW            Kuwait            PK                           Pakistan
     KY            Cayman Islands    PL                           Poland
     KZ            Kazakhstan        PT                           Portugal
     LA            Laos              PY                           Paraguay
     LB            Lebanon           QA                           Qatar
     LC            St Lucia          RO                           Romania
     LK            Sri Lanka         RS                           Serbia
     LR            Liberia           RU                           Russia
     LS            Lesotho           RW                           Rwanda
     LT            Lithuania         SA                           Saudi Arabia
     LU            Luxembourg        SC                           Seychelles
     LV            Latvia            SD                           Sudan
     LY            Libya             SE                           Sweden
     MA            Morocco           SG                           Singapore
     MD            Moldova           SK                           Slovakia
     ME            Montenegro        SI                           Slovenia
     MK            Macedonia FYR     SR                           Suriname
     MM            Myanmar           SS                           South Sudan
     MN            Mongolia          ST                           São Tomé and Príncipe
     MO            Macao SAR         SV                           El Salvador
     MR            Mauritania        SZ                           Eswatini
     MT            Malta             TD                           Chad
     MU            Mauritius         TG                           Togo
     MV            Maldives          TH                           Thailand

vi                                        BIS Quarterly Review, June 2019
Countries (cont)
  TJ                  Tajikistan                     UZ    Uzbekistan
  TL                  East Timor                     VC    St Vincent and the Grenadines
  TM                  Turkmenistan                   VE    Venezuela
  TO                  Tonga                          VG    British Virgin Islands
  TR                  Turkey                         VN    Vietnam
  TT                  Trinidad and Tobago            XM    euro area
  TW                  Chinese Taipei                 ZA    South Africa
  UA                  Ukraine                        ZM    Zambia
  US                  United States                  AE    advanced economy
  UY                  Uruguay                        EME   emerging market economy

                   BIS Quarterly Review, June 2019                                         vii
Iñaki Aldasoro                       Torsten Ehlers
                                                 inaki.aldasoro@bis.org                torsten.ehlers@bis.org

Concentration in cross-border banking1

Cross-border bank credit is dominated by a small number of very sizeable links between banks
in one country and borrowers in another. The largest-sized cross-border banking links are mainly
between major advanced economies. Concentration increased up until the Great Financial Crisis
(GFC) and has abated only slightly since. It is higher for interbank credit than for credit to the
non-bank sector. Despite the substantial decline in interbank credit in the aftermath of the GFC,
concentration in the interbank segment has remained high.
JEL classification: G15, F30, G21.

A structural feature of cross-border banking is its high degree of concentration, with
a small number of very large bilateral links accounting for the lion’s share of total
global cross-border bank credit. The largest links are almost exclusively between
advanced economies, while links involving emerging market economies (EMEs) tend
to be of smaller size. Concentration in cross-border bank links increased up to the
Great Financial Crisis (GFC) and remained high. Overall, it is higher for cross-border
interbank credit compared with bank credit to the non-bank sector. While the share
of cross-border interbank credit has fallen significantly since the GFC, concentration
has remained high for interbank links.
     The concentration of cross-border bank linkages is highly relevant for financial
spillovers, as the GFC revealed (Ehlers and McGuire (2017), Avdjiev and Takáts (2014),
Herrmann and Mihaljek (2013), Borio et al (2011)). In this article, we take a closer look
at the size distribution as well as the sectoral composition of cross-border banking
links at the country level. Cross-border interbank credit was particularly affected
during the GFC (Claessens (2017)), including the model whereby local banks tap
cross-border funding from global banks (Bruno and Shin (2014)). Using the BIS
locational banking statistics (LBS), we document the pattern of bilateral (country-
level) cross-border bank credit (assets) of banks located in one country vis-à-vis bank
and non-bank borrowers in another.2

1
      The authors would like to thank Stefan Avdjiev, Claudio Borio, Stijn Claessens, Bryan Hardy, Swapan-
      Kumar Pradhan, Patrick McGuire, Benoît Mojon, Hyun Song Shin, Nikola Tarashev and Philip
      Wooldridge for valuable comments and suggestions, as well as Deimantė Kupčiūnienė for excellent
      research assistance. The views expressed in this article are those of the authors and do not necessarily
      reflect those of the BIS.
2
      Creditor banks in a given country are in most cases also cross-border borrowers. This article, however,
      focuses only on one direction of cross-border bank linkages. While this greatly simplifies the analysis,
      it misses some relevant liabilities such as cross-border deposits. Nonetheless, it covers cross-border
      interbank linkages, which proved to be particularly important during the GFC.

BIS Quarterly Review, June 2019                                                                             1
Key takeaways

           A small number of very large cross-border links dominate global cross-border bank credit. Only 2.4% of all
            bilateral links between banks in one country and borrowers in another were greater than $50 billion in size
            at end-2018, but they constituted a full two thirds of global cross-border bank credit volumes.

           Concentration in cross-border bank credit is mainly due to links involving advanced economies. Just five
            major creditor countries – France, Germany, Japan, the United Kingdom and the United States – account for
            55% of global cross-border credit and close to 70% of the volume of the largest bilateral country-level links.

           Concentration is a structural feature of cross-border bank credit. Even amid a significant drop in cross-border
            interbank credit after the Great Financial Crisis (GFC), concentration in interbank links remained high.
            Concentration in cross-border credit to non-banks has increased since the GFC.

           Small cross-border links account for an insignificant share of global bank credit but can be economically
            important for emerging market economies (Box B).

     The first section of this article documents the size distribution of cross-border
banking links. It then shows that concentration is mainly due to links within advanced
economies. The second section looks at the sectoral composition, focusing on the
persistently higher concentration in cross-border interbank links relative to links vis-
à-vis the non-bank sector.

Distribution of cross-border banking relationships

At end-2018, the outstanding stock of cross-border bank claims stood at
$28.5 trillion.3 This stock consisted of the sum of 4,822 bilateral relationships
between creditor banks in one country and borrowers in another (see Box A for a
more detailed data description and a comparison with consolidated data). The
concentration in cross-border links can be characterised along two complementary
dimensions: the number of country-level links between banks and borrowers; and the
size or volume of each link.4
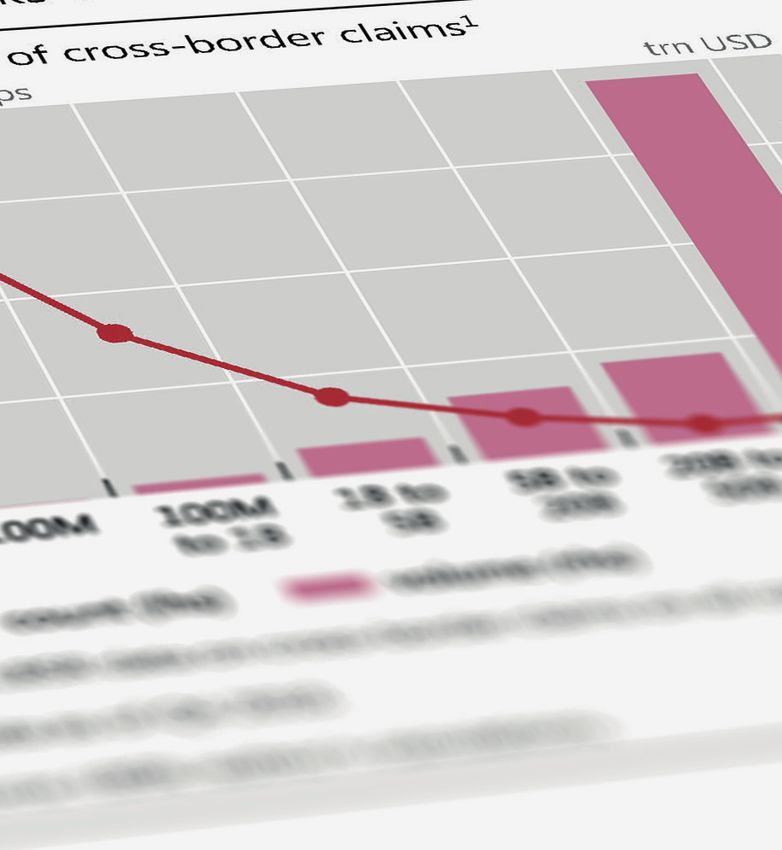
     A small number of links are exceptionally large in size and are behind the lion’s
share of overall volumes (Graph 1, left-hand panel, bars). Two thirds of the
$28.5 trillion in total lending as of end-2018 were accounted for by 117 bilateral
relationships larger than $50 billion in size.
     The flip side of the small number of very sizeable links is the high number of
small-sized links (left-hand panel, line). As of end-2018, around 50% of all existing
bilateral links at the country level were smaller than $100 million in volume. While

3
     As our interest lies in country-to-country relationships, throughout our analysis we exclude cross-
     border claims unallocated by counterparty country and vis-à-vis international organisations.
4
     The precision of reporting in the LBS has improved with time. Up to Q2 2012, values were reported
     to the BIS in integers of millions of US dollars. Since then, values have been reported down to
     thousands of US dollars by most reporters. This can artificially influence the number of bilateral links.
     For this reason, in this article we set a threshold of $0.5 million for bilateral links to be considered, ie
     bilateral links smaller than that amount are set to zero.

2                                                                               BIS Quarterly Review, June 2019
Many bilateral links of small size, a few very large1
At end-2018                                                                                                                          Graph 1

Count and volumes of cross-border claims2                                  Lorenz curve for bilateral cross-border bank credit
Number of links                                                 USD trn                                                      Cumulative share
3,000                                                                20                                                                      1.0

2,400                                                                16                                                                      0.8

1,800                                                                12                                                                      0.6

1,200                                                                  8                                                                     0.4

600                                                                    4                                                                     0.2

0                                                                      0                                                                     0.0
          50                      0.2         0.4         0.6         0.8          1.0
           mn       –1bn         bn        bn       bn       bn

             Count (lhs)                    Volume (rhs)                           Cumulative share           45o line (perfect equality)
1
  Using LBS data on bilateral cross-border claims on all counterparty sectors, all currencies. Claims below $0.5 million are excluded from
calculations. 2 By size bucket of bilateral cross-border claims.

Sources: BIS locational banking statistics (LBS); authors’ calculations.

                             large in number, these small links make a negligible contribution to overall cross-
                             border credit volumes (0.2% of total cross-border credit volume at end-2018).
                                  The high degree of concentration in the distribution of cross-border bank links
                             can also be visualised by the Lorenz curve (Graph 1, right-hand panel).5 This curve
                             plots the cumulative share of the number of observations (horizontal axis) versus the
                             cumulative share in associated volumes (vertical axis). The 45° line in the panel
                             represents the benchmark of perfectly equally distributed volumes, which would
                             occur if all bilateral country-level links were of the same size. In practice, the largest
                             1% of observed cross-border banking links contributed as much to the total volume
                             at end-2018 as the smallest 99%. This indicates an extremely unequal distribution.6
                                  The largest links are mainly between advanced economies (Graph 2): the larger
                             the size of the relationship, the greater the role of advanced economies – in particular,
                             those that are home to major global banks.
                                  At end-2018, 80% of cross-border credit within the group of largest links was vis-
                             à-vis borrowers in advanced economies, with 52% going to non-euro area advanced
                             economies and 28% to euro area countries (left-hand panel). Conversely, EMEs
                             dominate in the smaller links (see also Box B).

                             5
                                       While highly concentrated and skewed, the network of cross-border bilateral links does not resemble
                                       the so-called power law distribution which has been found in some real-world bank networks (Hüser
                                       (2015)). Instead, it is better characterised by a log-normal distribution (Minoiu and Reyes (2013)).
                             6
                                       A numerical representation of the Lorenz curve is the Gini coefficient. A coefficient of 0 (1) indicates
                                       maximum equality (inequality). As of end-2018, the Gini coefficient for cross-border banking links
                                       stood slightly above 0.85. For comparison, typical Gini coefficients for income distribution in
                                       industrialised countries are between 0.3 and 0.5 (Piketty (2014), Moriguchi and Saez (2010)). The Gini
                                       coefficient for cross-border bank links is closer to that for bilateral exports (0.83 at end-2018).

                             BIS Quarterly Review, June 2019                                                                                   3
Box A

    Analysing bilateral country links using the BIS international banking statistics
    The BIS international banking statistics (IBS) are collected by national authorities at the bank level but reported to the
    BIS at the country level; all banks in a given reporting country are aggregated together. Therefore, the IBS measure
    country-to-country links but do not measure the much larger number of bilateral links between individual banks and
    borrowers. At end-2018, the locational banking statistics (LBS) captured the positions of more than 8,000 banks,
    reported as 47 country aggregates. Banks reported their positions against borrowers in more than 215 countries,
    resulting in 5,927 country-to-country links. Many of these links are for insignificant amounts of less than $0.5 million.
    Excluding these small links results in 4,822 links greater than $0.5 million.
         The LBS include intragroup business and measure the geographical concentration of cross-border business. For
    example, a US bank might route its cross-border business via a financial centre such as London, resulting in two links:
    from the United States to the United Kingdom, and from the United Kingdom to the country where the final borrower
    resides. Therefore, the LBS potentially underestimate concentration of bank creditors because the same banking group
    may operate in different countries at the same time. The BIS consolidated banking statistics (CBS) take a nationality
    perspective and consolidate the worldwide claims of a given banking group to the country where it is headquartered.
          Not surprisingly, the number of links is much higher in the LBS than the CBS: 4,822 versus 3,550 at end-2018
    (Graph A, left-hand panel). In part, this is due to differences in the number of reporting countries: 47 in the LBS,
    compared with 31 in the CBS. But the different reporting concepts of the LBS and the CBS mean that they cover
    different elements of international banking links. The CBS, by definition, do not contain claims between affiliates of
    the same banking group. The CBS, however, include credit extended locally by a foreign office of a given banking
    group. They distinguish between international claims (cross-border and local claims in foreign currency) and local
    claims in local currency. Internationally active banking groups tend to have large subsidiaries in advanced economies
    and in many major emerging market economies, reflected in a relatively high share of local claims in local currency.
          In terms of how concentrated international banking is, the cross-border claims in the LBS and foreign claims in
    the CBS present a very similar picture (Graph A, right-hand panel; see also Graph 1, left-hand panel). The largest size
    group (>$50 billion) constitutes 3.1% of all consolidated links by number (versus 2.4% for LBS), which amount to 70%
    of all claims by volume (67% in the LBS). The smallest bilateral links (
Concentration by recipient and lender country region
At end-2018, in per cent1                                                                                                             Graph 2

By region of borrowing country                                             By region of creditor country
                                                                    100                                                                   100

                                                                     80                                                                    80

                                                                     60                                                                    60

                                                                     40                                                                    40

                                                                     20                                                                    20

                                                                      0                                                                      0
    50                50
     mn      –1bn        bn         bn         bn         bn                  mn      –1bn       bn          bn        bn        bn

                       Euro area            Other AEs            EMEs            Offshore              Big 5: DE, FR, GB, JP and US
1
  By size bucket of bilateral cross-border claims. Using LBS data on bilateral cross-border claims on all counterparty sectors, all currencies.
Claims below $0.5 million are excluded from calculations. Regional composition is different between the two panels since only a limited
number of countries within a region report LBS.

Sources: BIS locational banking statistics (LBS); authors’ calculations.

                                  Turning to the creditor country perspective, the concentration around advanced
                             economies is even more pronounced. Across all size groups, advanced economies
                             provide at least 50% of cross-border credit, and more than 80% within the largest
                             size group. Close to 70% of the volume of the largest-sized links, and 55% of total
                             global cross-border credit, is explained by creditors in only five major advanced
                             economies: France, Germany, Japan, the United Kingdom and the United States.

                             Concentration and the fall in cross-border interbank credit

                             The distribution of links across the different size buckets has been very stable over
                             time. This suggests that concentration is a structural feature of the cross-border
                             banking network. The increase in the share of very large links (Graph 3, left-hand
                             panel, dashed line) in the years before the GFC exacerbated the already high
                             concentration (right-hand panel, black line). The share in total cross-border bank
                             credit volumes of the largest links rose from around 50% to 75% in the six years up
                             to 2008. It has declined only gradually since, to 67% at end-2018.
                                  The structural nature of concentration is underscored by how concentration in
                             interbank links responded to the significant fall in cross-border interbank credit in the
                             aftermath of the GFC. While global cross-border bank credit to the non-bank sector
                             has continued to grow since the GFC, cross-border interbank credit has been falling
                             (Graph 4, left-hand panel). This has resulted in a significant and persistent reduction
                             in the share of interbank credit, from around 65% at end-2008 to 53% at end-2018
                             (red line).
                                 The rapid initial decline in interbank cross-border credit, and the fall in its share,
                             could conceivably have affected concentration in several possible ways. One
                             possibility is that interbank borrowers could have tried to diversify their creditor base

                             BIS Quarterly Review, June 2019                                                                                  5
Persistent concentration in cross-border banking links
Share in the total, in per cent1                                                                                                        Graph 3

Number of links                                                            Volume of links

3.5                                                                  50    0.30                                                               75

3.0                                                                  40    0.24                                                               60

2.5                                                                  30    0.18                                                               45

2.0                                                                  20    0.12                                                               30

1.5                                                                  10    0.06                                                               15

1.0                                                                   0    0.00                                                                0

      00     02    04   06        08   10   12     14     16    18                00     02    04     06     08   10     12   14   16    18

    Lhs:            Rhs:                                                     Lhs:                   Rhs:
           >50bn
Interbank claims have been declining while their concentration has remained high1                                                    Graph 4

Cross-border claims by counterparty sector                                 HHI by counterparty sector3
Per cent                                                        USD trn                                                                   HHI

65                                                                   30                                                                   0.35

60                                                                   20                                                                   0.30

55                                                                   10                                                                   0.25

50                                                                    0                                                                   0.20
     00      02    04   06     08    10     12     14    16     18              02   04     06     08     10    12     14     16     18
    Lhs:                            Rhs:
           Interbank share2                Bank          Non-bank                Bank            Non-bank
1
  Using LBS data on bilateral cross-border claims in all currencies. Claims below $0.5 million are excluded from calculations. Reporting of LBS
statistics improves over time; from end-December 2015, this includes China and Russia as reporting countries. 2 Interbank share is calculated
as the ratio of claims on the bank sector over claims on all counterparty sectors. 3 Median value of Herfindahl-Hirschman index (HHI) across
the counterparty countries within a sector. HHI is calculated as the sum of squared market shares, where market share is the share of claims
held by a creditor in total claims on a counterparty country.

Sources: BIS locational banking statistics (LBS); authors’ calculations.

                                  The drop in the interbank share was to a significant extent driven by the well
                              documented contraction in credit extended by European banks following the GFC
                              and the euro area crisis (McCauley et al (2017)). Interbank lending to euro area
                              countries and other advanced economies was particularly affected. Hence,
                              concentration in interbank credit may have responded differently across recipient
                              country regions.
                                  Despite the sharp drop in cross-border interbank credit to euro area countries,
                              concentration in the euro area did not abate but intensified (Graph 5, first panel). This
                              can be explained by the relative stability of interbank links to major euro area
                              countries, which tend to be of large size, while interbank credit to periphery countries
                              recorded strong declines.
                                   Other advanced economies and recipients in offshore centres did see a decline
                              in the concentration of cross-border interbank credit (Graph 5). However, this did not
                              occur in the immediate aftermath of the GFC. The decrease in the concentration of
                              interbank credit for advanced economy borrowers outside of the euro area occurred
                              in more recent years (second panel), and is largely explained by the contraction in the
                              volume of large links coming from offshore centres. Concentration for borrowers in
                              offshore centres (fourth panel) dropped substantially from the peak in 2010, but has
                              not abated further with the continued decline in the interbank share. For borrowers
                              in EMEs, interbank shares have increased slightly since the GFC, mainly driven by
                              China. Concentration in interbank credit is much higher for EME borrowers than for
                              borrowers in advanced economies, but shows no clear trend (third panel).

                              BIS Quarterly Review, June 2019                                                                                 7
Interbank concentration remains high despite the decline in interbank credit1                                                           Graph 5

Euro area                             Other AEs                             EMEs                                  Offshore centres
Per cent                        HHI   Per cent                        HHI   Per cent                        HHI   Per cent                    HHI

70                              0.4   70                              0.4   70                              0.4   70                          0.4

60                              0.3   60                              0.3   60                              0.3   60                          0.3

50                              0.2   50                              0.2   50                              0.2   50                          0.2

40                              0.1   40                              0.1   40                              0.1   40                          0.1
       03     08    13     18                03     08    13     18                  03     08   13    18                03   08   13    18
                                            Lhs:                              Rhs:
                                                   Interbank share2                  HHI3
1
  Using LBS data on bilateral cross-border claims on the bank sector in all currencies. Claims below $0.5 million are excluded from
calculations. 2 Interbank share is calculated as the ratio of claims on the bank sector over claims on all counterparty sectors. 3 Median
value of the Herfindahl-Hirschman index (HHI) across the counterparty countries within a region. HHI is calculated as the sum of squared
market shares, where market share is the share of claims held by a creditor in total claims on a counterparty country.

Sources: BIS locational banking statistics (LBS); authors’ calculations.

Conclusions

Cross-border interbank links are highly concentrated. A small number of very large
country-level links (>$50 billion), mostly between advanced economies, dominate
cross-border bank credit. Just five major creditor countries – France, Germany, Japan,
the United Kingdom and the United States – account for 55% of global cross-border
credit and close to 70% of the volume of the largest bilateral links. The share of the
largest links increased in the run-up to the GFC and has declined only slightly since.
     Concentration in cross-border credit is of a structural nature. This is corroborated
by the high concentration in interbank links, which persisted amid the significant
decline of cross-border interbank credit after the GFC. From a research perspective, a
relevant implication of the structurally high concentration in cross-border banking
links is that empirical analyses that give equal weight to all observations are likely to
yield unreliable results for a number of important questions (Amiti et al (2017)). From
a policy perspective, the persistently high concentration in links implies that cross-
border banking remains a potentially important channel for transmitting financial
shocks.

8                                                                                      BIS Quarterly Review, June 2019
Box B

The importance of small cross-border banking links for emerging market economies
While small links – smaller than $100 million in size – account for a minor share of the total volume of cross-border
credit, they account for a significant share of credit to borrowers in many emerging market economies (EMEs). For
example, cross-border credit to borrowers in Gambia and Sierra Leone is entirely through small links (Graph B1). But
small links are not equally important for all EMEs. For the largest, such as Brazil and China, small links are negligible.

Small links matter for small EME recipient countries1
At end-2018, percentage of GDP                                                                                                             Graph B1

                                                                                                                                                      12

                                                                                                                                                      10

                                                                                                                                                       8

                                                                                                                                                       6

                                                                                                                                                       4

                                                                                                                                                       2

                                                                                                                                                       0
        a

                                     e
                       l A esia

                         Le p.
                         Gr ho

                          Bh a
                        M an

                                  va

                         in iti
                       Bo so

                                     a

                          en n

                          Tu n
                        Pa sia

                                  ay

                            Bo r
                        Ta ia

                         at ia

                 sn ak la
                       an tan

                        M erz.

                                  co

                                     a

                                     il

                                     a
                                  e

                                az
      bi

                                ad

                                an

                                re

                                 in
              on

                                   i
                                  a

                               liv

                     Gu zan

                                 a
                               Re

                               en
                                 a

                               ig
                              do

                              gu
                              Fa

                              oc
                              ut

                              ist
                                t

                              ni

                            em

                             Ch
                              H
    m

                             Ko
                    ia hs

                             Br
                             so

                              H
                              w
                            en
          Le

                            on

                             N
                             B

                           or
                           ra
                           ol
Ga

                          fr.

                            n
                            a
                           ts

                          d
              icr
        ra

                        m

               Bo Kaz
                      rk
     er

              M

                     rk
                   ra

                   Bu
    Si

                  Tu
                  nt
              Ce

           Small links (
The volume of lending to EMEs associated with small cross-border relationships has increased steadily over the
     past two decades. This trend is evident for lending to both the non-bank and the bank sector (Graph B2). However,
     volumes disguise a fall in the average number of small bilateral links between banks and borrowers in EMEs. The only
     exception is non-bank borrowing in emerging Asia, which saw an increase in the average number of country-to-
     country links. Since 2014, the average number of interbank bilateral links has been declining for many EMEs,
     particularly in the Middle East and Africa and in emerging Asia. The decline in correspondent banking relationships in
     recent years may have contributed to the fall in the number of small bilateral links (CPMI (2019)).

10                                                                    BIS Quarterly Review, June 2019
Annexes

BIS Statistics: Charts

The statistics published by the BIS are a unique source of information about the
structure of and activity in the global financial system. BIS statistics are presented in
graphical form in this annex and in tabular form in the BIS Statistical Bulletin, which is
published concurrently with the BIS Quarterly Review. For introductions to the BIS
statistics and a glossary of terms used in this annex, see the BIS Statistical Bulletin.
     The data shown in the charts in this annex can be downloaded from the
BIS Quarterly Review page on the BIS website (www.bis.org/publ/quarterly.htm). Data
may have been revised or updated subsequent to the publication of this annex. For
the latest data and to download additional data, see the statistics pages on the BIS
website (www.bis.org/statistics/index.htm). A release calendar provides advance
notice of publication dates (www.bis.org/statistics/relcal.htm).

A      Locational banking statistics

A.1 Cross-border claims, by sector, currency and instrument ........................................ A4

A.2 Cross-border claims, by borrowing region..................................................................... A5

A.3 Cross-border claims, by borrowing country .................................................................. A6

A.4 Cross-border claims, by nationality of reporting bank and currency of
    denomination ............................................................................................................................. A7

A.5 Cross-border liabilities of reporting banks..................................................................... A8

B      Consolidated banking statistics

B.1 Consolidated claims of reporting banks on advanced economies ....................... A9

B.2 Consolidated claims of reporting banks on emerging market economies .....A10

C      Debt securities statistics

C.1 Global debt securities markets ..........................................................................................A11

C.2 Total debt securities, by sector of issuer .......................................................................A11

C.3 Net issuance of international debt securities ..............................................................A12

C.4 International debt securities issued by financial and non-financial
    corporations..............................................................................................................................A12

D Derivatives statistics

D.1 Exchange-traded derivatives ..............................................................................................A13

BIS Quarterly Review, June 2019                                                                                                                 A1
D.2 Global OTC derivatives markets ....................................................................................... A14

D.3 OTC foreign exchange derivatives ................................................................................... A14

D.4 OTC interest rate derivatives.............................................................................................. A15

D.5 OTC equity-linked derivatives ........................................................................................... A15

D.6 OTC commodity derivatives ............................................................................................... A16

D.7 Credit default swaps .............................................................................................................. A16

D.8 Concentration in global OTC derivatives markets ..................................................... A17

D.9 Growth of central clearing .................................................................................................. A17

E       Global liquidity indicators

E.1 Growth of international bank credit................................................................................ A18

E.2 Global bank credit to the private non-financial sector, by residence of
    borrower .................................................................................................................................... A19

E.3 Global credit to the non-financial sector, by currency ............................................ A20

E.4 US dollar-denominated credit to non-banks outside the United States ......... A21

E.5 Foreign currency credit to non-banks in EMDEs ...................................................... A21

F       Statistics on total credit to the non-financial sector

F.1 Total credit to the non-financial sector (core debt) ................................................. A22

F.2 Total credit to the private non-financial sector (core debt) ................................. A23

F.3 Bank credit to the private non-financial sector (core debt) .................................. A24

F.4 Total credit to households (core debt) .......................................................................... A25

F.5 Total credit to non-financial corporations (core debt) ............................................ A26

F.6 Total credit to the government sector at market value (core debt) .................. A27

F.7 Total credit to the government sector at nominal value (core debt) ................ A28

G Debt service ratios for the private non-financial sector

G.1 Debt service ratios of the private non-financial sector ........................................... A29

G.2 Debt service ratios of households ................................................................................... A30

G.3 Debt service ratios of non-financial corporations ..................................................... A31

A2                                                                                                           BIS Quarterly Review, June 2019
H Property price statistics

H.1 Real residential property prices ........................................................................................A32

I      Effective and US dollar exchange rate statistics

I.1 Real effective exchange rates ............................................................................................A33

I.2 US dollar exchange rates .....................................................................................................A34

J      Credit-to-GDP gaps

J.1 Credit-to-GDP gaps ...............................................................................................................A35

K      Consumer price indices

K.1 Consumer prices .....................................................................................................................A36

L      Central bank policy rates

L.1 Central bank policy or representative rates .................................................................A37

BIS Quarterly Review, June 2019                                                                                                            A3
A Locational banking statistics

Cross-border claims, by sector, currency and instrument                                                                                        Graph A.1

Amounts outstanding, in USD trn1                        Adjusted changes, in USD bn2                             Annual change, in per cent3
By sector of counterparty

                                                   30                                                    500                                           10

                                                   20                                                       0                                            0

                                                   10                                                  –500                                           –10

                                                    0                                                –1,000                                           –20
   14        15       16        17           18              14      15      16       17     18                      14   15      16   17      18
                                                                                  4
          Non-bank                Related offices             Unrelated banks                 Unallocated

By currency

                                                   30                                                    500                                           10

                                                   20                                                       0                                            0

                                                   10                                                  –500                                           –10

                                                    0                                                –1,000                                           –20
   14        15       16        17           18              14      15      16       17     18                      14   15      16   17      18
         US dollar              Euro              Yen          Other currencies5              Unallocated

By instrument

                                                   30                                                    500                                           15

                                                   20                                                       0                                            0

                                                   10                                                  –500                                           –15

                                                    0                                                –1,000                                           –30
   14        15       16        17           18              14      15      16       17     18                      14   15      16   17      18
      Loans and deposits             Debt securities          Other instruments              Unallocated
Further information on the BIS locational banking statistics is available at www.bis.org/statistics/bankstats.htm.
1
  At quarter-end. Amounts denominated in currencies other than the US dollar are converted to US dollars at the exchange rate prevailing on the reference
date. 2 Quarterly changes in amounts outstanding, adjusted for the impact of exchange rate movements between quarter-ends and methodological breaks in
the data. 3 Geometric mean of quarterly percentage adjusted changes. 4 Includes central banks and banks unallocated by subsector between intragroup and
unrelated banks. 5 Other reported currencies, calculated as all currencies minus US dollar, euro, yen and unallocated currencies. The currency is known but
reporting is incomplete.
Source: BIS locational banking statistics.

A4                                                                                              BIS Quarterly Review, June 2019
Cross-border claims, by borrowing region                                                                                                       Graph A.2

Amounts outstanding, in USD trn1                        Adjusted changes, in USD bn2                             Annual change, in per cent3
On all countries

                                                  30                                                     500                                           8

                                                  20                                                        0                                          0

                                                  10                                                   –500                                          –8

                                                   0                                                 –1,000                                         –16
   14        15       16        17           18              14      15      16      17       18                     14   15   16     17       18
                      Advanced economies                       Offshore centres                 EMEs

On developed countries

                                                  20                                                                                                   5
                                                                                                         500

                                                  15                                                                                                   0
                                                                                                            0
                                                  10                                                                                                 –5

                                                                                                       –500
                                                   5                                                                                                –10

                                                   0                                                 –1,000                                         –15
   14        15       16        17           18              14      15      16      17       18                     14   15   16     17       18
         Euro area               Other European                   Other Advanced
                                 advanced

On emerging market economies

                                                  3.6                                                    150                                         20

                                                  2.4                                                       0                                          0

                                                  1.2                                                  –150                                         –20

                                                  0.0                                                  –300                                         –40
   14       15        16        17       18                  14       15      16       17      18                    14   15   16     17       18
                  Emerging Asia and Pacific                    Emerging Latin America and Caribbean
                  Emerging Europe                              Emerging Africa and Middle East

Further information on the BIS locational banking statistics is available at www.bis.org/statistics/bankstats.htm.
1
  At quarter-end. Amounts denominated in currencies other than the US dollar are converted to US dollars at the exchange rate prevailing on the reference
date. 2 Quarterly changes in amounts outstanding, adjusted for the impact of exchange rate movements between quarter-ends and methodological breaks in
the data. 3 Geometric mean of quarterly percentage adjusted changes.
Source: BIS locational banking statistics.

                                 BIS Quarterly Review, June 2019                                                                                      A5
Cross-border claims, by borrowing country                                                                                                      Graph A.3

Amounts outstanding, in USD trn1                           Adjusted changes, in USD bn2                          Annual change, in per cent3
On selected advanced economies

                                                     15                                                  450                                         15

                                                     10                                                     0                                          0

                                                      5                                                –450                                         –15

                                                      0                                                –900                                         –30
   14        15       16        17           18               14      15      16       17      18                    14   15      16   17      18
         United States           United Kingdom                France            Germany              Japan

On selected offshore centres

                                                      3                                                  100                                         20

                                                      2                                                     0                                          0

                                                      1                                                –100                                         –20

                                                      0                                                –200                                         –40
   14        15        16        17          18               14      15      16       17      18                    14   15      16   17      18
        Cayman Islands           Hong Kong SAR                 Singapore           Jersey         Bahamas

On selected emerging market economies

                                                     1.5                                                 100                                         40

                                                     1.0                                                    0                                          0

                                                     0.5                                               –100                                         –40

                                                     0.0                                               –200                                         –80
   14       15        16        17       18                   14      15      16       17      18                    14   15      16   17      18
             China           Brazil               India        Russia              South Africa
Further information on the BIS locational banking statistics is available at www.bis.org/statistics/bankstats.htm.
1
  At quarter-end. Amounts denominated in currencies other than the US dollar are converted to US dollars at the exchange rate prevailing on the reference
date. 2 Quarterly changes in amounts outstanding, adjusted for the impact of exchange rate movements between quarter-ends and methodological breaks in
the data. 3 Geometric mean of quarterly percentage adjusted changes.
Source: BIS locational banking statistics.

A6                                                                                              BIS Quarterly Review, June 2019
Cross-border claims, by nationality of reporting bank and currency of denomination                                                             Graph A.4

Amounts outstanding, in USD trn1                        Adjusted changes, in USD bn2                             Annual change, in per cent3
All currencies

                                                  30                                                     500                                         10

                                                  20                                                        0                                          0

                                                  10                                                   –500                                         –10

                                                   0                                                 –1,000                                         –20
   14        15       16        17           18              14      15      16      17       18                     14   15   16     17       18
                                 Japan                         France                 Other
                                 United States                 Germany

US dollar

                                                  15                                                     500                                         15

                                                  10                                                        0                                          0

                                                   5                                                   –500                                         –15

                                                   0                                                 –1,000                                         –30
   14        15       16        17           18              14      15      16      17       18                     14   15   16     17       18
                                     Japan                     United Kingdom                 Other
                                     United States             Switzerland

Euro

                                                   9                                                     300                                         20

                                                   6                                                        0                                          0

                                                   3                                                   –300                                         –20

                                                   0                                                   –600                                         –40
   14        15       16        17           18              14       15      16       17      18                    14   15   16     17       18
                                        Germany                Netherlands                    Other
                                        France                 United Kingdom
Further information on the BIS locational banking statistics is available at www.bis.org/statistics/bankstats.htm.
1
  At quarter-end. Amounts denominated in currencies other than the US dollar are converted to US dollars at the exchange rate prevailing on the reference
date. 2 Quarterly changes in amounts outstanding, adjusted for the impact of exchange rate movements between quarter-ends and methodological breaks in
the data. 3 Geometric mean of quarterly percentage adjusted changes.
Source: BIS locational banking statistics.

                                 BIS Quarterly Review, June 2019                                                                                      A7
Cross-border liabilities of reporting banks                                                                                                    Graph A.5

Amounts outstanding, in USD trn1                            Adjusted changes, in USD bn2                         Annual change, in per cent3
To emerging market economies

                                                        3                                                100                                          15

                                                        2                                                   0                                          0

                                                        1                                              –100                                          –15

                                                        0                                              –200                                          –30
   14        15        16        17          18                14      15     16       17      18                    14   15      16   17      18
                  Emerging Asia and Pacific                     Emerging Latin America and Caribbean
                  Emerging Europe                               Emerging Africa and Middle East

To central banks

                                                   1.2                                                    50                                         50

                                                   0.8                                                      0                                         0

                                                   0.4                                                   –50                                         –50

                                                   0.0                                                 –100                                         –100
   14       15        16        17       18                    14      15     16       17      18                    14   15   16      17   18
          US dollar            Euro               Yen              Other currencies            Unallocated

By currency type and location

                                                    30                                                  600                                           5

                                                    20                                                      0                                         0

                                                    10                                                 –600                                           –5

                                                        0                                            –1,200                                          –10
   14        15       16        17           18               14      15     16       17     18                      14   15      16   17      18
              Cross-border in all currencies                    Unallocated
              Resident in foreign currencies
Further information on the BIS locational banking statistics is available at www.bis.org/statistics/bankstats.htm.
1
  At quarter-end. Amounts denominated in currencies other than the US dollar are converted to US dollars at the exchange rate prevailing on the reference
date. 2 Quarterly changes in amounts outstanding, adjusted for the impact of exchange rate movements between quarter-ends and methodological breaks in
the data. 3 Geometric mean of quarterly percentage adjusted changes.
Source: BIS locational banking statistics.

A8                                                                                              BIS Quarterly Review, June 2019
B Consolidated banking statistics

Consolidated claims of reporting banks on advanced economies                                                                                       Graph B.1

Foreign claims and local positions,                      Foreign claims of selected creditors,                  International claims, by sector and
in USD bn1, 2                                            in USD bn1, 3                                          maturity, in per cent4
On the euro area

                                             7,500                                                   1,200                                                   45

                                             5,000                                                      800                                                  30

                                             2,500                                                      400                                                  15

                                                     0                                                     0                                                  0
    14     15      16       17      18                     14      15       16        17      18                   14     15      16        17       18
         Foreign claims (immediate)5                             FR              GB           ES                        Banks
                                      6
         Foreign claims (ultimate)                               US              JP                                     Official sector
         Local claims in local currency                                                                                 Non-bank private sector
         Local liabilities in local currency                                                                            Up to and including 1 year

On the United States

                                             6,000                                                   1,500                                                   60

                                             4,000                                                   1,000                                                   40

                                             2,000                                                      500                                                  20

                                                     0                                                     0                                                  0
    14     15       16       17       18                   14      15       16        17      18                   14     15      16        17       18
                                                                 JP              CH            DE
                                                                 GB              FR

On Japan

                                               900                                                      450
                                                                                                                                                             50

                                               600                                                      300
                                                                                                                                                             25
                                               300                                                      150

                                                     0                                                     0                                                  0

    14     15       16       17       18                   14       15       16       17        18                 14     15      16       17       18
                                                                 US              GB            AU
                                                                 FR              TW
Further information on the BIS consolidated banking statistics is available at www.bis.org/statistics/bankstats.htm.
1
  Amounts outstanding at quarter-end. Amounts denominated in currencies other than the US dollar are converted to US dollars at the exchange rate prevailing
on the reference date. 2 Excludes domestic claims, ie claims on residents of a bank’s home country. 3 Foreign claims on an ultimate risk basis, by nationality of
reporting bank. The banking systems shown are not necessarily the largest foreign bank creditors on each reference date. 4 As a percentage of international
claims outstanding. 5 On an immediate counterparty basis. Includes the unconsolidated claims of banks headquartered outside but located inside CBS-reporting
countries. 6 On an ultimate risk basis.
Source: BIS consolidated banking statistics (CBS).

                                  BIS Quarterly Review, June 2019                                                                                             A9
Consolidated claims of reporting banks on emerging market economies                                                                                Graph B.2

Foreign claims and local positions,                      Foreign claims of selected creditors,                  International claims, by sector and
in USD bn1, 2                                            in USD bn1, 3                                          maturity, in per cent4
On China

                                                1,200                                                   180                                                  75

                                                 800                                                    120                                                  50

                                                 400                                                     60                                                  25

                                                     0                                                     0                                                  0

    14     15       16       17      18                    14       15       16       17        18                 14     15      16       17       18
                                            5
         Foreign claims (immediate)                              GB            JP             FR                        Banks
         Foreign claims (ultimate)6                              US            TW                                       Official sector
         Local claims in local currency                                                                                 Non-bank private sector
         Local liabilities in local currency                                                                            Up to and including 1 year

On Turkey

                                                 300                                                     75                                                  60

                                                 200                                                     50                                                  40

                                                 100                                                     25                                                  20

                                                     0                                                     0                                                  0

    14      15       16       17       18                  14       15       16       17        18                 14     15      16        17       18
                                                                 ES            GB             DE
                                                                 FR            US

On Brazil

                                                 450                                                    180                                                  60

                                                 300                                                    120                                                  40

                                                 150                                                     60                                                  20

                                                     0                                                     0                                                  0

    14      15       16       17       18                  14       15       16       17        18                 14     15      16        17       18
                                                                 ES             GB            FR
                                                                 US             JP
Further information on the BIS consolidated banking statistics is available at www.bis.org/statistics/bankstats.htm.
1
  Amounts outstanding at quarter-end. Amounts denominated in currencies other than the US dollar are converted to US dollars at the exchange rate prevailing
on the reference date. 2 Excludes domestic claims, ie claims on residents of a bank’s home country. 3 Foreign claims on an ultimate risk basis, by nationality of
reporting bank. The banking systems shown are not necessarily the largest foreign bank creditors on each reference date. 4 As a percentage of international
claims. 5 On an immediate counterparty basis. Includes the unconsolidated claims of banks headquartered outside but located inside CBS-reporting
countries. 6 On an ultimate risk basis.
Source: BIS consolidated banking statistics (CBS).

A10                                                                                            BIS Quarterly Review, June 2019
C Debt securities statistics

Global debt securities markets1
Amounts outstanding, in trillions of US dollars2                                                                                                          Graph C.1

By market of issue                                         By sector of issuer                                        By currency of denomination3

                                                   90                                                       45                                                   45

                                                   60                                                       30                                                   30

                                                   30                                                       15                                                   15

                                                    0                                                            0                                                0

    14         15     16       17        18                    14        15     16        17         18                   14        15    16         17    18
          TDS              DDS                                      GG             NFC                                         USD             JPY
          IDS                                                       FC             IO                                          EUR             OTH
DDS = domestic debt securities; IDS = international debt securities; TDS = total debt securities.
FC = financial corporations; GG = general government; HH = households and non-profit institutions serving households; IO = international organisations; NFC =
non-financial corporations.
Further information on the BIS debt securities statistics is available at www.bis.org/statistics/secstats.htm.
1
  Sample of countries varies across breakdowns shown. For countries that do not report TDS, data are estimated by the BIS as DDS plus IDS. For countries that do
not report either TDS or DDS, data are estimated by the BIS as IDS. 2 At quarter-end. Amounts denominated in currencies other than the US dollar are converted
to US dollars at the exchange rate prevailing on the reference date. 3 Where a currency breakdown is not available, DDS are assumed to be denominated in the
local currency.
Sources: Dealogic; Euroclear; Thomson Reuters; Xtrakter Ltd; national data; BIS debt securities statistics; BIS calculations.

Total debt securities, by residence and sector of issuer1
Amounts outstanding for the latest available data, in trillions of US dollars2                                                                            Graph C.2

         Lhs                                                    Rhs
40                                                                                                                                                                4

30                                                                                                                                                                3

20                                                                                                                                                                2

10                                                                                                                                                                1

0                                                                                                                                                                 0
          US        CN           JP         GB            FR        DE        IT         CA           NL             ES        KR        AU      KY         IE
          General government                      Non-financial corporations
          Financial corporations                  Households and non-profit institutions serving households
Further information on the BIS debt securities statistics is available at www.bis.org/statistics/secstats.htm.
1
  For countries that do not report TDS, data are estimated by the BIS as DDS plus IDS.           2
                                                                                                     Amounts denominated in currencies other than the US dollar are
converted to US dollars at the exchange rate prevailing on the reference date.
Sources: National data; BIS debt securities statistics.

                                  BIS Quarterly Review, June 2019                                                                                                A11
Net issuance of international debt securities
By issuer sector and currency of denomination, in billions of US dollars                                                                              Graph C.3

US dollars                                                Euro                                                       Pound Sterling

                                                 225                                                                                                         40
                                                                                                              75

                                                 150                                                                                                         20
                                                                                                               0
                                                   75                                                                                                         0

                                                                                                            –75
                                                    0                                                                                                        –20

                                                 –75                                                       –150                                              –40
    2014 2015 2016 2017 2018 2019                          2014 2015 2016 2017 2018 2019                              2014 2015 2016 2017 2018 2019
          Banks                                                     Non-financial corporations                                 General government
          Other financial institutions                                                                                         International organizations
Further information is available at www.bis.org/statistics/secstats.htm.

Sources: Dealogic; Euroclear; Thomson Reuters; Xtrakter Ltd; BIS debt securities statistics.

International debt securities issued by financial and non-financial corporations1
Net issuance by region, in billions of US dollars2                                                                                                    Graph C.4

Developed countries                                       Developing countries                                       Offshore centres

                                                                                                              90                                             120
                                                 200
                                                                                                              60                                              90

                                                 100                                                          30                                              60

                                                                                                               0                                              30
                                                    0
                                                                                                            –30                                                0

                                                –100                                                        –60                                              –30
    2014 2015 2016 2017 2018 2019                           2014 2015 2016 2017 2018 2019                             2014 2015 2016 2017 2018 2019
                                                                     Nationals               Residents
Further information is available at www.bis.org/statistics/secstats.htm.
1
    Excluding general government.   2
                                        For a list of countries in each region, see Table C1 (http://stats.bis.org/statx/srs/table/c1).
Sources: Dealogic; Euroclear; Thomson Reuters; Xtrakter Ltd; BIS debt securities statistics.

A12                                                                                                BIS Quarterly Review, June 2019
D Derivatives statistics

Exchange-traded derivatives                                                                                                                                   Graph D.1

Open interest, by currency1                              Daily average turnover,                                   Daily average turnover,
                                                         by currency2                                              by location of exchange2
Foreign exchange derivatives, USD bn3

                                                 375                                                       150                                                     150

                                                 250                                                       100                                                     100

                                                 125                                                          50                                                       50

                                                     0                                                         0                                                        0
   11         13         15         17         19            11         13         15         17         19             11         13        15          17       19

Interest rate derivatives, USD trn3

                                                    60                                                        6                                                         9

                                                    40                                                        4                                                         6

                                                    20                                                        2                                                         3

                                                     0                                                       0                                                          0
   11          13         15         17         19            11         13          15         17          19          11         13         15          17       19
                                          US dollar               Pound sterling               Other                      North America                Asia and Pacific
                                          Euro                    Yen                                                     Europe                       Other markets
Further information on the BIS derivatives statistics is available at www.bis.org/statistics/extderiv.htm. For definitions, see the online glossary.
1
  At quarter-end. Amounts denominated in currencies other than the US dollar are converted to US dollars at the exchange rate prevailing on the reference
date. 2 Quarterly averages of daily turnover. 3 Futures and options.
Sources: Euromoney TRADEDATA; Futures Industry Association; The Options Clearing Corporation; BIS derivatives statistics.

                                 BIS Quarterly Review, June 2019                                                                                                    A13
Global OTC derivatives markets1                                                                                                                             Graph D.2

Notional principal                                        Gross market value                                       Gross credit exposure
                                            USD trn                                                   USD trn      Per cent                                    USD trn

                                                 600                                                        30      30                                             4.5

                                                 400                                                        20      20                                             3.0

                                                 200                                                        10      10                                             1.5

                                                      0                                                       0     0                                              0.0
       12          14           16         18                    12          14           16          18                       12         14           16     18

                                      Interest rate              Commodities                                                 Share of gross market value (lhs)
                                      FX                         CDS                                                         Amounts (rhs)
                                      Equity
Further information on the BIS derivatives statistics is available at www.bis.org/statistics/derstats.htm. For definitions, see the online glossary.
1
  At half-year end (end-June and end-December). Amounts denominated in currencies other than the US dollar are converted to US dollars at the exchange rate
prevailing on the reference date.
Source: BIS derivatives statistics.

OTC foreign exchange derivatives
Notional principal1                                                                                                                                         Graph D.3

By currency                                               By maturity                                              By sector of counterparty
                                            USD trn                                                   Per cent     Per cent                                    USD trn

                                                  80                                                       100      8                                              80

                                                  60                                                        75      6                                              60

                                                  40                                                        50      4                                              40

                                                  20                                                        25      2                                              20

                                                      0                                                       0     0                                               0
    12           14           16           18                    12          14         16          18                         12         14           16    18
         US dollar                Pound sterling                   ≤ 1 year                                                Share of CCPs (lhs)
         Euro                     Yen                              > 1 year & ≤ 5 years                             Rhs:         Reporting dealers
                                                                   > 5 years                                                     Other financial institutions
                                                                                                                                 Non-financial institutions
Further information on the BIS derivatives statistics is available at www.bis.org/statistics/derstats.htm. For definitions, see the online glossary.
1
  At half-year end (end-June and end-December). Amounts denominated in currencies other than the US dollar are converted to US dollars at the exchange rate
prevailing on the reference date.
Source: BIS derivatives statistics.

A14                                                                                               BIS Quarterly Review, June 2019
OTC interest rate derivatives
Notional principal1                                                                                                                                         Graph D.4

By currency                                               By maturity                                              By sector of counterparty
                                              USD trn                                                 Per cent     Per cent                                    USD trn

                                                    240                                                    100      82                                             600

                                                    180                                                     75      80                                             450

                                                    120                                                     50      78                                             300

                                                     60                                                     25      76                                             150

                                                      0                                                       0     74                                               0
    12           14            16           18                   12          14         16          18                         12         14           16    18
          US dollar               Pound sterling                   ≤ 1 year                                                Share of CCPs (lhs)
          Euro                    Yen                              > 1 year & ≤ 5 years                             Rhs:         Reporting dealers
                                                                   > 5 years                                                     Other financial institutions
                                                                                                                                 Non-financial institutions
Further information on the BIS derivatives statistics is available at www.bis.org/statistics/derstats.htm. For definitions, see the online glossary.
1
  At half-year end (end-June and end-December). Amounts denominated in currencies other than the US dollar are converted to US dollars at the exchange rate
prevailing on the reference date.
Source: BIS derivatives statistics.

OTC equity-linked derivatives
Notional principal1                                                                                                                                         Graph D.5

By equity market                                          By maturity                                              By sector of counterparty
                                              USD trn                                                 Per cent     Per cent                                    USD trn

                                                      4                                                    100      8                                                8

                                                      3                                                     75      6                                                6

                                                      2                                                     50      4                                                4

                                                      1                                                     25      2                                                2

                                                      0                                                       0     0                                                0
     12            14            16            18                12          14         16          18                         12         14           16     18
          United States                     Japan                  ≤ 1 year                                                Share of CCPs (lhs)
          European countries                Other                  > 1 year & ≤ 5 years                             Rhs:         Reporting dealers
                                                                   > 5 years                                                     Other financial institutions
                                                                                                                                 Non-financial institutions
Further information on the BIS derivatives statistics is available at www.bis.org/statistics/derstats.htm. For definitions, see the online glossary.
1
  At half-year end (end-June and end-December). Amounts denominated in currencies other than the US dollar are converted to US dollars at the exchange rate
prevailing on the reference date.
Source: BIS derivatives statistics.

                                      BIS Quarterly Review, June 2019                                                                                              A15
OTC commodity derivatives1                                                                                                                                    Graph D.6

Notional principal, by instrument                        Notional principal, by commodity                          Gross market value, by commodity
                                            Per cent                                                  USD trn                                                   USD trn

                                                 100                                                          4                                                      0.8

                                                  75                                                          3                                                      0.6

                                                  50                                                          2                                                      0.4

                                                  25                                                          1                                                      0.2

                                                    0                                                         0                                                      0.0
       12          14            16       18                        12        14           16          18                     12        14          16          18
        Forwards and swaps                 Options                   Other commodities                 Gold                   Other precious metals
Further information on the BIS derivatives statistics is available at www.bis.org/statistics/derstats.htm. For definitions, see the online glossary.
1
  At half-year end (end-June and end-December). Amounts denominated in currencies other than the US dollar are converted to US dollars at the exchange rate
prevailing on the reference date.
Source: BIS derivatives statistics.

Credit default swaps1                                                                                                                                         Graph D.7

Notional principal                                       Notional principal with central                           Impact of netting
                                                         counterparties (CCPs)
Per cent                                     USD trn     Per cent                                     USD trn      Per cent                                      USD trn

20                                                40      60                                                6.0     30                                               1.2

15                                                30      45                                                4.5     25                                               0.9

10                                                20      30                                                3.0     20                                               0.6

5                                                 10      15                                                1.5     15                                               0.3

0                                                   0     0                                                 0.0     10                                               0.0
             14             16             18                  13        14   15     16      17     18                   13        14   15     16        17    18
           Gross market value/notional (lhs)                         CCPs/total (lhs)                                          Net/gross market values (lhs)
    Rhs:       Single-name notional                           Rhs:       Single-name notional                         Rhs:         Gross market values
               Multi-name notional                                       Multi-name notional                                       Net market values
Further information on the BIS derivatives statistics is available at www.bis.org/statistics/derstats.htm. For definitions, see the online glossary.
1
  At half-year end (end-June and end-December). Amounts denominated in currencies other than the US dollar are converted to US dollars at the exchange rate
prevailing on the reference date.
Source: BIS derivatives statistics.

A16                                                                                               BIS Quarterly Review, June 2019
Concentration in global OTC derivatives markets
Herfindahl index1                                                                                                                                         Graph D.8

Foreign exchange derivatives2                              Interest rate swaps                                     Equity-linked options

                                                  1,000                                                 1,400                                                     6,400

                                                    800                                                 1,000                                                     4,400

                                                    600                                                     600                                                   2,400

                                                    400                                                     200                                                    400
    12          14           16            18                  12         14           16         18                    12          14          16         18
                                USD                GBP             CHF             SEK                                       United States             Latin America
                                EUR                JPY             CAD                                                       Japan                     Other Asia
                                                                                                                             Europe
Further information on the BIS derivatives statistics is available at www.bis.org/statistics/derstats.htm. For definitions, see the online glossary.
1
  The index ranges from 0 to 10,000, where a lower number indicates that there are many dealers with similar market shares (as measured by notional principal)
and a higher number indicates that the market is dominated by a few reporting dealers. 2 Foreign exchange forwards, foreign exchange swaps and currency
swaps.
Source: BIS derivatives statistics.

Growth of central clearing
Notional amounts outstanding by counterparty, in per cent                                                                                                 Graph D.9

Interest rate derivatives                                                              Credit default swaps

                                                                               80                                                                                   80

                                                                               60                                                                                   60

                                                                               40                                                                                   40

                                                                               20                                                                                   20

                                                                                   0                                                                                   0
       06         08         10           12         14       16         18                 06         08         10         12          14          16      18
                                                Reporting dealers1                               Central counterparties1, 3
                                                Other financial institutions1, 2                 Estimated minimum clearing rate4
Further information on the BIS derivatives statistics is available at www.bis.org/statistics/derstats.htm. For definitions, see the online glossary.
1
  As a percentage of notional amounts outstanding against all counterparties. 2 Including central counterparties but excluding reporting dealers. 3 For interest
rate derivatives, data for CCPs prior to end-June 2016 are estimated by indexing the amounts reported at end-June 2016 to the growth since 2008 of notional
amounts outstanding cleared through LCH’s SwapClear service. 4 Proportion of trades that are cleared, estimated as (CCP / 2) / (1 – (CCP / 2)), where CCP
represents the share of notional amounts outstanding that dealers report against CCPs. CCPs’ share is halved to adjust for the potential double-counting of inter-
dealer trades novated to CCPs.
Sources: LCH.Clearnet Group Ltd; BIS OTC derivatives statistics (Table D7 and Table D10.1); BIS calculations.

                                      BIS Quarterly Review, June 2019                                                                                               A17
E Global liquidity indicators

US dollar credit outside the United States1
Annual change, in per cent                                                                                                                               Graph E.1

                                                                                                                                                                   20

                                                                                                                                                                   10

                                                                                                                                                                       0

                                                                                                                                                                  –10

                                                                                                                                                                  –20
                2002             2004             2006              2008             2010               2012            2014            2016            2018
                                                                                            2
          Total credit             Loans              Debt securities               NEER
Further information on the BIS global liquidity indicators is available at www.bis.org/statistics/gli.htm.
1
    Annual growth of US dollar-denominated credit to non-banks outside the United States.        2
                                                                                                     Annual growth of the US dollar nominal effective exchange rate.
Sources: Datastream; Dealogic; Euroclear; Thomson Reuters; Xtrakter Ltd; national data; BIS locational banking statistics; BIS effective exchange rate statistics; BIS
calculations.

A18                                                                                              BIS Quarterly Review, June 2019
You can also read