Beam-based aperture measurements with movable collimator jaws as performance booster of the CERN Large Hadron Collider
←
→
Page content transcription
If your browser does not render page correctly, please read the page content below
EPJ manuscript No.
                                                  (will be inserted by the editor)

                                                  Beam-based aperture measurements with movable collimator
                                                  jaws as performance booster of the CERN Large Hadron Collider
                                                  N. Fuster-Martı́nez1,2 , R. W. Aßmann3 , R. Bruce2 , M. Giovannozzi2 , P. Hermes2 , A. Mereghetti2 , D. Mirarchi2 ,
                                                  S. Redaelli2 and J. Wenninger2
arXiv:2106.09656v1 [physics.acc-ph] 17 Jun 2021

                                                  1
                                                      Instituto de Fı́sica Corpuscular (CSIC-UV), Valencia, Spain
                                                  2
                                                      CERN, Geneva, Switzerland
                                                  3
                                                      DESY, Hamburg, Germany

                                                              Received: date / Revised version: date

                                                              Abstract. The beam aperture of a particle accelerator defines the clearance available for the circulating
                                                              beams and is a parameter of paramount importance for the accelerator performance. At the CERN Large
                                                              Hadron Collider (LHC), the knowledge and control of the available aperture is crucial because the nominal
                                                              proton beams carry an energy of 362 MJ stored in a superconducting environment. Even a tiny fraction of
                                                              beam losses could quench the superconducting magnets or cause severe material damage. Furthermore, in
                                                              a circular collider, the performance in terms of peak luminosity depends to a large extent on the aperture
                                                              of the inner triplet quadrupoles, which are used to focus the beams at the interaction points. In the LHC,
                                                              this aperture represents the smallest aperture at top-energy with squeezed beams and determines the
                                                              maximum potential reach of the peak luminosity. Beam-based aperture measurements in these conditions
                                                              are difficult and challenging. In this paper, we present different methods that have been developed over
                                                              the years for precise beam-based aperture measurements in the LHC, highlighting applications and results
                                                              that contributed to boost the operational LHC performance in Run 1 (2010-2013) and Run 2 (2015-2018).

                                                  1 Introduction
                                                  In most storage rings, a detailed knowledge of the geometric aperture is required in order to guarantee a sufficient
                                                  beam clearance and a safe operation, to minimise the downtime and optimise the beam losses around the ring. In the
                                                  CERN Large Hadron Collider (LHC) [1], where proton and heavy-ion beams are brought in collisions for high-energy
                                                  physics experiments, the control of the available aperture becomes critical due to the nominal stored proton-beam
                                                  energy of 362 MJ in a superconducting (SC) accelerator environment. Even small losses of the order of tens of mJ/cm3
                                                  can cause the SC magnets to quench, i.e. changing their state from SC to normal conducting (NC), or in the extreme
                                                  case material damage that can be extremely costly.
                                                      In this article, we use the term aperture to define the normalised aperture at a generic location s along the LHC
                                                  circumference, Ax,y (s) and it is defined as the smallest transverse distance in the transverse x − y-plane between the
                                                  beam centre and the mechanical aperture, rx,y (s), expressed in units of the local transverse beam size, σx,y , as

                                                                                                       Ax,y (s) = rx,y (s)/σx,y (s) ,                                      (1)

                                                  where the beam size is modulated with the β-function as
                                                                                                        s
                                                                                                                      βx,y design
                                                                                                                            N
                                                                                                        σx,y (s) =                 .                                       (2)
                                                                                                                           γ

                                                  Note that here we include the design normalised geometrical emittance, design N     and γ is the relativistic factor. This
                                                  aperture is reduced by a number of imperfections and tolerances, for example, misalignment of magnets and vacuum
                                                  pipes, orbit errors within machine elements and off-energy offsets, to name a few. This normalised aperture is directly
                                                  connected to the risk of local beam losses that could potentially limit the LHC performance.
                                                     A detailed knowledge of the smallest aperture in the ring is very important for maximising the luminosity by
                                                  decreasing β ∗ , the β-function at the interaction points (IPs), to smaller values. At top-energy, as β ∗ is decreased, the
                                                  aperture of the inner triplet quadrupoles used for the final focus of the beams at the IPs decreases, as the local beam size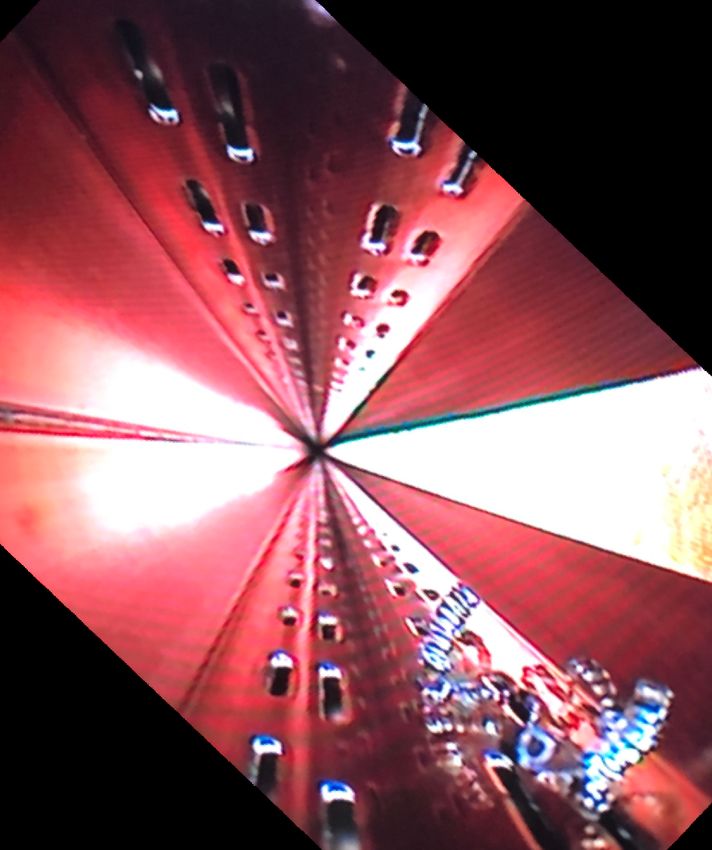
#### Page 2 of 21 Eur. Phys. J. Plus #####################
increases, and such a decrease is only allowed down to the level that can be protected by the collimation system. It is
typically the smallest aperture in the machine, known as the global aperture bottleneck, that determines the minimum
β ∗ reach, which is proportional to the peak luminosity. The LHC has eight Interaction Regions (IRs) of which four are
dedicated for the particle physics experiments ATLAS (IR1), ALICE (IR2), CMS (IR5) and LHCb (IR8). ATLAS and
CMS are the general-purpose, high-luminosity experiments, whereas ALICE and LHCb are specialised experiments,
operating at lower luminosity levels. In these IRs, the two counter-rotating LHC beams named as Beam 1 (B1, the
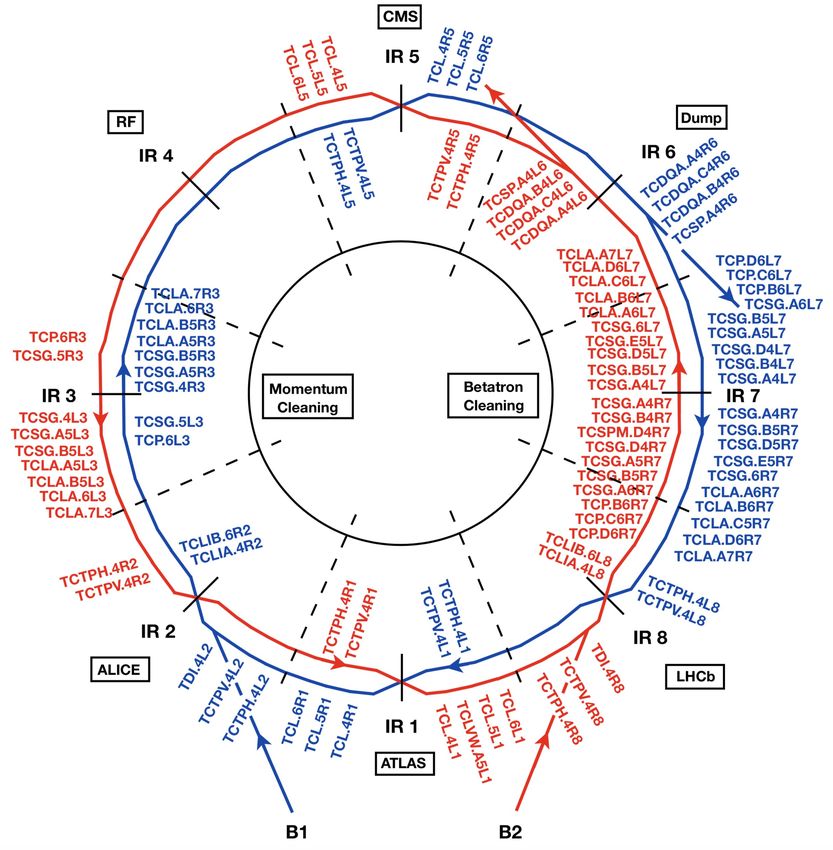
clockwise beam) and Beam 2 (B2, the counter-clockwise beam) collide. Fig. 1 shows the layout of the LHC collimation
system along with the trajectory of the beams; B1 in blue and B2 in red.
Fig. 1. 2018 LHC collimation system layout [2] in blue and red for B1 and B2, respectively. The names and locations of the
different IRs and particle physics experiments are also depicted.
In this paper, in order to refer to a certain quadrupole in relation to an IR, the name is composed of the number
identifying the position with respect to the IP, the side with respect to the IP, left (L) or right (R), and a number
defining the corresponding IR. Fig. 2 illustrates this convention for the case of the right side of IR5. In this figure the
layout until the dispersion suppressor is depicted in which the main quadrupoles (Q) and dipoles (MB) are indicated.
The final focus triplet magnets correspond to Q1R5, Q2R5 and Q3R5.
The settings of the LHC multi-stage collimation system [3, 4, 5, 6, 7, 8], designed to protect the LHC from normal
and abnormal losses, define the smallest normalised aperture that can be protected. The available aperture together
with the collimator settings impose limitations on the achievable β ∗ and thus on the luminosity reach [9, 10]. This
implies that detailed aperture knowledge and efficient beam-based techniques to probe the available aperture in the
machine are key elements to boost the collider’s performance, which is indeed the case for the LHC. In fact, together
with the optimisation of the settings of the collimation system and optics [10], the detailed knowledge of the LHC
aperture has allowed the β ∗ at the high-luminosity experiments to be decreased throughout Run 1 and Run 2 as
illustrated in Table 1. In 2018, the LHC operated with β ∗ = 25 cm in IR1/5 (as can be seen in Table 1), representing
a huge gain compared to the nominal LHC operational scenario with β ∗ = 55 cm, and even more with respect to the
initial LHC configuration from 2010 of β ∗ = 3.5 m. In Run 2, decreasing β ∗ has proven to be a very efficient way of
increasing the peak performance even in presence of limitations on the beam intensity.
The LHC multi-stage collimation system is organised in a well-defined transverse hierarchy, as illustrated in Fig 3,
with different collimator families where each individual device consists of two movable jaws with the beam passing
through the centre. Primary collimators (TCPs) made of carbon-fiber-composite (CFC) are the closest collimators to
the beams. After the TCPs, secondary collimators (TCSGs) made of CFC and active absorbers (TCLAs) made of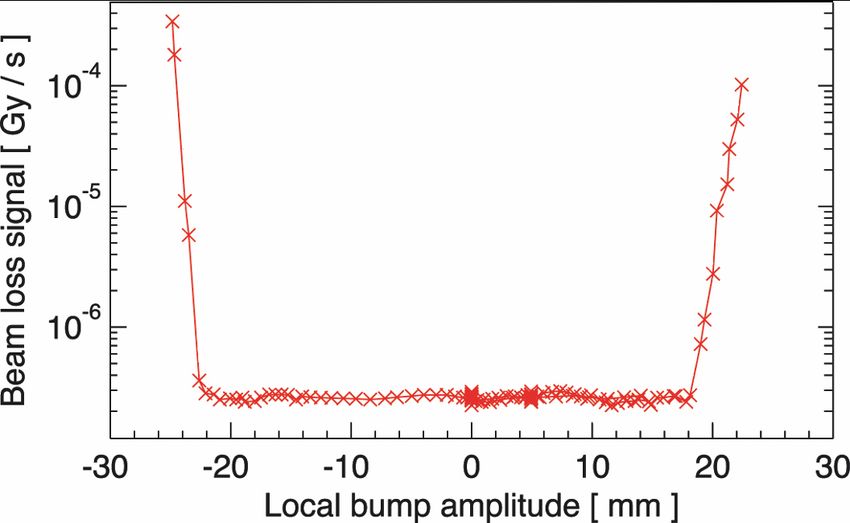
Eur. Phys. J. Plus #####################                                                                #### Page 3 of 21

Fig. 2. Schematic layout of an IP with main focusing (blue) and defocusing (red) quadrupoles and the dipoles (light blue) from
the IP to Q10 illustrating the naming convention used in this paper. Here illustrated for B2 to the right of IR5.

Table 1. Run 1 and Run 2 minimum β ∗ values reached in each LHC particle physics experiment IRs and beam energy per
year.
                                                                     Year
                                            2010     2011     2012    2015   2016    2017   2018
                             ∗
                           β IP1/5 [cm]      350    150-100    60      80     40      30     25
                           β ∗ IP2 [cm]      3.5      10       3       10     10      10     10
                           β ∗ IP8 [cm]      3.5       3       3        3      3       3      3
                           E [TeV]           3.5       4        4      6.5    6.5     6.5    6.5

Inermet-180 (heavy tungsten alloy) are placed to absorb particles out-scattered by the TCPs and TCSGs (secondary
and tertiary beam halo, respectively) as illustrated in Fig. 3.

Fig. 3. Sketch of the LHC multi-stage collimation system in IR7 and on the experimental IRs, where the different collimator
families are indicated. NC and SC apertures are depicted in red and blue, respectively [11].

    These collimators are located in two dedicated IRs in the LHC: IR7 for betatron cleaning and IR3 for off-momentum
cleaning (see Fig. 1). The tertiary collimators (TCTs) made of Inermet-180 are installed upstream of the particle
physics experiments in IR1, IR2, IR5 and IR8 (see Fig. 1). These collimators are there to absorb the tertiary betatron
beam halo and provide passive protection of the aperture bottlenecks in the triplet quadrupoles of the final focusing
system, as well as to keep a good control of the experimental backgrounds [12, 13]. Downstream of the experiments,
other collimators are installed to absorb the debris from the particle physics collisions (TCLs). Finally, two more CFC
collimators per beam (TCSP and TCDQ) are installed in the dump region (IR6) for beam-dump protection. These
collimators must ensure the protection of the machine in case of beam dump failures [14, 15, 9, 10]. All collimator
#### Page 4 of 21 Eur. Phys. J. Plus #####################
jaws are 1 m long, except for TCPs and TCDQ that are 60 cm and 9 m long, respectively. The detailed 2018 LHC
multi-stage collimation system layout is depicted in Fig. 1.
This paper is organised as follows. In Section 2, the methods used to estimate the beam aperture are described
in detail. In Section 3, all beam-based aperture measurement techniques developed for the LHC during Run 1 and
Run 2 are presented. In Section 4, a summary of the global aperture measurements performed in the LHC during
Run 1 and Run 2 at injection energy is presented, as well as a benchmark comparison study between the methods.
Additionally, local and global aperture measurements carried out at top-energy for β ∗ reach studies in the high-
luminosity experiments, ATLAS and CMS, performed during Run 1 and Run 2 are presented and compared with
expectations.
2 Aperture model
In circular particle accelerators, the concept of machine aperture goes beyond the simple definition of the cross-section
of the mechanical design of the beam pipes. It also depends on beam properties, errors (on beam or mechanical
properties), and on the machine configuration (optics choice, orbit settings, energy value, etc.). For evaluating the
aperture accurately, the following aspects must be taken into account: the transverse mechanical dimensions of the
machine components; the alignment errors of the machine elements; the beam orbit; the beam optics, which influence
the beam size; the magnetic-field errors, which affect the beam orbit and optics; and the collimator settings that
determine the size and population of beam halo. All these quantities define an aperture model that is refined by
measurements in order to calculate the global aperture bottleneck of the machine.
Two different models to estimate the apertures have been used in the LHC. The first one, called the n1 model [16,
17, 1], was used from the design phase of the LHC. It calculates the most limiting aperture using the realistic transverse
geometry and taking into account different possible errors that are added linearly, i.e. in a conservative way. The model
was updated at the end of Run 1 by adding realistic tolerances matching the measured apertures. A second model was
developed thanks to the improved accuracy of the beam-based aperture measurement techniques, based on the scaling
of the aperture measured in previous years and taking into account the optics and orbit parameters at the location of
the bottleneck. These two models are described in detail in this section.
2.1 The 2D LHC aperture model
The n1 aperture model, implemented in MAD-X and described in detail in Refs. [16, 17, 1], calculates the most
limiting aperture in the transverse 2D plane, through a numerical scan over different azimuthal angles considering a
real aperture geometry. Before performing the scan, the initial displacement of the beam centre is calculated as the
vector sum of the nominal closed orbit, the closed orbit deviation xco , the mechanical alignment tolerance ∆ba , the
beam-screen alignment ∆ba , the cold-bore alignment ∆cb , as well as an off-momentum component D̃δp . It should be
noted that the scan is performed over the azimuthal angle originating at xco , so as to catch possible restrictions in the
skew plane, and that the dispersion contribution D̃, multiplying the momentum offset δp at a given location s in the
ring, is given in each plane by s !
β(s)
D̃(s) = kβ |D(s)| + Darc farc , (3)
βarc
where kβ is the change of the beam size and dispersion due to β-beating, Darc is the peak dispersion in the arc, farc
is the fractional parasitic dispersion, and βarc is the optical β-function in a focusing arc quadrupole. The linear sum
of these errors is motivated by statistical considerations, i.e. given the large number of SC magnets (e.g. 1232 arc
dipoles), as it is not unlikely that somewhere all errors add coherently. After this calculation, the scan is started and
the beam extent is scaled until it reaches the physical aperture at some of the azimuthal angles. The resulting beam
extent is then normalised by the local beam size. At the LHC, the design value n = 3.5 µm is used to calculate the
beam size at a given location, in order to have comparable results, even if the real value of n can vary between fills.
This normalisation is motivated, as we will see later, by the fact that in the measurements the aperture is compared
to the opening of the jaws of a reference collimator, computed using the design n . In addition, the resulting beam size
value is multiplied by kβ to account for the change of the beam size due to the β-beating given as an input parameter
for the calculations.
During the LHC Run 1, several potential errors affecting the n1 model were found to be less restrictive than in
the worst-case scenarios assumed during the design phase of the LHC. This was the case for the orbit control, optics
correction, and the alignment of the machine elements, to name a few. Because of that, the tolerances for the n1
calculations had to be adjusted. Table 2 summarises the MAD-X aperture module input parameters used to calculate
the LHC aperture model at top-energy with squeezed beams, in the design phase and later based on the measurements
in operational conditions in 2012 for the proton run at 4 TeV [18].Eur. Phys. J. Plus ##################### #### Page 5 of 21
Table 2. Input parameters used to calculate the LHC ring aperture bottleneck in units of σ using the n1 model. Two sets of
input are presented: the design-phase LHC parameters, and those measured [19, 20] in operational conditions in 2012.
Parameter LHC LHC
design measured
Normalised emittance [µm] 3.75 3.5
Radial closed orbit excursion, xco [mm] 3 0.5
Momentum offset, δp 8.6×10⁻⁴ 2×10⁻⁴
β-beating fractional σ change, κβ 1.1 1.025
Relative parasitic dispersion, farc 0.27 0.1
At top-energy and with squeezed beams the bottleneck is expected, and was always measured in Run 1 and Run 2,
to be in the inner triplet quadrupoles in the high-luminosity experiments (IR1 and IR5), where the smallest β ∗ is
deployed for proton runs. In order to reduce the beam-beam interactions and maximise the luminosity and beam
stability, the LHC beams collide with an optimised crossing angle. The plane in which this angle is introduced is called
the crossing plane. The plane perpendicular to the crossing plane is called the separation plane, as in this plane the
beams have an offset until the separation bump is collapsed to bring the beams into collision. For large crossing angles,
the bottleneck was always found to be in the crossing plane; however, for reduced crossing angle values, the limiting
aperture in both the crossing and the separation planes are similar, as is illustrated in Fig. 4 (top and middle plots)
for the 2018 collision optics with β ∗ =25 cm and a half crossing angle of 145 µrad. The top and middle plots in Fig. 4
show the horizontal and vertical closed orbit in IR5 (left) and IR1 (right) with a beam envelope of 5 and 10 σ. The
mechanical aperture model and the machine layout are also depicted. The crossing angle is visible on the horizontal
closed orbit in IP1 and on the vertical closed orbit in IP5. The bottom plots of Fig. 4 show the resulting n1 aperture
model in units of σ for two different LHC optical configurations, 2018 (in green) and for the 2016 (in blue), in IR5
(left) and IR1 (right). The measured parameters from Table 2 have been used in this calculation. The bottleneck
location and corresponding aperture in units of σ are also indicated for each optics configuration. A smaller aperture
by 2 σ can be observed for the β ∗ =25 cm with respect to a β ∗ =40 cm. In Section 4 these calculations are compared
with the measured values.
2.2 Aperture-scaling model
The aperture-scaling model was developed in order to make fast predictions of the local aperture of the triplets in
the experimental IRs at different values of β ∗ and crossing angle, starting from a known aperture obtained through
beam-based measurements using any of the techniques described later. The immediate application was to evaluate the
β ∗ -reach due to the reduced aperture in the triplets [9].
In general, it is not possible to calculate the aperture for a given machine configuration using data acquired using
a different one (e.g. different optics, orbit etc.), since the location of the limiting aperture might move in both the
longitudinal and transverse planes. However, whenever the location is expected to stay unchanged, we can use simple
scaling laws to estimate the aperture for a different configuration: this turned to be a good approximation in the case
of the triplets [21].
The aperture-scaling method consists of using the measured aperture nm in units of local beam σ for a given optics
configuration with subscript m, as a starting point. For another configuration (denoted by subscript sc), the aperture
nsc can be computed by accounting for the change in the β-function and the orbit at the location of the bottleneck.
Since the physical aperture is identical in the two configurations, it must hold that
nm σum + |um | = nsc σusc + |usc | , (4)
where u is the transverse coordinate of the orbit in the limiting plane (we assume here that the bottleneck lies purely
in the horizontal or vertical
p plane and we use the absolute value of u in order to account for cases where the orbit
is negative), and σu ≈ βu n /γ is the local beam size in the u-plane at a small-dispersion location at high energy,
where βu is the local β-function, n the normalised transverse emittance, and γ the relativistic factor.
The ideal closed orbit u and β-function can be extracted from optics calculations in both configurations. To account
for the fact that the actual machine tolerances, we also include an additional orbit shift δu between the two studied
configurations, as well as β-beating factors λ. Solving Eq. (4) for nsc , and including the tolerances δu and λ, we obtain
s
|um | − |usc | − δu λm βum γsc
nsc = p + nm . (5)
βusc λsc n /γsc λsc βusc γm#### Page 6 of 21 Eur. Phys. J. Plus #####################
40 Aperture 40 Aperture
5 beam envelope 5 beam envelope
30 10 beam 30 10 beam envelope
20 20
10 IP5 10 IP1
x [mm]
x [mm]
0 0
10 10
20 20
30 30
40 6300 6400 6500 6600 6700 6800 6900 7000 40 19700 19800 19900 20000 20100 20200 20300
s [m] s [m]
40 Aperture 40 Aperture
5 beam envelope 5 beam envelope
30 10 beam envelope 30 10 beam envelope
20 20
10 IP5 10 IP1
y [mm]
y [mm]
0 0
10 10
20 20
30 30
40 6300 6400 6500 6600 6700 6800 6900 7000 40 19700 19800 19900 20000 20100 20200 20300
s [m] s [m]
60 60
* = 25 cm and crossing angle of 145 rad (2018 LHC) * = 25 cm and crossing angle of 145 rad (2018 LHC)
* = 40 cm and crossing angle of 150 rad (2016 LHC) * = 40 cm and crossing angle of 150 rad (2016 LHC)
50 50
40 40
A[ ]
A[ ]
30 30
20 20
10 10
MQXB.B2L5 MQXB.B2R5..13 MBXW.A4L1 MQXB.B2R1..16
11.27 8.55 11.23 9.0
0 6300 6400 6500 6600 6700 6800 6900 7000 0 19700 19800 19900 20000 20100 20200 20300
s [m] s [m]
Fig. 4. Horizontal (top) and vertical (middle) beam envelopes of 5 and 10 σ for the 2018 optics with a β ∗ of 25 cm and a half
crossing angle of 145 µrad, centred around the closed orbit, in IR5 (left) and IR1 (right). The geometrical aperture model is
also plotted, and the machine layout is depicted on the top of the plots with dipoles in light blue, focusing quadrupoles in blue,
defocusing quadrupoles in red, sextupoles in green and collimators in black. The bottom plots show an example of the aperture
calculated in units of σ with the n1 model for two different LHC optics configurations in IR5 (left) and IR1 (right) using the
measured parameters from Table 2. The aperture results are shown for the 2018 optics in green and for the 2016 optics in blue.
The bottleneck location and corresponding aperture are also indicated as well as a red dashed line at 10 σ for reference.
Experience has shown that the orbit tolerance δu can usually be omitted and that a ratio λm /λsc of a few percent
is reasonable, given the obtained level of optics correction in the LHC [22].
The method has been shown to provide reliable predictions of the local aperture bottleneck as long as the aperture
limit lies clearly in one of the two transverse planes, effectively making the aperture calculation 1D, and that there
are no major optics or orbit differences that could shift the location of the aperture bottleneck. It has been shown
to be both in excellent agreement with the n1 model if realistic tolerances are considered [23] and with beam-based
aperture measurements [10]. This method has the advantage of being very fast and removes some uncertainties in
the error tolerances, since it starts from the outcome of beam-based measurement with a precision higher than those
uncertainties, as will be illustrated in Sec. 4. Furthermore, it can be used to estimate the approximate aperture in a
configuration where a detailed optics does not yet exist, assuming that the β-functions at the bottleneck scale withEur. Phys. J. Plus ##################### #### Page 7 of 21
1/β ∗ . This model has been used in the LHC to estimate the β ∗ reach for fixed beam-beam separation configurations
and using achieved emittance values, allowing the performance of the machine to be pushed in order to deliver higher
peak luminosity for the physics experiments.
3 Beam-based aperture measurement techniques
The goal of the aperture measurements is to identify and quantify the real aperture restrictions in the machine for
both beams and both transverse planes, or to quantify the aperture at given locations (usually for sensitive elements).
The results can be used to optimise, whenever possible, the available clearance of the beams. Aperture measurements
are performed after having established the reference closed orbit and corrected the optics, and are used as input to
define the settings of the collimation system that should guarantee protection of the measured aperture.
In this section, we describe all beam-based methods for aperture measurements using movable collimator jaws that
have been developed during the operation of the LHC. These methods are generic and can be applied in other circular
accelerators. The different techniques are based on the general principle of generating losses with a safe beam, i.e. beam
conditions that are deemed non-dangerous for the ring integrity. These losses are measured by means of the beam loss
monitors (BLMs) [24, 25] placed all around the ring. Different analysis and reconstruction methods are performed,
depending on the method and type of aperture measurement (global or local), in order to derive the aperture at the
bottleneck location from these losses in units of σ.
3.1 Emittance blow-up with resonance crossing and collimator scans
In this method, the transverse beam emittance is blown-up in a given plane by crossing the corresponding 3rd order
resonance, causing beam losses that are detected by the BLMs around the ring. This method combines the beam
excitation technique with collimator scans (CS), in which the aperture is scanned with the movable collimator’s jaws.
The initial step is performed with all collimators opened enough to expose the global bottleneck, the reason why this
technique requires beams of very low intensity. In these conditions, the beam emittance is blown-up by approaching the
tune to the third-order resonance using trim quadrupoles, until beam losses are observed around the ring, so identifying
the global aperture bottleneck. The beam becomes so degraded after the tune change that it is not usable anymore,
and a fresh beam has to be injected. The blow-up is repeated while a reference collimator, typically a primary or a
tertiary collimator acting in the plane to be probed, is closed in steps of 0.5 σ until the aperture bottleneck is shadowed
by the collimator with beam losses recorded at the BLM closest to the reference collimator, as illustrated in Fig. 5.
The collimator used as reference has to be centred around the reference orbit before starting the scan. The collimator
opening at which the global loss location moves from the ring to the collimator is used as an estimate of the magnitude
ring
of the global aperture bottleneck. This CS provides the beam loss rates Rloss at the aperture bottleneck in the ring
Fig. 5. Illustration of the beam-based aperture-measurement technique combining beam blow-up and collimator scans (the
reference collimator is shown in black and the BLMs in green).#### Page 8 of 21 Eur. Phys. J. Plus #####################
coll
and at the reference collimator, Rloss for different values of the collimator half-gap A. Because of unavoidable intensity
variations during the measurements, the raw BLM data are normalised by the number of protons lost measured by
means of the beam current transformer (BCT). In addition, different BLM responses due to different optical functions,
different positioning of the BLMs, and different geometries and materials can cause significant variations between the
BLM signals recorded at different locations in the ring. Because of this, each BLM signal is normalised by the maximum
value obtained when the aperture bottleneck is fully exposed.
An example of the resulting normalised loss rate, R̃loss , as a function of the reference collimator half-gap is plotted
in Fig. 6. Equal signals at the quadrupole Q6R2, in this case identified as the global bottleneck, and at the reference
collimator are indicated with a dashed line. This is used to infer the interpolated aperture value of the bottleneck in
units of σ. It should be noted that all imperfections are naturally taken into account and a fully realistic on-momentum
aperture is obtained.
1.0
Normalized BLM signal
0.8
0.6 Q6R2
Reference collimator
0.4
0.2
0.010 11 12 13 14 15
A[ ]
Fig. 6. Normalised BLM signal measured at the reference collimator (red curve) and at the aperture bottleneck (blue curve)
as a function of the half-gap of the reference collimator. Equal aperture at the bottleneck and at the reference collimator is
indicated with a dashed line. This example corresponds to a measurement performed in 2017 for B1 in the horizontal plane
with the injection optics (450 GeV).
These measurements can be performed on-energy as well as for any specified off-momentum configuration. This
method is very powerful, although limited to injection conditions, as new beam needs to be injected after each tune-
change manipulation. Measurements at top-energy would require an energy ramp after each re-injection of the beam,
which becomes prohibitive in terms of time. Moreover, the tune change is a global manipulation that affects each
bunch in the beam. Therefore this approach prevents the selective use of individual bunches.
The accuracy of this measurement technique is given mainly by the collimator step size, which is typically chosen to
be 0.5 σ, and by the accuracy on the centring of the reference collimator around the reference orbit. Another possible
systematic uncertainty comes from the potential ambiguity in determining the beam loss level where the losses due to
the reference collimator opening and those at the bottleneck are equal. When these signals are at the same level, the
bottleneck and reference collimator are intercepting both the beam and the secondary halo. By moving the reference
collimator jaws a small step inwards, one can verify if the collimator is really touching the beam edge. Operational
experience in the LHC shows a distinct step change of the BLM signals when the beam is intercepted, which makes
this uncertainty small compared to the step size of the jaw movement used in the aperture measurements.
Note also that any β-beating at the collimator can also affect this measurement technique. If the nominal β-function
at the collimator is used to calculate its opening in σ, any deviation of the local optics for the theoretical one would
alter the real beam size and hence the estimated aperture. To avoid this, the collimator opening should be calculated
using the measured β-function value from previous optics measurements, which nevertheless also has an associated
measurement error. However, what usually matters for machine protection considerations is the relative opening of
the aperture bottleneck and of the collimator. This quantity is directly inferred from the measurements without the
need of further corrections.
This method was used in the LHC from 2010 to 2012 for global aperture measurements at injection energy
(450 GeV) [26, 19] and is applicable to any other circular accelerator equipped with collimators with movable jaws.Eur. Phys. J. Plus ##################### #### Page 9 of 21
3.2 Emittance blow-up with controlled white noise and collimator scan
This technique was developed with the main goal of better controlling the beam losses, so that the same beam can
be used for several subsequent excitations, making it possible to perform aperture measurements at top-energy in an
efficient manner. It combines a controlled emittance blow-up, achieved by means of a white-noise excitation generated
by the LHC transverse damper, with the CS used in the previously described method.
As the transverse damper excitation can be gated on individual or groups of bunches with a sufficient longitudinal
spacing, it is possible to selectively blow-up the emittance of individual bunches. This allows this method to be
efficiently used at top-energy, as each bunch in a train of bunches can be used to perform a different measurement,
eliminating the need to dump and re-inject the whole beam each time a new measurement is made. Primary collimators
are typically used as reference collimators for global aperture measurements, while tertiary collimators are used for
local aperture measurements at the triplet quadrupoles. This method was developed in 2012, to perform global aperture
measurements in the LHC at top-energy. Note that this method is applicable to other machines, but it depends on the
capabilities of the BLM system, as for the previous method, and of the transverse damper, the performance of which
has a quantitative connotation.
A further improvement with this method is that the CS can be performed in reverse, i.e. starting with the reference
collimator jaws in the innermost position with beam losses concentrated at its location. From an operational point of
view this is a much safer approach, since the ring aperture bottleneck is only exposed to losses in the very last step,
and hence for a shorter time period, thus minimising the potential risk of damage.
The ensuing analysis of the data collected and aperture interpolation is performed following the same procedure
as for the previous method, illustrated in Fig. 6.
The time required to perform these measurements was later reduced by automating the procedure. The transverse
damper can be set up to excite the beam continuously but mildly over an extended period of time, while the reference
collimator jaws can be programmed to open automatically in steps of 0.5 σ at a defined frequency. Once the aperture
bottleneck is exposed, the measurement is stopped. This is known as a semi-automatic aperture measurement. The
application of the method at top-energy using the TCTs as reference collimators is illustrated in Fig. 7. This shows
a measurement performed with B1 in the horizontal plane. The BLM signals at the magnet Q2L5 (red) and at the
horizontal TCT (blue) as well as the TCT full gap in mm (green) are depicted versus time. The TCT full gap of about
26 mm for which the losses at the TCT exceed the losses at the triplet corresponds to an aperture bottleneck of about
11.5 σ.
Fig. 7. Losses at the reference TCT and at the triplet magnet Q2L5 and TCT full gap in mm during a semi-automatic aperture
measurement at 4 TeV, with β ∗ = 60 cm. The transverse damper excitation lasted from 26 s to 80 s.
In practise, this method can also be applied to confirm the measurement results from a manual CS, which is first
used to identify the global aperture bottleneck in a controlled and safe way. Note that the frequency of the collimator
jaw movement has to be chosen low enough to allow for the recording of the BLM signal at each step, and that a
well-chosen combination of bunch intensity and transverse damper excitation is needed to produce losses large enough
to provide a sufficient signal during the whole measurement procedure.
In the same way as for the emittance growth by means of tune change, the measurement accuracy is given again
mainly by the step of the CS. Other contributions to the uncertainty are orbit shifts during the measurement (that#### Page 10 of 21 Eur. Phys. J. Plus #####################
can be monitored) and linear coupling between the two transverse planes. Thus, all high-order components must be
minimised, meaning that the filling scheme must be chosen to avoid collisions and all higher order magnets from
octupoles upwards must be switched off, with only sextupoles kept on in order to control chromaticity. Note that these
sources of uncertainty affect all the beam-based aperture methods described in this paper.
3.3 Emittance blow-up with controlled white noise and beam-based alignment
The emittance blow-up with controlled white noise technique can also be combined with a beam-based alignment
(BBA) [27] instead of the CS in order to further speed-up the measurements. The BBA method was used in the LHC
for the first time in 2015 [28]. In this approach all collimator jaws are retracted beyond the expected aperture bottleneck
and the beam is excited with the transverse damper such that the losses are observed at the global aperture bottleneck.
Once this is the case, it is the aperture bottleneck that then defines the beam envelope, which can be measured by
performing a beam-based alignment with the reference collimator. In this type of alignment, the collimator is closed
automatically and the movement is stopped by the alignment application [27] when the signal of the BLM at the
collimator exceeds a pre-defined threshold value. Once both collimator jaws have touched the beam, the normalised
collimator gap can be directly translated into the available aperture at the bottleneck without any further post-
processing. This method, known as a BBA measurement, is particularly suited for measurements in triplet magnets,
where the settings of the local TCT required for protection can be directly derived from the measurement, with a
resolution down to 0.1 σ.
As far as the possible sources of uncertainties are concerned, the beam edge may not be sharply defined and the
measurement results might depend on the pre-defined threshold value of the BLM signal. This risks an overshoot
of the collimator jaw position, meaning that the collimator jaw moves further in than the actual beam edge. As a
consequence, this would cause an underestimate of the available aperture. There is also a risk that the collimator
stops prematurely due to noise on the BLMs, but this can be easily managed by the control software. Nevertheless
the result should ideally be validated by a reduced CS. This implies performing an additional emittance blow-up at
the final collimator position, verifying that the losses are at the collimator, followed by a second blow-up after a small
step outwards of the collimator jaw, e.g. by 0.1-0.5 σ, to verify that the losses move back to the ring bottleneck.
3.4 Local orbit bumps
In order to perform local aperture measurements at a location other than that of the global bottleneck or to optimise
the available aperture by centring the closed orbit at an identified global bottleneck, closed-orbit bumps are used. The
closed-orbit bump is designed to have the maximum amplitude as close as possible to the location under study, as
depicted in Fig. 8. This is a classical approach to aperture measurements at the LHC, which is combined with CS.
Fig. 8. Sketch of the local closed-orbit bump method.
The bump amplitude is slowly increased in both the positive and negative directions, until the beam touches the
aperture and local losses are observed. This ensures a check in case of asymmetric apertures. Different bump shapes
can be used, but typically a 3- or 4-corrector bump is sufficient to identify local restrictions. The distance Aloc in mm
between the nominal beam centre and the aperture is the sum of the local bump amplitude Abump and of the beam
envelope N σ, with σ evaluated at the location of the bottleneck:
Aloc = N σ + Abump . (6)Eur. Phys. J. Plus ##################### #### Page 11 of 21
The amplitude Abump can be obtained from the expected closed-orbit value for the settings of the bump, or from
the measured orbit with the beam position monitors (BPMs). Of course, in case the BPM is not close enough to the
location considered by the aperture measurement, Abump should be reconstructed by using measured values at the
BPMs and the transfer matrices from the BPMs to the location of the aperture measurement. In order to reconstruct
the normalised aperture in units of the local beam size, Eq. (6) can be divided by σ.
As a prerequisite for these measurements, the normalised beam envelope N should be defined. To do that, a primary
collimator gap in the relevant plane is set at a pre-defined normalised value N , typically in the range 3–5 σ. At this
setting the beam is excited with the transverse damper until losses are observed. In this way the beam fills up the
full space between the collimator jaws, up to N σ, with σ taken at the primary collimator. The edge of this envelope
will then touch the aperture at a normalised amplitude N as the orbit bump is increased. Having a sharp edge to the
beam distribution makes it easier to detect the losses when the beam touches the aperture.
An example of the beam losses measured at the quadrupole Q4L6 as a function of the local orbit-bump amplitude
for B1 is shown in Fig. 9. Note that the beam losses for the two signs of the bump amplitude depend on the amount
of beam that is cut during the preceding measurements. Furthermore, in between each measurement, the normalised
envelope N has to be redefined using the TCP opening and the transverse damper excitation.
Fig. 9. Example of measured beam losses at the quadrupole Q4L6 for B1 versus the orbit bump amplitude (performed in
2010). Note that the beam losses for the two signs of the bump amplitude depend on the amount of beam that is cut during
the preceding measurements.
An intrinsic advantage of this technique is that possible asymmetries in the aperture shape can be identified by
performing measurements with both signs of the bump. This then gives the possibility to deploy a permanent orbit
bump to centre the beam at the bottleneck location and hence, gain aperture for machine operation.
An example of this approach is given through an issue that arose during the Run 2 operation, with fast (typically
of a few ms) beam losses happening in IR8 leading to 14 beam dumps, 3 of which caused a magnet quench. Energy-
deposition studies showed that the vertex of the hadronic showers generating the limiting BLM signals were most likely
situated within 1 m from the centre of the dipole MB.C15R8 [29]. In order to investigate the origin of these losses several
local aperture measurements were performed in that area, which revealed the presence of an Unidentified Lying Object
(ULO) (more details can be found in [30, 29]). A constant monitoring of the ULO position and orientation during
Run 2 was carried out by means of local aperture measurements, which were performed at every beam commissioning
at the beginning of each run. An example of the aperture scans performed in 2018 is shown in Fig. 10 (left). The
physical beam screen aperture is indicated by the black line. The black arrows follow the path of the beam centre from
various positions in the horizontal plane using local orbit bumps, while the nominal reference orbit at the moment of
the measurement is shown by the blue star. A clear aperture, i.e. no losses observed, is reported in green while the
measured edge of the ULO is shown by red boxes with dimensions defined by the measurement resolution.
A mitigation strategy was adopted in the LHC based on the deployment of a local orbit bump that allowed the
beam to stay sufficiently far away from the ULO, while ensuring at least 10 σ of available aperture at injection energy.
After the end of Run 2 an endoscopy revealed that the ULO was a twisted string of plastic a few cm in size, which was
stuck between the pumping slots of the beam screen and the cold bore (see Fig. 10, right). The ULO was successfully
removed.
In the LHC, this method was also used to investigate the triplet aperture in the experimental insertions to conclude
on the β ∗ reach. For this particular case, the method was combined with CS, using the TCTs as reference collimators#### Page 12 of 21 Eur. Phys. J. Plus #####################
Fig. 10. Left: Outcome of the 2018 ULO aperture scan. The beam screen is represented by the black line, the black arrows
indicate the displacement of the beam centre performed using local orbit bumps, the reference orbit at the moment of the
measurement is shown by the blue star, the clear aperture is reported in green while the measured edge of the ULO is shown
by the red boxes with dimensions defined by the measurement resolution. The machine reference frame is used, with the B2
entering in the plane of the plots. Right: picture taken during the first endoscopy carried out in April 2019. The top and bottom
flat parts of the beam screen with the pumping slots are clearly visible. The twisted material in the foreground of the lower-right
part of the picture is the ULO.
in order to keep the triplet quadrupoles protected as much as possible and minimise their exposure to beam losses.
With these collimators at their nominal settings additional crossing bumps were added on top of standard crossing
and separation schemes until the beam touched the reference TCTs. The collimator jaws were then retracted and the
bump amplitude increased in steps until the triplet aperture was exposed. This allowed the TCTs settings that protect
the triplet to be determined [31].
This method ensures triplet protection during the measurements as they remain in the shadow of the TCTs to
about 0.5 σ (TCT step size). On the other hand, the aperture results are expressed in terms of TCT retraction and
have a small dependence on the detailed shape of the bump used to perform the scan, which is affected by the kicks
generated by the transverse misalignment of quadrupoles or by the orbit correctors in between the TCTs and the
triplets. A good initial alignment of the TCTs is mandatory in order to have accurate results.
Although rather robust and widely used, a potential risk with the orbit-bump technique is to generate large losses
at the studied element if the steps of the orbit bump are too large. One way to mitigate this consists of using a variant
where the orbit bump is used only to displace the global bottleneck to the local element that should be studied. In
this way, one of the other techniques for a global aperture measurement can be used, e.g. the semi-automatic method
or the BBA method, where the losses induced by blowing-up the emittance using the transverse damper are much
better controlled. The aperture of the element under study is then given by the value obtained with the global aperture
measurement minus the amplitude of the local bump introduced. This variant also has the advantage of typically using
smaller orbit bumps, thus reducing the risk to run out of orbit corrector strength during the scan.
Finally, it is worth mentioning that as a consequence of some of the first results obtained using the orbit-bump
technique, it was decided to install additional BLMs in some IRs to increase the resolution of the method and investigate
in more detail certain aperture restrictions [32]. This stresses the importance of having a large quantity of BLM units
around the accelerator to accurately determine the location of aperture bottlenecks.
4 Measurement results
The detailed knowledge of LHC aperture bottlenecks achieved thanks to the improved accuracy of the aperture
measurements has been a key ingredient for the LHC performance in terms of both peak and integrated luminosity [10].
In 2018 the LHC was operated with β ∗ = 25 cm in the high-luminosity experiments, representing a huge gain compared
to the nominal LHC operational scenario with β ∗ =55 cm. Together with the improvement of the injected-beamEur. Phys. J. Plus ##################### #### Page 13 of 21
brightness, the dramatic reduction of β ∗ has been a major contribution to the excellent luminosity performance at the
end of Run 2, achieving a factor 2 higher peak luminosity than the LHC design.
4.1 Aperture measurements at injection energy (450 GeV)
Since 2010, global aperture measurements have been performed at the 450 GeV injection energy using the various
methods described in Section 3. Although not directly relevant for the LHC β ∗ -reach, the measurements were important
to ensure aperture protection by the collimation system, since the aperture is more critical at injection for most elements
due to the larger beam size, with the exception of the elements affected by the β ∗ -squeeze at top-energy.
Fig. 11 shows a summary of the measured global-aperture bottlenecks in the two beams and planes at injection
during Run 1 and Run 2. The aperture values depicted correspond to the maximum collimator jaw position opening
in the scan before exposing the ring aperture. The associated error bars are determined by the step used during the
collimator scan. Note that in 2010–2011 the tune-resonance emittance blow-up technique was used while since 2012
this has been performed using the controlled white noise excitation method. The observed differences over the years
are probably due to a combination of effects such as variations in closed orbit and changes in the optics correction.
The re-alignment of machine elements [33] could also explain some of the observed differences, however there is not
enough data from the survey measurements to pinpoint the possible sources. More details about the location of the
bottlenecks and methods used to perform the measurements are given in Appendix A.
16
Tune resonance blow-up Controlled white noise excitation B1H
+ coll. scan + coll. scan B1V
15 B2H
B2V
14
A[ ]
13
12
11
2010
2011
2012
2015
2016
2017
2018
Fig. 11. The measured global-aperture bottlenecks at injection (per beam and plane) during Run 1 and Run 2. All values are
given in units of beam σ, for n =3.5 µm.
In 2015, a comparative study was performed in order to verify the compatibility between the different methods
developed for aperture measurements at injection. In this test the methods compared were: the transverse damper
blow-up with CS; the transverse damper blow-up with BBA; the local orbit bump with CS. From these measurements
we could conclude that all methods confirmed the same aperture bottleneck locations. A summary of the results
obtained for both beams and both transverse planes is shown in Table. 3. Note that the aperture values measured
using the collimator-scan method are given by a range defined by the collimator jaw position in the scan before and
after exposing the ring aperture. This applies for the CS and the local orbit-bump methods. For the BBA method the
main error comes from the pre-defined BLM threshold at which the jaw stops that could make the measured aperture
smaller. Hence, the error depends on the exact distribution of beam halo close to the cut, which is not well known,
and which could change in different measurements, as well as the applied BLM threshold. It is also possible that, due
to noise on the BLMs, the collimator jaw stops prematurely, especially if a low BLM threshold is used. Due to the
origin of these uncertainties, it is not easy to associate a meaningful number for the uncertainty on this method. These
measurements should ideally be validated by a reduced CS combined with emittance blow-up, and the agreement with
the other methods can be seen in Table 3 where a summary of all the results obtained is presented.
Note that for B1 in the horizontal plane the global aperture bottleneck was found in a separation dipole in IR8,
however at this location it was not possible to create an appropriate orbit bump. Hence, the measurements could only
be performed with the transverse damper blow-up techniques. Moreover, for B2 in the vertical plane, the CS data was
corrupted, so the aperture was evaluated only with local measurements and the BBA method.
In conclusion, all methods agree well on the bottleneck location. The CS and local orbit bump methods agree
within their estimated associated error of 0.5 σ. Differences up to 0.9 σ are observed between the measured aperture
values in units of σ between the BBA method and the other two methods, which could originate from the pre-defined
BLM threshold and BLM signal noise.#### Page 14 of 21 Eur. Phys. J. Plus #####################
Table 3. 2015 measured values of global aperture bottleneck at injection energy, expressed in local beam σ with the underlying
assumption of a normalised reference emittance of 3.5 µm.
Beam Plane Bottleneck BBA CS Local orbit bump Local orbit bump
Positive sign Negative sign
B1 H MBRC.4R8 11.6 12.5-13.0 NA NA
B1 V Q6L4 12.1 11.5-12.0 12.5-13.0 14.5-15.0
B2 H Q4L6 12.5 12.8-13.3 13.0-13.5 13.5-14.0
B2 V Q4L6 12.0 NA 12.5-13.0 12.5-13.0
4.2 Aperture measurements for physics configuration
Before global aperture measurements were operational at top-energy towards the end of Run 1, the local orbit-bump
method was used in the LHC to investigate the β ∗ reach in the high-luminosity insertions (IR1 and IR5). The limiting
aperture bottleneck is expected to be in the triplets of IR1 and IR5 with squeezed beams for β ∗ smaller than 5 m,
or slightly higher if the machine imperfections are unfavourable. The first measurements performed in 2011 and 2012
allowed a change of β ∗ from 1.5 m to 1 m in IR1/5 [34], which could be further reduced to 0.6 m in 2012 thanks to tighter
collimator settings [9]. The beam-based aperture measurement technique exploiting controlled white noise emittance
blow-up, was developed in 2012 and since then it has become the standard method for aperture measurements at the
LHC.
A detailed summary of all aperture measurements performed for physics configuration with squeezed beams is
shown in Table 5 and Table 6 in Appendix B. Both the aperture bottleneck location and its value in units of σ are
compiled for both beams and both planes (for reference the optics configuration and beam energy are also listed). Note
that the aperture values are again given by a range defined by the collimator position in the scan, before and after
exposing the aperture. As can be seen in Table 6 the bottlenecks are always found in the triplet regions of IR1 or IR5
as expected. In most cases the same location remains the bottleneck for a given beam and plane. It should be noted
that when the bottleneck is indicated to be in Q3/D1 the highest loss in the measurement is found at the BLM labelled
as Q3 but is actually installed close to the interconnection between Q3 and D1 and is likely to be more affected by
showers from the upstream D1 than from losses within Q3 for the incoming beam. From theoretical aperture studies,
the bottleneck is also much more likely to be in the D1.
Fig. 12 shows the Run 1 and Run 2 aperture bottlenecks for the physics configuration from the n1 and the scaling
models, together with the measured values (only the minimum over the two beams and planes is depicted for each
optics configuration). Note that for the first aperture measurements at top-energy, performed in 2011, the scaling
method takes into account the smallest aperture measured at injection energy, which is not at the triplet quadrupoles
as their aperture is larger than the global injection bottleneck. Therefore the 15.6 σ is a pessimistic value. The aperture
values presented in Fig. 12 correspond to the collimator aperture before exposing the aperture of the bottleneck. The
real aperture will be between these values and these values plus 0.5 σ, corresponding to the step of the scan. Because
of this a 0.5 σ error has been associated to the aperture values in Fig. 12 only on the upper side of the values.
20
Scaling model
2D model 140
18
Measurements 120
16
100
[cm]
A[ ]
14
80
*
12 60
10 40
Run 1 Run 2
8 20
=-120 rad
=-120 rad
=-145 rad
=-145 rad
=-185 rad
=+150 rad
=+150 rad
=+160 rad
=+145 rad
E=3.5 TeV
E=3.5 TeV
E=6.5 TeV
E=6.5 TeV
E=6.5 TeV
E=6.5 TeV
E=6.5TeV
E=6.5TeV
E=4 TeV
2011
2011
2012
2015
2016
2017
2017
2018
2018
Fig. 12. Top-energy Run 1 and Run 2 aperture values calculated with the n1 and the scaling methods together with the
measured values (only the minimum over the two beams and planes shown). The energy, E, and crossing angle, φ, are indicated.Eur. Phys. J. Plus ##################### #### Page 15 of 21
As far as the n1 model is concerned, during the LHC Run 1, several potential sources of error were found to be
less serious than the design assumptions as explained in Section 2, and the tolerances for the n1 calculations had to
be adjusted as summarised in Table 2. The new tolerances based on measurements were used for aperture calculations
since 2012, explaining the different agreement between the n1 method and the measurement results when comparing
the first two points (about 2 σ) and the others (within 0.5-1 σ). Apart from these initial points we observe that the
predicted aperture using the scaling model is never further away than 0.5 σ from the measured aperture. These results
are consistent with the fact that the step size in the CS was 0.5 σ for most measurements. We therefore take this as
a guide to the uncertainty of the method. We consider this a very good agreement given the collimator step size and
the unavoidable small differences in orbit and optics corrections between years.
The aperture measurements reported in Fig. 12 are not trivial to compare directly, since they were carried out
under different machine configurations. In Fig. 13, the estimated aperture as a function of β ∗ is shown. Each curve
is calculated using the aperture-scaling method, but taking as input a different aperture measurement. All years in
Run 2 have been considered, as well as the Run 1 measurement from 2012. For all curves, the beam-beam separation
in units of beam σ is assumed constant at the 2018 value (10.6 σ for a normalised emittance n =1.9 µm), with the
crossing angle varying along the curves.
18
16
Aperture (σ)
14
12
10
Protected aperture + safety margin
8 Protected aperture
0.3 0.4 0.5 0.6 0.7 0.8
*
β (m)
2018 scaling, ϕ>0 2017 scaling, ϕ>0
2016 scaling, ϕ>0 2016 scaling, ϕ#### Page 16 of 21 Eur. Phys. J. Plus #####################
4.3 Reconstruction of physical apertures from physics configuration measurements
From the measured aperture at a given location, Ax,y (s), expressed in units of beam size, one can calculate the
corresponding aperture in m, as
Ax,y [m](s) = Ax,y [σ](s) × σx,y (s) + COx,y (s) , (7)
where σx,y is the horizontal or vertical beam size (in m) and COx,y the horizontal or vertical closed orbit (in m), at
the location where the aperture has been measured. Both the β-function, which is used to compute the beam size, and
closed orbit have been calculated using MAD-X for the corresponding optics configuration. The normalised nominal
emittance of 3.5 µm has also been used. Note that the triplet magnets are about 6 m long and, due to the change of
the β-function along their length, a variation of up to 4 mm on the resulting aperture A is expected between their
entrance and the exit. The BLM system allows us to identify the element where the losses occur, but as only a few
BLM monitors are attached to each magnet, it is not possible to accurately know the location of the loss inside the
magnet. For the calculations presented in this section, the optics parameters in the middle of to the magnet location
have been used. Furthermore, we have computed the uncertainty related to the variation of the optics parameters over
the magnet length as the difference between the extreme and mean aperture values inside the magnet.
Fig. 14 shows the aperture calculations for all bottleneck locations found in the crossing plane as from Table 6.
The different markers correspond to different magnets, and the different colours correspond to the different beams and
planes. The horizontal dashed line indicates the mechanical aperture of the Q3R5, Q2R5, Q3L1 and Q3R1 magnets in
the crossing plane, while the vertical line separates the measurements performed with negative and positive crossing
angle polarity in IP1. The error associated to each aperture value has been computed as the square root of the sum
of the squares of the measurement errors given by the step of the scan, the uncertainty on the loss position and
the measured β-beating. For the β-beating contribution the peak values have been used from Refs. [35, 36, 37]. For
some cases the β-beating peak value is not reported in these references, in such cases the β-beating peak has been
calculated as three times the β-beating RMS value. Note that the aperture measurement value used for the calculation
corresponds to the intermediate value between the collimator half-gap before and after exposing the bottleneck, which
gives an uncertainty of 0.25 σ, corresponding to the reference collimator half-step used in the scan.
As can be seen in Fig. 14, all calculated values are consistent with a slight loss in aperture compared to the
physical aperture except one point that lies at the limit. A maximum aperture loss of about 6 mm can be observed.
Furthermore, a slight aperture gain linked with the change of polarity of the vertical crossing angle in IR1 can be
observed, as was anticipated in Section 4. The Q2R5 magnet measurement (square purple point) which is at the limit
is made of two magnets named Q2R5.A and Q2R5.B, respectively (see Fig. 2) and the beam losses were observed at
BLM QI.02R5.B2I21 M QXB, which is located in the middle of the Q2R5.A magnet. For this particular case, the
variation of the β-function along the magnet means a change of aperture value from 0.031 m at the entrance of the
magnet (above the mechanical aperture) to 0.026 m at the end of the magnet (within the mechanical aperture). This
indicates that the restriction should be located towards the middle of the magnet, which is consistent with the location
of the BLM that measured the losses.
For some measurements listed in Table 6, the aperture bottleneck was found at an unexpected location, e.g. at the
IR1 triplet for a horizontal measurement, and at the IR5 triplet for a vertical measurement, i.e. in the separation plane.
Due to the presence of the crossing angle in the vertical (IP1) and horizontal (IP5), it is expected that the horizontal
bottlenecks are found in IR5, and the vertical ones in IR1. In addition the mechanical aperture in the non-crossing
plane is significantly larger. For these measurements, the aperture in m was also computed using Eq. (7), but the
calculated values result in an unrealistically small aperture, i.e. about 15 mm, which corresponds to about half of the
mechanical aperture. One possible explanation to this observation could be the transverse nonlinear coupling present
in the machine, which was unknown at the times of the measurements, and could turn a fraction of the excitation
amplitude in one plane into an offset in the other plane, which eventually reaches the bottleneck in the non-excitation
plane. The observed losses stopping the aperture measurement scan would then be in the non-excitation or skew
plane, preventing the aperture in the plane being measured from being fully probed. Further investigations are needed
to quantify the impact of the nonlinear coupling on the measurements and to better understand the cause of these
observations. More work will be devoted to this aspect during the LHC Run 3.
5 Conclusions
Aperture measurements in circular particle accelerators play an essential role for safe operation and to keep beam
losses under control, the latter being a mandatory condition in superconducting rings. At circular colliders, like the
LHC, reliable aperture measurements contribute to the boost of the performance in terms of peak luminosity. It should
be noted that the small β ∗ , the high-intensity, and the high-energy of the beams used, which are all key parameters to
increase the overall performance of the machine, define very powerful beams and even a tiny fraction of beam lossesYou can also read