Atmospheric conditions leading to an exceptional fatal flash flood in the Negev Desert, Israel
←
→
Page content transcription
If your browser does not render page correctly, please read the page content below
Nat. Hazards Earth Syst. Sci., 21, 1583–1597, 2021
https://doi.org/10.5194/nhess-21-1583-2021
© Author(s) 2021. This work is distributed under
the Creative Commons Attribution 4.0 License.
Atmospheric conditions leading to an exceptional
fatal flash flood in the Negev Desert, Israel
Uri Dayan1 , Itamar M. Lensky2 , Baruch Ziv3 , and Pavel Khain4
1 Department of Geography, The Hebrew University of Jerusalem, Jerusalem, 9070227, Israel
2 Department of Geography and Environment, Bar-Ilan University, Ramat-Gan, 5290002, Israel
3 Department of Natural Sciences, The Open University of Israel, Raanana, 4353701, Israel
4 Israel Meteorological Service, Beit Dagan, 5025001, Israel
Correspondence: Itamar Lensky (itamar.lensky@biu.ac.il) and Uri Dayan (msudayan@mscc.huji.ac.il)
Received: 31 March 2020 – Discussion started: 29 April 2020
Revised: 21 March 2021 – Accepted: 14 April 2021 – Published: 25 May 2021
Abstract. The study deals with an intense rainstorm that hit graphic and the other two were triggered by instability and
the Middle East between 24 and 27 April 2018 and took mesoscale cyclonic centres. The build-up of the instability
the lives of 13 people, 10 of them on 26 April during the is explained by a negative upper-level temperature anomaly
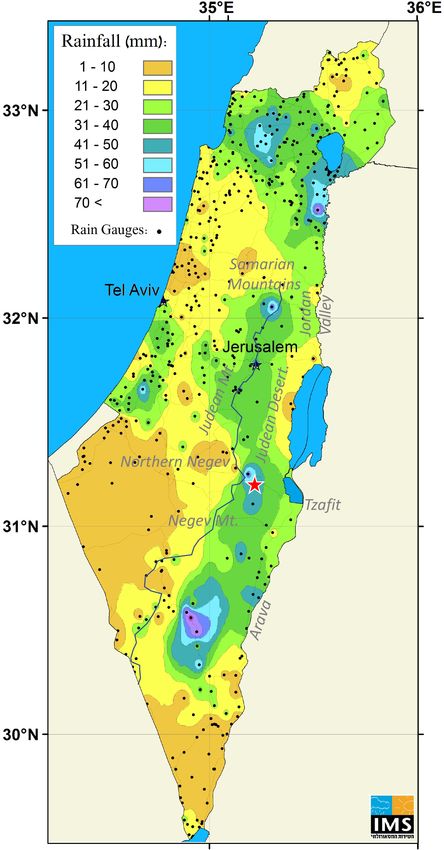
deadliest flash flood in Tzafit Basin (31.0◦ N, 35.3◦ E), the over the region caused by a northerly flow east of a block-
Negev Desert. The rainfall observed in the southern Negev ing high that dominated eastern Europe and ground warming
was comparable to the long-term annual rainfall there, with during several hours under clear skies.
intensities exceeding a 75-year return period. The timing of The intensity of this storm is attributed to an amplification
the storm, at the end of the rainy season when rain is rela- of a mid-latitude disturbance which produced a cut-off low
tively rare and spotty, raises the question of what the atmo- with its implied high relative vorticity, low upper-level tem-
spheric conditions were that made this rainstorm one of the peratures and slow progression. All these, combined with the
most severe late-spring storms. contribution of moisture supply, led to intense moist convec-
The synoptic background was an upper-level cut-off low tion that prevailed over the region for 3 successive days.
that formed south of a blocking high which developed over
eastern Europe. The cut-off low entered the Levant near
30◦ N latitude, slowed its movement from ∼ 10 to < 5 m s−1
and so extended the duration of the storm over the region. 1 Introduction
The dynamic potential of the cut-off low, as estimated by
its curvature vorticity, was the largest among the 12 late- On 26 April 2018 an extremely intense rainstorm hit Israel.
spring rainstorms that occurred during the last 33 years. The A total of 13 people were killed in this storm, 10 of them
lower levels were dominated by a cyclone centred over north- by a raging flash flood in the Tzafit Basin (31.0◦ N, 35.3◦ E),
western Saudi Arabia, producing north-westerly winds that north-east of the Negev Desert (denoted in Fig. 1). The rain-
advected moist air from the Mediterranean inland. During the fall depth during this storm exceeded 20 mm over most parts
approach of the storm, the atmosphere over Israel became un- of the country except the north-western Negev and the south-
stable, with instability indices reaching values favourable for ern tip of the Negev, over most of which the monthly long-
thunderstorms (e.g. CAPE > 1500 J kg−1 , LI = 4 K) and the term mean does not exceed 10 mm (Porat et al., 2018).
precipitable water reaching 30 mm. The latter is explained by Flash flood forecast and warning is a challenging task, in
lower-level moisture advection from the Mediterranean and particular over remote arid areas where meteorological radar
an additional contribution of mid-level moist air transport en- coverage is sparse. Though flash flood warning has much im-
tering the region from the east. Three major rain centres were proved in the last few decades, it is still the most weather-
active over Israel during 26 April, only one of them was oro- related fatal hazard globally (Montz and Gruntfest, 2002),
with 1075 fatalities between 1996 and 2014 in the United
Published by Copernicus Publications on behalf of the European Geosciences Union.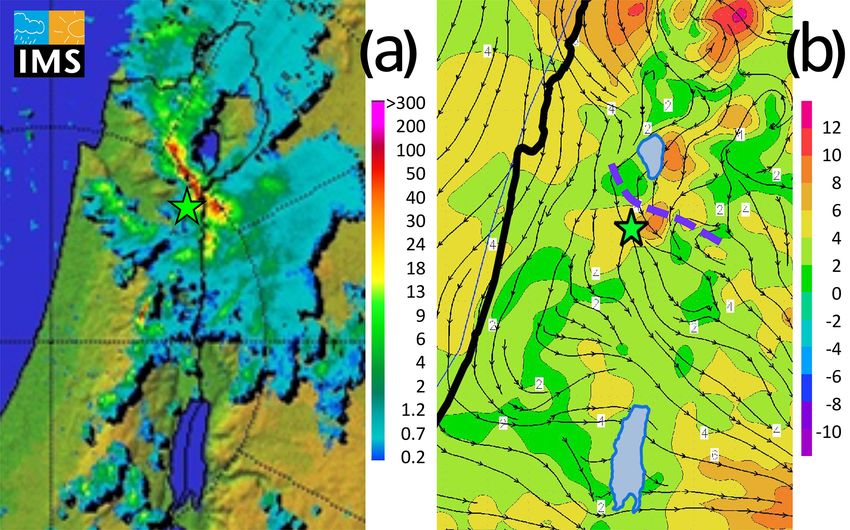
1584                U. Dayan et al.: Atmospheric conditions leading to an exceptional fatal flash flood in the Negev Desert

                                                                         central parts of the Negev Desert constitutes 4 %–9 % of the
                                                                         annual average (5–10 mm). In spite of these negligible rain
                                                                         amounts, the number of flash flood events cannot be ignored.
                                                                             The flood regime in the study region was analysed by
                                                                         Kahana (1999), based on 37 hydrometric stations operated
                                                                         by the Israeli Hydrological Service. He identified 59 “ma-
                                                                         jor floods” in which the recorded peak discharge reached
                                                                         the magnitude of a 5-year recurrence interval (for the pe-
                                                                         riod 1947–1994) at least in one watershed. A total of 14 %
                                                                         of these major floods occurred during the late spring.
                                                                             The main source of major floods in the late spring over the
                                                                         study region is the active “Red Sea trough” (ARST; Kahana
                                                                         et al., 2002). The RST is a low-pressure system extending
                                                                         from the south toward the eastern Mediterranean (EM) and
                                                                         the Levant (Ashbel, 1938; Kahana et al., 2002; Tsvieli and
                                                                         Zangvil, 2007). The ARST is most frequent during fall and
                                                                         spring (Sharon, 1978; Sharon and Kutiel, 1986; Dayan et al.,
                                                                         2001). The ARST is accompanied by a pronounced upper-
                                                                         level trough that develops over Egypt and, at times, initiates
                                                                         convective storms over the Levant. The secondary source of
                                                                         major floods is the Syrian Low – a derivative of the Cyprus
                                                                         Low. Syrian lows are Mediterranean mid-latitude cyclones
                                                                         that approach Syria and deepen in contrast to the normal con-
                                                                         ditions, in which Mediterranean cyclones tend to decay upon
                                                                         reaching Syria (Kahana et al., 2002). The implied winds over
                                                                         Israel during Syrian lows are north-westerly enriched with
                                                                         moisture originating from the Mediterranean that cross the
                                                                         Judean and the Negev mountains perpendicular to the terrain
                                                                         upslope, supporting orographic rains.
                                                                             The storm analysed here was associated with a Syrian Low
                                                                         accompanied by an upper-level closed cyclone, resembling
                                                                         the features of a “cut-off low” (as is shown in Sect. 3 be-
                                                                         low). A cut-off low is defined as a closed cyclone in the upper
Figure 1. Rainfall distribution over Israel for the period of 25 April   levels, overlapping with a potential vorticity (PV) maximum
06:00 UTC to 27 April 06:00 UTC 2018 from the IMS radar and              (e.g. Hoskins et al., 1985). Cut-off lows are considered to be
rain-gauge measurements based on the INCA system integration
                                                                         favourable for severe weather over the Mediterranean Basin
method (Haiden et al., 2011). The black line indicates the water
divide of the Samarian, Judean and Negev mountains.
                                                                         (Porcu et al., 2007). For instance, in southern Portugal cut-
                                                                         off lows were found to be a major source for heavy rainfall
                                                                         (Fragoso and Tildes Gomes, 2008). Porcu et al. (2007) iden-
                                                                         tified 273 cut-off lows over the entire Mediterranean Basin
States alone (Terti et al., 2017). A significant part of the flash       during the period 1992–2001. As for the Levant (30–35◦ N,
flood leading to fatalities is caused by an incorrect assess-            30–35◦ E), they found six cases (average of 0.6 yr−1 ) during
ment or misjudgement of the risks of these rapidly evolving              the months of April–September. Since the Levant is free of a
phenomena (Sharif et al., 2015; Becker et al., 2015; Diakakis            significant upper-level cyclonic system (and also of rain) dur-
et al., 2018).                                                           ing the summer months of June–September (Kushnir et al.,
   The study focuses on the Negev Desert and the Judean                  2017), this result reflects, actually, the events of April and
Desert (Fig. 1), hereafter referred to as the “study region”.            May.
The climatic regimes of the study region span from semi-                     This storm was severe in several aspects. One is the num-
arid in the north to arid in the centre and the south. The ma-           ber of fatalities, 13, which is record breaking for Israel.
jority of the annual precipitation in Israel is associated with              Second, the north-eastern part of the Negev Desert experi-
Mediterranean cyclones reaching its eastern part (i.e. Cyprus            enced rain intensities reaching a 75–100-year return period,
lows; HMSO 1962; Saaroni et al., 2010; Zappa et al., 2015).              resulting in discharge magnitudes of a 10–50-year return pe-
Two-thirds of the rainfall occur during December through                 riod (Rinat et al., 2020). The third aspect is the rainfall totals
February (Alpert et al., 2004; Ziv et al., 2006). During the             for the storm, which reached 40–50 mm over wide parts of
late spring (April and May), the rainfall over the northern and

Nat. Hazards Earth Syst. Sci., 21, 1583–1597, 2021                                       https://doi.org/10.5194/nhess-21-1583-2021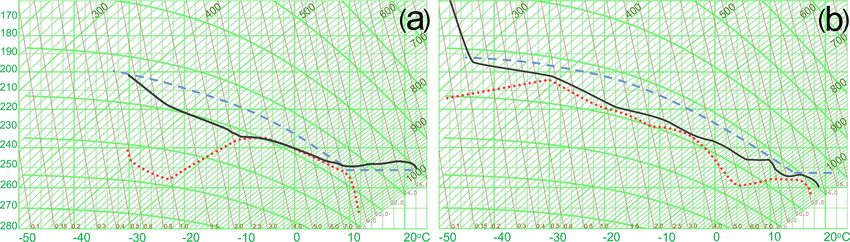
U. Dayan et al.: Atmospheric conditions leading to an exceptional fatal flash flood in the Negev Desert                      1585

the study region, i.e. 10 times the monthly long-term mean          ern Mediterranean domain (26–36◦ N, 25–39◦ E; Khain et
over the study region (Porat et al., 2018).                         al., 2021) with 2.8 × 2.8 km resolution. The model anal-
   The aim of this study is to analyse the storm in its sea-        yses are created by using a continuous assimilation of
sonal context and to identify the atmospheric conditions that       the radar and rain-gauge composite via latent heat nudg-
explain its severity. The article is organised as follows. In the   ing (Stephan et al., 2008, Khain et al., 2020). The bound-
next section, we present the data and methods used to anal-         ary and initial conditions are taken from the ECMWF In-
yse the event. Section 3 describes the event through observa-       tegrated Forecasting System (IFS) (https://www.ecmwf.int/
tional evidence. In Sect. 4 we discuss the unique conditions        en/forecasts/documentation-and-support, last access: 20 De-
that lead to the severe convection and the sources of mois-         cember 2020). The COSMO model is based on the prim-
ture for the rain formation in this storm. The main results are     itive thermo-hydrodynamic equations that describe non-
summarised in Sect. 5.                                              hydrostatic compressible flow in a moist atmosphere. Its ver-
                                                                    tical extension reaches 23.5 km (∼ 30 hPa) with 60 model
                                                                    levels, including 12 levels between the surface and 900 hPa
2   Data and methods                                                and 15 levels between 900 and 500 hPa, able to capture the
                                                                    planetary boundary layer (PBL) effects (Uzan et al., 2020).
The study area is Israel, with an emphasis given to the Negev          According to the quasi-geostrophic theory, the relative
Desert and the Judean Desert (Fig. 1). The study period, 24–        vorticity is a general measure for cyclone intensity and activ-
27 April 2018, corresponds to a storm that influenced the           ity (e.g. Holton, 1992). The curvature term dominates near
EM, in particular on 26 April when the Tzafit flood took            cyclone centres and within meandering flow, whereas the
place. This storm is one of 12 storms spread over 27 d (“refer-     shear term dominates near jets (Uccellini and Kocin, 1987).
ence storms”, hereafter), with the highest surface runoff ob-       In the cases analysed here, an upper-level cyclone was found
served over the study area in the late spring during 1986–          over the Levant or its proximity, accompanied by a south-
2018, based on the hydrometric stations of the Israeli Hydro-       ward shift and a weakening of the subtropical jet, and there-
logical Service.                                                    fore, the curvature vorticity was considered dominant.
   The rainfall data are based on the Israeli Meteorological           Following the above, the vorticity here is approximated by
Service (IMS) rain measuring network and radar data (Porat          a measure of curvature vorticity (MCV, hereafter), which is
et al., 2018). The spatial resolution of the radar is 250 m in      calculated on the periphery of the upper-level (500 hPa) cy-
the radial direction and 1◦ in the azimuthal. These data are        clones, based on the relation
rectified to 1×1 km grid, and its temporal resolution is 5 min.
The rain intensity was derived from the radar data (Marra and       ξc = V /R,                                                 (1)
Morin, 2015).
                                                                    where ξc is the curvature vorticity, V is the tangential wind
   The atmospheric processes responsible for flash-flood-
                                                                    speed, and R is the cyclone radius measured on the outermost
producing rainstorms combine synoptic and sub-synoptic
                                                                    closed isohypse (when derived with 15 m intervals). The tan-
scales (Bardossy and Filiz, 2005). This also holds specif-
                                                                    gential wind speed was calculated using the geostrophic re-
ically for severe convection during the spring over the
                                                                    lation, i.e.
Negev Desert (Dayan and Morin, 2006; Armon et al.,
2019). The data for the synoptic maps, including sea                V ∼
                                                                      = g · D/(R · f ),                                        (2)
level pressure (SLP) and upper-level fields and geopoten-
tial height (gph), were taken from the NCEP/NCAR (Na-               where g and f are the gravitational acceleration and coriolis
tional Center for Environmental Prediction/National Cen-            parameter, respectively, and D is the depth of the cyclone de-
ter for Atmospheric Research) reanalysis 1 database at              termined by the difference between its central height and that
2.5◦ × 2.5◦ spatial resolution (Kalnay et al., 1996; Kistler        of the outermost closed isohypse. Inserting V from Eq. (2) in
et al., 2001). The data for the mesoscale maps, includ-             Eq. (1) yields the following:
ing wind, relative and potential vorticity, temperature, and
relative humidity, are taken from ERA5 European Cen-                MCV = g · D/(R 2 · f ).                                    (3)
tre for Medium-Range Weather Forecasts (ECMWF) re-                  The stability indices were derived from the sounding data of
analysis database (C3S, 2017, https://cds.climate.copernicus.       Beit Dagan station, Israel (32.5◦ N, 34.8◦ E), retrieved from
eu/cdsapp#!/dataset/reanalysis-era5-pressure-levels, last ac-       the Department of Atmospheric Sciences, The University
cess: 6 July 2019) at 30 × 30 km resolution. SLP maps from          of Wyoming, at: http://weather.uwyo.edu/upperair/sounding.
the two databases for the pertinent region and period were          html (last access: 5 May 2019). These are the following:
compared for consistency and were found reasonably fit (not
shown).                                                               – Lifted index (LI; Galway 1956) is the temperature dif-
   For finer-resolution analysis we used the COSMO regional             ference between the environment and an air parcel lifted
model (http://www.cosmo-model.org, last access: 20 De-                  adiabatically from 2 m above the surface to 500 hPa.
cember 2020), operational at the IMS, covering the east-                Negative values indicate instability.

https://doi.org/10.5194/nhess-21-1583-2021                                 Nat. Hazards Earth Syst. Sci., 21, 1583–1597, 2021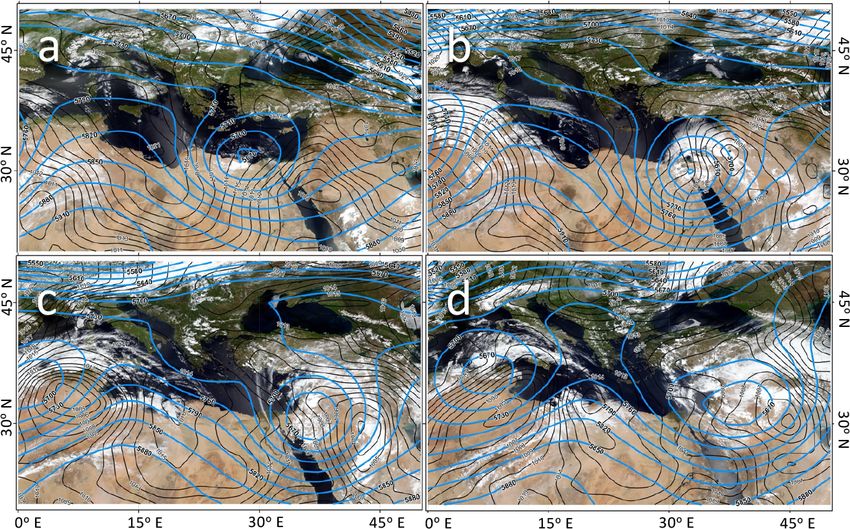
1586                U. Dayan et al.: Atmospheric conditions leading to an exceptional fatal flash flood in the Negev Desert

    – Showalter stability index (SI; Showalter, 1953) is simi-        Prior to the storm, on 24 April 2018, the lower levels were
      lar to the lifted index (LI) but uses a parcel lifted from   influenced by a RST. The axis of the RST was located east
      850 to 500 hPa. As for the LI, negative SI values indi-      of the Levant, enclosing a shallow cyclone with a central
      cate instability.                                            pressure of 1008 hPa over north-western Saudi Arabia (see
                                                                   Fig. 2a), transporting warm and dry air from the east toward
    – Convective available potential energy (CAPE; Mon-            the Levant. At the 500 hPa level, a closed cyclone was ap-
      crieff and Miller, 1976) is the integrated energy excess     proaching the region from the central Mediterranean. Dur-
      of an air parcel lifted adiabatically with respect to its    ing 25 April the upper-level cyclone slowed its progress,
      environmental temperature profile. Values in the order       from ∼ 9 to ∼ 4 m s−1 , while arriving to the Egyptian coast
      of hundreds of joules per kilogram (J kg−1 ) and more        (see Fig. 3). The surface shallow cyclone deepened, attain-
      correspond to severe weather.                                ing a central pressure of 1000 hPa, and moved northward,
Maps of the modified k-index (MKI) were derived from the           to Iraq, resembling the Syrian Low (Kahana et al., 2002).
ERA5 ECMWF data that cover the Earth on a 30 km grid.              The winds over the south-eastern Mediterranean backed to
The original k-index (KI; Geer 1996), which combines in-           north-westerly, hence advecting moist air from the Mediter-
stability and moisture availability, is used to predict severe     ranean inland, to central and southern Israel. The rain in Is-
thunderstorms in the United States. The modified version of        rael started on 25 April and stopped on 27 April (Porat et al.,
Haratz et al. (2010), MKI, is the version adapted for the east-    2018). The spatial distribution of the rain during the entire
ern Mediterranean:                                                 storm is shown in Fig. 1. The maximum rainfall occurred east
                                                                   of the water divide of the Negev Mountains, and the second
MKI = (T500 −T850 )·RH850,700 +Td850 −(T700 −Td700 ), (4)          most intense one was found in the Jordan Valley, 200 m b.s.l
                                                                   (below sea level).
where T and Td are temperature and dew point, respectively,           During the following day, 26 April, the upper-level cy-
RH is relative humidity, and the subscripts refer to the re-       clone continued its slow eastward progression (Figs. 2c and
spective pressure level (hPa). The modification gives more         3). The weakening of the horizontal pressure gradient at the
weight to the relative humidity at the 850 and 700 hPa levels.     surface on 27 April (compare Fig. 2c and d), in tandem with
   In addition, we also used precipitable water (PW; Liu,          a flattening of the 500 hPa cyclone and its movement further
1986), which is the depth of water in the atmospheric              eastward, led to the cessation of the stormy weather over Is-
column if all the water in that column were precipi-               rael.
tated as rain. The values were calculated from the sound-             The upper-level cyclone, besides its geopotential depth (up
ings of Beit Dagan. The METEOSAT Second Generation                 to 100 m; Fig. 2), was accompanied by an isolated PV max-
water vapour imageries were retrieved from EUMETSAT                imum, as seen in the 300 hPa map for 26 April 00:00 UTC
data centre (https://navigator.eumetsat.int/product/EO:EUM:        (Fig. 4), indicating its being a cut-off low (Hoskins et al.,
DAT:MSG:HRSEVIRI, last access: 1 June 2019) and were               1985). Moreover, its evolution took place south-east of an
used to represent main cloud patterns and mid-level mois-          upper-level blocking high that covered eastern Europe during
ture. The infrared (IR) channel was converted to brightness        24 and 25 April, as can be inferred from the PV distribution
temperatures (Lensky and Rosenfeld, 2008) and used for es-         seen in Fig. 5a–c. The interaction between the blocking high
timating the height of the cloud tops.                             and the cut-off low and its contribution to the slowing of the
   Air back trajectories for detecting moisture transport were     cut-off low when approaching the Levant are elaborated in
retrieved from the site of NOAA HYSPLIT model (Stein               Sect. 4 below.
et al., 2015, https://www.ready.noaa.gov/HYSPLIT.php, last            The synoptic-climatologic background for this storm is
access: 1 April 2019) Global Data Assimilation System              compared with the other rainstorms, comprising the set of 12
(GDAS; 1◦ × 1◦ resolution, on pressure levels), which is           “reference storms”, all of them occurring in the late spring
used by the NCEP Global Forecast System (GFS) model to             and producing considerable surface runoff over the study
place observations into a gridded model space for initialising     area (see Sect. 2 above). In all of the reference storms ex-
weather forecasts with observed data. The “model vertical          cept one, upper-level closed cyclones were found over the
velocity” (derived from the gridded data) option was used.         EM or the Levant. The cyclones’ depth varied between 10
                                                                   and 130 m, with an average of 52 m, and their radii ranged
                                                                   between 200 and 900 km, with an average of 600 km (Ta-
3     Observational analysis                                       ble 1). The MCV for the various days belonging to the ref-
                                                                   erence storms varied between 0.8 and 3.8 × 10⁵ s−1 , with an
3.1    Synoptic evolution
                                                                   average of 2.3 × 10⁵ s−1 . The maximum value was observed
During 25–27 April 2018 the Levant was dominated by an             during the present storm. The MCV for the present storm was
upper-level closed cyclone, accompanied by a lower-level cy-       approximately one-half that of the respective maximum rel-
clone, located east of Israel (see Fig. 2).                        ative vorticity (Fig. 3) presumably due to the spatial smooth-
                                                                   ing implied by the derivation method of the MCV.

Nat. Hazards Earth Syst. Sci., 21, 1583–1597, 2021                                https://doi.org/10.5194/nhess-21-1583-2021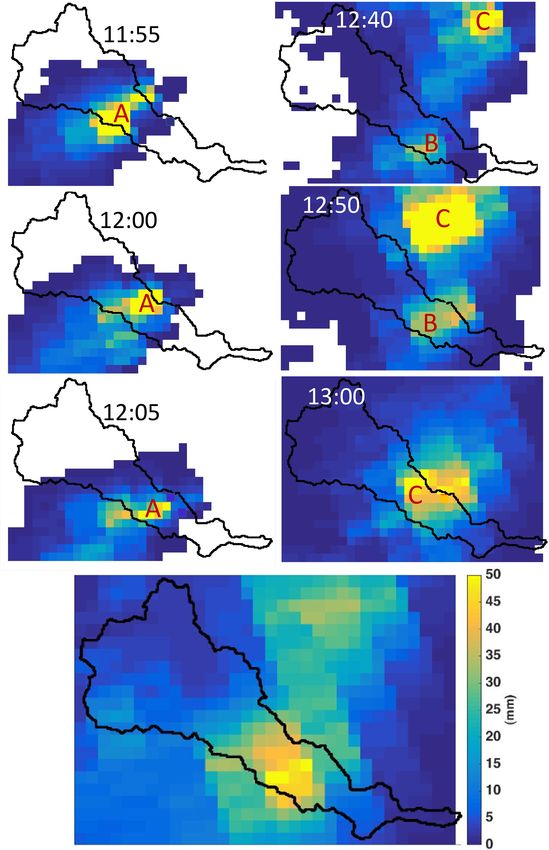
U. Dayan et al.: Atmospheric conditions leading to an exceptional fatal flash flood in the Negev Desert                              1587

Figure 2. Geopotential height (GPH) (blue lines) at 500 hPa (m) and SLP (hPa) (black lines) projected on MODIS imagery, in 24 h intervals,
for 24–27 April 2018 at 12:00 UTC (a–d).

Figure 3. Track of the upper-level cyclone (500 hPa GPH) during 24–27 April 2018 in 12 h intervals. The instantaneous speed (m s−1 ) and
distance (km) spanned during each increment are denoted by S and D, respectively. For each 24 h increment, the radius of the upper-level
low (km), the maximum relative vorticity (s−1 ), the precipitable water (PW, in mm) and three thermodynamic indices (LI, SI and CA) as
calculated from the sounding of Beit Dagan are specified. “High”, “Elevated” and “Low” values of the indices are highlighted in red, yellow
and green, respectively.

https://doi.org/10.5194/nhess-21-1583-2021                                     Nat. Hazards Earth Syst. Sci., 21, 1583–1597, 2021
1588 U. Dayan et al.: Atmospheric conditions leading to an exceptional fatal flash flood in the Negev Desert
Table 1. Depth, radius and the measure of curvature vorticity
(MCV) of the 500 hPa cyclones for the 27 d, in which the highest
surface runoff was observed over the study area in the late spring
during the period 1986–2018 (the reference storms). Note that in 24
of the days an upper-level cyclone was identified.
Storm Date GPH Radius MCV
no. depth (km) (×105 s−1 )
(m)
1 2 Apr 1986 70 650 2.3
1 3 Apr 1986 25 400 2.1
2 8 Apr 1986 45 650 1.4
2 9 Apr 1986 45 900 0.8
3 14 May 1997 no no
3 15 May 1997 no no
4 4 Apr 2001 130 900 2.2
5 30 Apr 2001 15 250 3.3
5 1 May 2001 25 350 2.8
5 2 May 2001 90 850 1.7
5 3 May 2001 90 750 2.2
6 12 May 2007 50 580 2.0
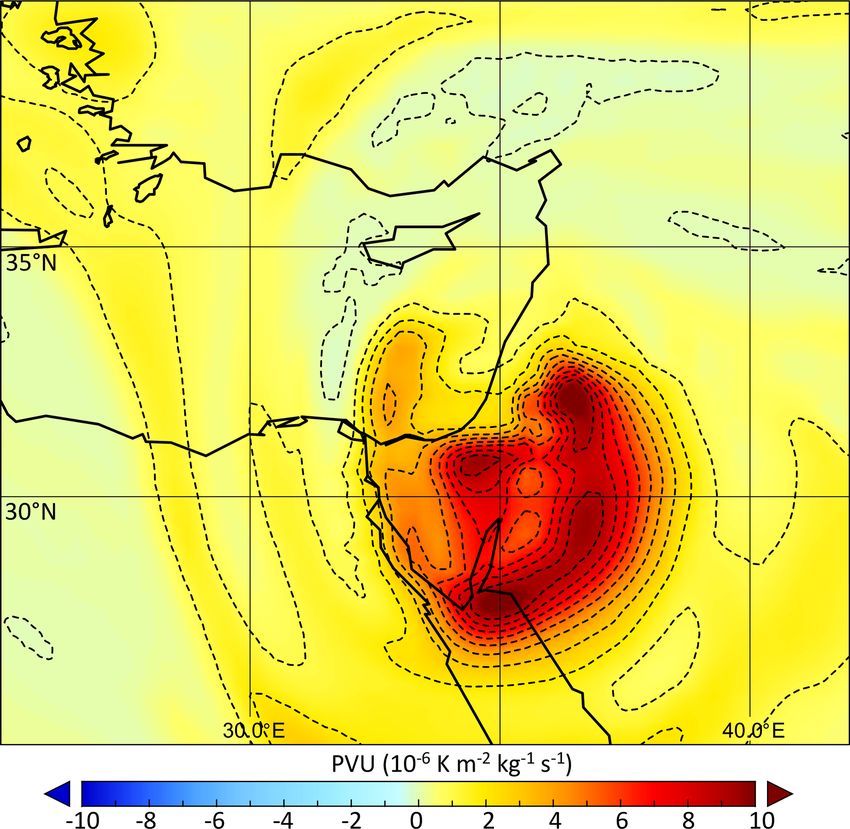
Figure 4. Potential vorticity units (PVU) at 300 hPa for 26 April 7 4 May 2011 70 900 1.2
00:00 UTC, taken from ERA-5 at 30 km spatial resolution. The 7 5 May 2011 20 280 3.5
major feature is a closed positive anomaly (with maximum of 8 7 May 2014 15 330 1.9
K m−2 kg−1 s−1 ), corresponding to a cut-off low centred over 8 8 May 2014 50 550 2.2
north-western Saudi Arabia. 9 11 May 2014 35 500 1.9
9 12 May 2014 10 200 3.4
10 16 Apr 2015 30 350 3.3
During the approach of the cut-off low, the atmosphere 11 10 Apr 2016 no no
over the study region became more and more unstable. Fig- 11 11 Apr 2016 45 550 2.0
ure 3 shows the values of leading instability indices (spec- 11 12 Apr 2016 50 650 1.6
11 13 Apr 2016 40 550 1.8
ified in Sect. 2) derived from Beit Dagan soundings in
11 14 Apr 2016 45 520 2.3
24 h increments. They reflect a gradual increase toward 25
12 25 Apr 2018 100 600 3.8
April 12:00 UTC when the upper-level cyclone approached 12 26 Apr 2018 80 550 3.6
the Sinai Peninsula. At that time, the value of CAPE was 12 27 Apr 2018 70 600 2.6
779 J kg−1 , of LI −4.9 K and of SI −2.7 K, indicating a po-
tential for thunderstorms. On 26 April, the CAPE rose to
909 J kg−1 .
The transition from the dry conditions that persisted on 24 3.2 The 26 April main rain episodes
April to the wet conditions that developed toward 25 April is
In the early morning of 26 April, the northern part of Israel
manifested by a sharp increase in the precipitable water (PW)
was the only one receiving rain, mostly moderate, originating
in Beit Dagan, from 17 mm (24 April 12:00 UTC) to 30 mm
from stratified cloudiness (based on hourly radar images, not
on 25 April 12:00 UTC (27 mm on 26 April). The moisture
shown). After several hours of fair weather, during the noon
increased presumably due to the north-westerly wind, as ev-
hours, three major rain centres developed. Figure 8 shows
idenced by the air trajectories entering the study area at the
the three centres as reflected by two observational means,
heights of 600 and 1000 m. The trajectory that entered the re-
i.e. satellite IR and radar imageries, and two diagnostic tools,
gion at 1400 m originated from Iraq, entered northern Israel
vorticity field at a 30 km resolution and MKI at a 2.8 km res-
from the east and, after turning cyclonically, penetrated the
olution.
Negev Desert from the north-west (Fig. 6). The signature of
The first rain centre, composed of several cells, was most
the segment of the latter trajectory, extending from Iraq to-
active between 09:00 and 10:30 UTC and produced the Tzafit
ward northern Israel, is clearly seen as a bright band in the
flood. This centre yielded up to 50 mm rainfall, with a max-
satellite imagery of the water vapour channel for 25 April
imum intensity of 180 mm h−1 based on 5 min averages of
21:00 UTC (12 h prior to Tzafit flood; Fig. 7), reflecting a
radar measurements. This intensity has a return period of
moisture strip.
> 75 years for that particular region (Rinat et al., 2020).
This centre can be noted in the radar image for 09:00 UTC
(Fig. 8c). Its evolution is represented by a series of radar im-
Nat. Hazards Earth Syst. Sci., 21, 1583–1597, 2021 https://doi.org/10.5194/nhess-21-1583-2021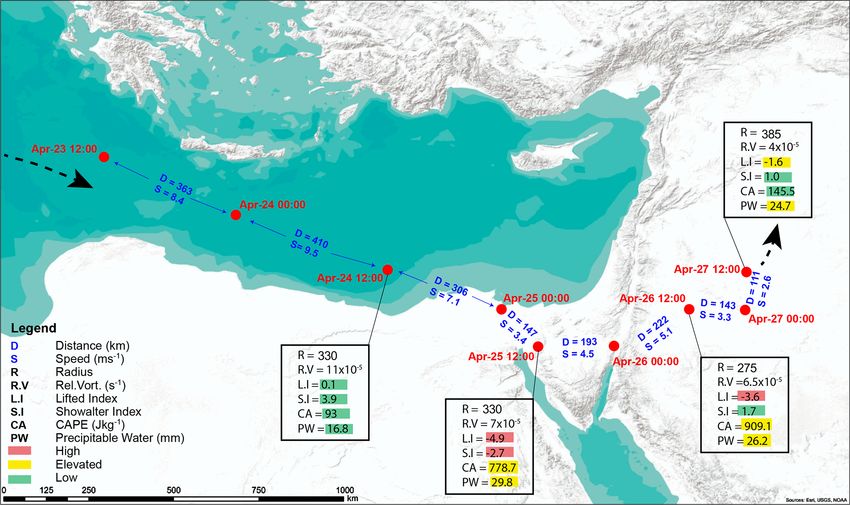
U. Dayan et al.: Atmospheric conditions leading to an exceptional fatal flash flood in the Negev Desert 1589
Figure 5. PV distribution at 300 hPa starting on 25 April 2018 at 12:00 UTC in 6 h intervals, covering Europe and the Mediterranean Basin,
on which a conceptual sketch of a dipole-type block (following Yamazaki and Itoh, 2013) is superposed. A cut-off low is seen over the
south-eastern Mediterranean and a blocking high over eastern Europe, forming a dipole. The arrows show the induced flow of each of the
vortices.
Figure 7. METEOSAT water vapour channel 6 (6.85–7.85 µm) im-
agery from 25 April 2018 21:00 UTC showing the cloud strip en-
tering Israel from the east and the vortex over the south-eastern
Mediterranean.
Figure 6. The 60 h back trajectory of the air mass reaching the
Tzafit Basin on 26 April 2018 at 10:00 UTC at heights of 600, 1000
and 1400 m a.g.l. (above ground level). This cell yielded rainfall of 30–45 mm with a maximum
of 72 mm (record breaking since start of record at 1943).
The maximal 10 min averaged rate was 116 mm h−1 , hav-
ages (Fig. 9) showing that it resulted from the passage of suc- ing a return period of 100 years (Porat et al., 2018). Dur-
cessive three rain cells that crossed the region from north to ing this rain episode, a lower-level trough extended toward
south with an average speed of 12 m s−1 . Figure 8e indicates the region from the south-east (i.e. Jordan; Fig. 10b). Its
the existence of a positive vorticity anomaly at the 500 hPa curved shape and orientation (denoted by a purple line) re-
level over the Dead Sea (denoted in blue, north-east of Tzafit) semble these of the cloud line. This system crossed the re-
with ∼ 50 km diameter at 09:00 UTC, implying that positive gion southward at an average speed of 7 m s−1 . The rain in
vorticity advection existed over Tzafit via the north-easterly Beit Shean can also be attributed to positive vorticity ad-
flow at that level. vection at the 500 hPa level caused by north-easterly winds
Later on, around 12:00 UTC, another rain centre devel- ahead of a pronounced core of a positive vorticity anomaly of
oped in the Jordan Valley (near the city of Beit Shean; > 2 × 10⁻⁴ s−1 and ∼ 100 km diameter, centred over west-
32.5◦ N, 35.5◦ E) in northern Israel, in the form of a cloud ern Jordan (32.3◦ N, 36.7◦ E). This core approached the re-
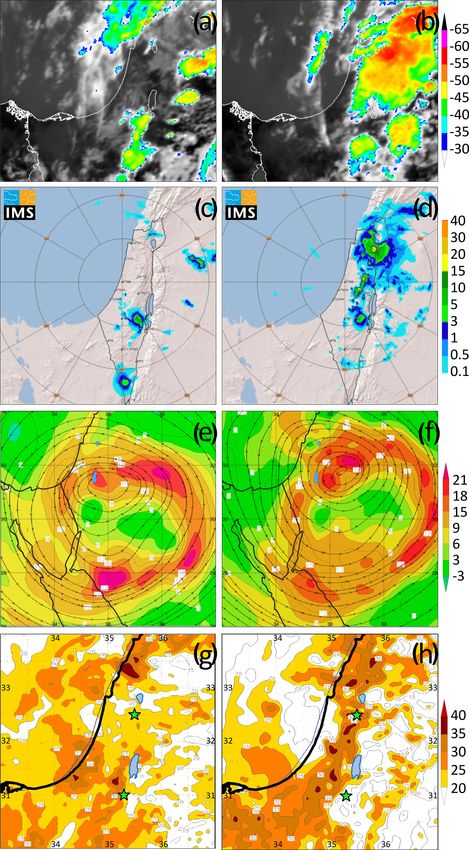
line, as reflected by the satellite and radar images (Fig. 10a). gion (red point in Fig. 8f) from the east and was one of the
https://doi.org/10.5194/nhess-21-1583-2021 Nat. Hazards Earth Syst. Sci., 21, 1583–1597, 2021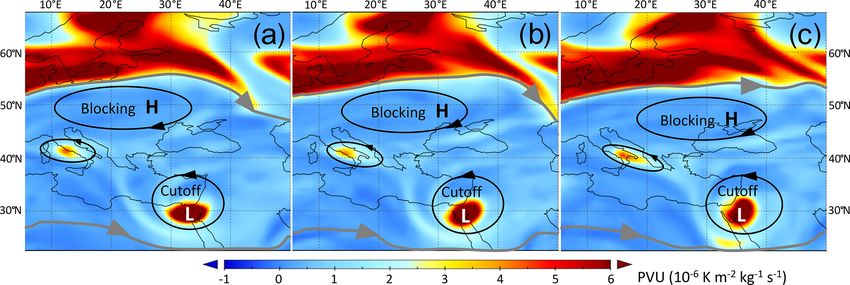
1590                U. Dayan et al.: Atmospheric conditions leading to an exceptional fatal flash flood in the Negev Desert

Figure 8. The 26 April imageries for 09:00 (a, c, e, g) and 12:00 UTC (b, d, f, h) corresponding to the major rain centres including
Meteosat Second Generation (MSG) IR images (a, b), 1 h forward integration radar (mm h−1 ) images (c, d), relative vorticity (s−1 × 10⁵ )
and streamlines at 500 hPa (e, f), and MKI (◦ C) (g, h). Panels (e) and (f) are based on ERA5 data at 30 km spatial resolution, and (g) and (h)
are based on the COSMO model at 2.8 km spatial resolution.
Nat. Hazards Earth Syst. Sci., 21, 1583–1597, 2021                                         https://doi.org/10.5194/nhess-21-1583-2021
U. Dayan et al.: Atmospheric conditions leading to an exceptional fatal flash flood in the Negev Desert                           1591

                                                                       the fine-resolution data of the COSMO model (described in
                                                                       Sect. 2). Each one includes the temperature, dew point and a
                                                                       line denoting the cooling of an air parcel that is lifted diabat-
                                                                       ically from the surface. Both reflect moist and conditionally
                                                                       unstable conditions. The lifted air parcel in both of them is
                                                                       warmer by ∼ 5 K than its surrounding temperatures within
                                                                       layers several kilometres wide. This implies that in both
                                                                       rain events the ascending air currents within the rain cells
                                                                       were subjected to intense buoyancy forces and, hence, had
                                                                       high vertical speeds. Accordingly, the CAPE and the MKI
                                                                       over their locations at the time of their occurrences exceeded
                                                                       1200 J kg−1 and 30 K (1740 in Beit Shean), respectively, val-
                                                                       ues that are favourable for thunderstorms. Moreover, the tops
                                                                       of clouds of the three precipitative centres reached −50 ◦ C.
                                                                       According to the temperature profiles over the study region
                                                                       during the storm, this implies that these cloud tops exceeded
                                                                       an elevation of 9000 m.

                                                                       4   Discussion

                                                                       Precipitation extremes in the Mediterranean Basin are usu-
                                                                       ally induced by large-scale atmospheric circulation, namely
                                                                       low-pressure systems with large pressure gradients (Jacobeit
                                                                       et al., 2017). Therefore, the analysis starts from the synoptic
                                                                       system with which this storm was associated, namely the up-
                                                                       per level cut-off low. This cut-off low entered the EM from
                                                                       the north-west, deepened and crossed the Levant at 30◦ N lat-
                                                                       itude (Figs. 2 and 3). The maximum vorticity measured in
                                                                       500 hPa level was > 7.2 × 10⁻⁵ s−1 which is comparable to
                                                                       the value of 5×10⁻⁵ s−1 at the same level found by Flocas et
                                                                       al. (2001) for the winter season in the Mediterranean. Appar-
Figure 9. (a). A series of radar images indicating the progres-
sion of rain cells (denoted A, B and C) that crossed the Tzafit        ently, this implies that the synoptic factor was dominant in
Basin (1 pixel is equivalent to 0.25 km2 ). The time notations refer   rain production. However, the convective nature of the rain
to the summer clock (LST; UTC + 3 h). The units are millimetres        and its spotty distribution were demonstrated by radar im-
per hour (mm h−1 ), based on the conversion method of Mara and         ages (Fig. 8c and d) and were even reflected in the rain map
Morin (2015). (b) Total rain amount accumulated between 11:40          of the entire storm (Fig. 1).
and 13:40 LST. Note the meridional orientation of the rainfall max-       Following the quasi-geostrophic approach, most convec-
imum, pointing at the “training effect” (with the courtesy of Yair     tive outbreaks occur in broad south-westerly flow aloft and
Rinat).                                                                ahead of an approaching trough (Doswell, 1987). On 26
                                                                       April, under the north-westerly flow behind the upper-level
                                                                       cyclonic system, its direct dynamic supporting effect on rain
two vorticity centres that constituted the synoptic-scale cut-         formation is expected to be weak, or even negative (Fig. 2c).
off low at 12:00 UTC (Fig. 2).                                         At this sector, negative upper-level vorticity advection and
   The third rain centre started to develop at 12:00 UTC and           lower-level cold advection are expected, both implying sub-
lasted ∼ 2 h. This centre was aligned with the water divide of         sidence in the mid-levels. Inspection of the lower-level tem-
the Samarian and Judean Mountains and its adjacent slopes              perature and wind fields (not shown) indicate that at that
facing the north-westerly winds (Fig. 8b and d), and there-            stage, the cold core associated with the upper-level cyclone
fore it can be considered to be forced by orography. This rain         was centred over the Negev Desert. The lower-level winds
centre yielded 30–35 mm with a 10 min averaged maximum                 over the study region were parallel to the isotherms so that
rate of 100 mm h−1 in Jerusalem, having a return period of             no temperature advection existed. A similar configuration ex-
100 years (Porat et al., 2018). In the late afternoon, southern        isted with respect to the upper-level vorticity field, implying
Israel was still under precipitative cloudiness (not shown).           that vorticity advection on the synoptic scale also did not take
   Vertical profiles for two major rain centres, in Tzafit             place there. Moreover, the omega field at the mid-levels in the
(Fig. 11a) and near Beit Shean (Fig. 11b), derived from                synoptic scale over the region was near zero. The above im-

https://doi.org/10.5194/nhess-21-1583-2021                                    Nat. Hazards Earth Syst. Sci., 21, 1583–1597, 2021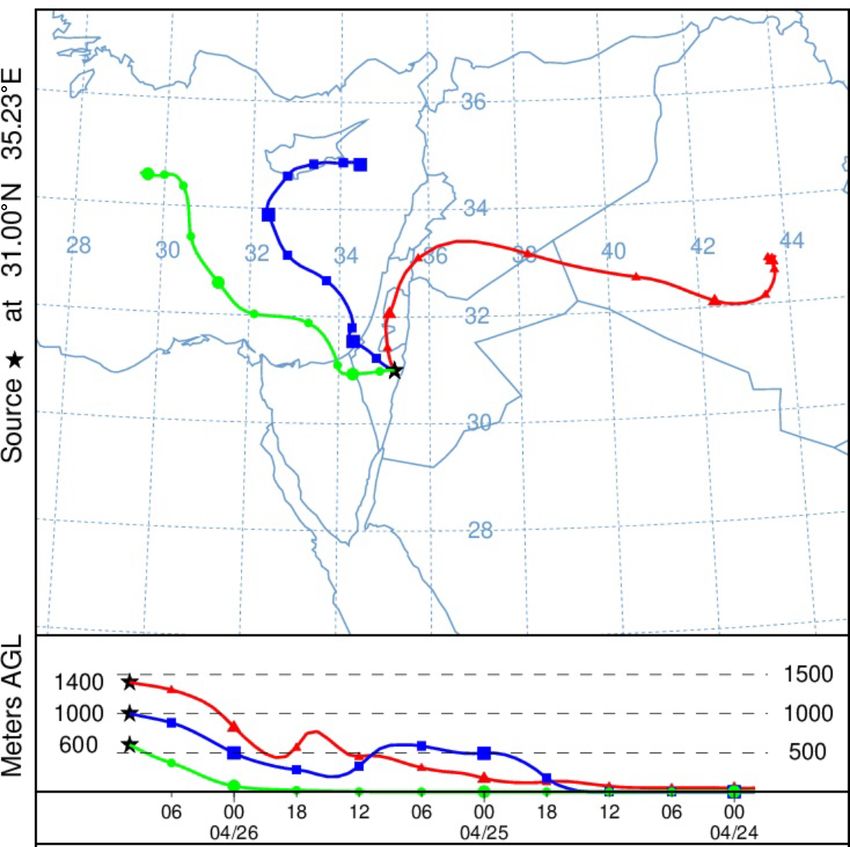
1592                U. Dayan et al.: Atmospheric conditions leading to an exceptional fatal flash flood in the Negev Desert

Figure 10. (a) Radar image (in mm h−1 units) indicating the precipitative element that crossed Beit Shean (Lake Kinneret, seen north-east of
it). Note that the maximum rain intensities reach 50 mm h−1 . (b) The 850 hPa streamlines and wind speed, with a purple curved line denoting
the trough line. Beit Shean is denoted by a green star in both parts. The radar image is from 12:20 UTC and the wind map from 12:00 UTC.

Figure 11. Vertical profiles for (a) Tzafit (26 April 2018 at 09:30 UTC) and (b) Beit Shean (26 April 2018 at 12:30 UTC). The black lines
denote temperature, the dotted red lines dew point and the dashed blue lines the adiabatic cooling of air parcels ascending from the surface.

plies that the synoptic-scale dynamics did not have a direct             ahead of a positive anomaly at the 500 hPa level in the ERA5
effect on the rain formation on that day.                                maps with 30 × 30 km resolution. The first anomaly was lo-
   The major synoptic factor that directly contributed to the            cated east of Tzafit at 09:00 UTC, prior to the rain there
rain formation in this storm is the wind. One implication                (Fig. 8e), and the other east of Beit Shean at 12:00 UTC
is the onshore moisture transport, accompanied by an up-                 when the rain system started its movement southward over
lift imparted by its encounter with the coastline and later              that region (Fig. 8f). The third mechanism was identified in
on with the mountain ridges. The other is the upper-level                the wind field of the COSMO data at the 925 hPa level in the
cold advection, leading to thermal instability, which is fur-            form of a lower-level trough (Sect. 3.2, Fig. 10b) with shape,
ther elaborated below. Actually, only a small fraction of the            orientation and progression velocity similar to these of the
rainfall in this storm was orographic (over the Judean Moun-             rain producing system (Fig. 10a).
tains), whereas the majority of the rain was observed far from              Despite the affinity of the Mediterranean cyclones to mid-
the coastline and beyond the water divides of the mountain               latitude cyclones due to the limited moisture sources in the
ridges (Fig. 1, note the divide line).                                   Mediterranean Basin (Ziv et al., 2010), the rain they produce
   The mesoscale analysis performed exposes several up-                  highly depends on moisture supply rather than on the pres-
lifting mechanisms not captured by the synoptic-scale data,              ence of conveyor belts or front. The lower-level system in the
which can explain the occurrence of the Tzafit and Beit                  storm analysed here can be considered a Syrian Low (Kahana
Shean major rain centres. Each of these two centres was                  et al., 2002; see Sect. 1 above), which belongs to the Mediter-
found to be associated with a positive vorticity advection               ranean cyclones. The Syrian Low resembles the “deep low to

Nat. Hazards Earth Syst. Sci., 21, 1583–1597, 2021                                        https://doi.org/10.5194/nhess-21-1583-2021
U. Dayan et al.: Atmospheric conditions leading to an exceptional fatal flash flood in the Negev Desert                       1593

the east”, which is one of the seven types of Cyprus lows de-            than that typifying the tops of the winter thunderclouds
fined by Alpert et al. (2004). Saaroni et al. (2010) showed              in Israel (Altaratz et al., 2001).
that most of the rain associated with the deep low to the east
is distributed over the coastal regions and the western slopes        c. For the convective rains observed over the Judean
of the Judean Mountains, facing the offshore north-westerly              Mountains during the noon hours, a central factor is
winds blowing from the Mediterranean. This indicates that                orography.
the Judean Mountains, extending up to 800–1000 m, block              d. The above three factors led to extreme and exceptional
effectively the moisture, which is presumably concentrated              instantaneous rain rates, exceeding a 75-year return pe-
in the lower levels. The heavy rains that were observed in-             riod in Tzafit and a 100-year return period in the other
land in this storm and the signature of non-orographic major            two major rain centres.
rain cells in the rain maps indicate that the moisture sources
were not limited to the lower levels. The presence of mois-           e. A significant contribution to the high rainfall in the
ture at the mid-levels is deduced from the back trajectory ar-           Tzafit Basin can be attributed to the propagation vec-
riving at Tzafit at the time when the flood occurred (Fig. 6).           tor (train effect), i.e. repeated areas of rain cells that
This shows a band of mid-level moist air that originated east            move over the same region in a relatively short period
of the Levant, turned cyclonically around the cyclone centre             of time, which may cause flash flooding (e.g. Cordifi et
and entered the region from the west.                                    al., 1996).
   In the EM, rains associated with Mediterranean cyclones,
as in the case studied here, are convective in nature. In the         f. An optional factor that may explain the repetitive forma-
winter season, cold air originating from southern Europe                 tion of rain cells north of Tzafit is a mountain–valley-
moves over the warmer Mediterranean water and becomes                    circulation (anabatic) uplift over the eastern slopes of
unstable before entering Israel (Shay-El and Alpert, 1991).              the ridge that extends from the Judean Mountains south-
In the late spring, Europe becomes warmer, whereas the                   ward (Fig. 1). This could be expected in light of the clear
Mediterranean remains cool due to its lagged response to the             skies prior to this event, but we did not find any signa-
annual cycle so that the passage of a Cyprus Low over the                ture in the output of the COSMO model.
EM does not necessarily lead to instability. In the case stud-       g. The high rainfall in Beit Shean can be partly explained
ied here, the instability can be attributed to a negative tem-          by the slow movement of the rain system, a speed of
perature anomaly at the upper levels (in the order of −4 K              7 m s−1 .
in 500 hPa, not shown) that covered the southern Levant as a
part of the cut-off low. A tendency of the rain in the Negev        Beyond the major direct contribution of the instability, mois-
Desert to be convective, especially in the transition seasons,      ture supply and topographic features to the evolution of the
has been noted previously. Sharon (1978) and Dayan and              major rain cells, the role of the synoptic factor, namely the
Sharon (1980) pointed at a gradual increase in the proportion       cut-off low, can be considered a supportive background for
of localised showers in the transition from the Mediterranean       these effects. The impact of cut-off lows on rainstorms over
part of Israel further into the more arid south. Systematic evi-    the Mediterranean has also been shown by Porcu et al. (2007)
dence for this tendency is well reflected in the low spatial cor-   and by Fragoso and Tildes Gomes, 2008 (Sect. 1). This is in
relation obtained among several rain stations for April over        line with the fact that 11 out of the 12 reference rainstorms
southern Israel (Kutiel, 1982).                                     that occurred over the study region in the late spring were
   The considerable rainfall in the three major rain centres        accompanied by upper-level closed cyclones.
described above can be explained by several factors:                   The slow eastward propagation of the cut-off low exac-
                                                                    erbated the severity of the storm by extending its duration.
  a. The first is the high degree of instability, originated by
                                                                    The typical translation speed of Mediterranean cyclones is
     the upper-level cold air, which was further enhanced
                                                                    5–10 m s−1 (Alpert and Ziv, 1989). The speed of the cut-
     by the intense solar radiation prior to the three rain
                                                                    off low was 7–9 m s−1 when moving along the Libyan coast
     events, as implied by the date, latitude and the clear
                                                                    but slowed down to 3–5 m s−1 when approaching the EM
     sky (Fig. 8a). This effect is reflected by the MKI maps
                                                                    (Fig. 3). The series of 300 hPa PV maps (Fig. 5a–c), on which
     (Fig. 8g and h) showing much higher values inland com-
                                                                    a conceptual sketch of a dipole type is superposed, consisting
     pared to these along the coastal region (35 ◦ C in Tzafit
                                                                    of a blocking high located north of the cut-off low, follows
     Basin compared to 13.2 ◦ C in Beit Dagan) and by a
                                                                    Yamazaki and Itoh (2013). These charts show a lobe of neg-
     gradual increase in CAPE during the morning hours (not
                                                                    ative PV (blue) over the Balkans, north of the cut-off low,
     shown), up to 1740 J kg−1 in Beit Shean. This factor can
                                                                    lingering over the Nile Delta. The power of PV maps stems
     explain the extreme rain intensities observed in the three
                                                                    from the feature of PV anomalies (in the spatial sense) to in-
     major rain centres.
                                                                    duce circular flow out of their boundaries, i.e. cyclonic for
  b. The high elevation of the cloud tops in the three major        positive and anticyclonic for negative. The negative anomaly
     rain centres, exceeding 9000 m a.s.l., is 2500 m higher        centred over eastern Europe exerted an anticyclonic flow over

https://doi.org/10.5194/nhess-21-1583-2021                                Nat. Hazards Earth Syst. Sci., 21, 1583–1597, 2021
1594 U. Dayan et al.: Atmospheric conditions leading to an exceptional fatal flash flood in the Negev Desert
the region, which produced easterly winds south of it, includ- instability can explain the severe rain showers over Israel ob-
ing the Levant, where the positive anomaly (with which the served during 26 April.
cut-off low was associated) was located. At the same time, The present study raises several questions for further re-
the positive anomaly over the southern Levant exerted a cy- search. One of them concerns the involvement of closed
clonic flow around it, including easterly winds over eastern upper-level cyclones as a major factor for severe rainstorms
Europe, where the negative anomaly was positioned. This is over the Negev Desert in the late spring. The spring season
most clearly demonstrated in Fig. 5c. The outcome of the in the Mediterranean is characterised by a general weaken-
superposed effects is that both anomalies were subjected to ing and reduced frequency of Cyprus lows. Moreover, the
forces acting against the mid-latitude westerlies. This ex- late spring is the time at which the descending branch of
plains the slow progression of the cut-off low upon reaching the Hadley cell takes over the Mediterranean. In light of the
the Levant. above, the specific conditions that lead to the intensification
of Rossby waves that lead to their breaking into closed cy-
clones should be investigated.
The most intense showers associated with the storm stud-
5 Summary ied here were observed when the study region was situated
west of the upper-level cyclone where negative vorticity ad-
An intense rainstorm hit the Middle East between 24 and vection is expected. Similar situations were noted by Kahana
27 April 2018, producing heavy flash floods in Israel that et al. (2002) in the framework of the Syrian Low, which has
claimed the lives of 13 people. A total of 10 of them lost their produced major floods in the Negev Desert. A similar situa-
lives on 26 April in a flash flood that resulted from rain show- tion was analysed by Morin et al. (2007), which resulted in a
ers with intensities of > 75-year return period. The study de- fatal flood in Israel between 31 March and 1 April 2006.
scribes the major rain systems affecting Israel on that day Rain production in convective storms requires the coherent
and analyses the atmospheric processes leading to their for- action of many processes acting over broad ranges of space
mation. The dominating synoptic feature was a cyclone at all and timescales. In order to provide an adequate description
levels that crossed Israel on its way eastward. The rain distri- of the factors involved and to get warnings for potential flash
bution for the entire storm was not evenly distributed. Three floods, such as the one that occurred in Tzafit, there is a need
major rain centres were active during 26 April. One, which to identify key mechanisms that can only be identified by
caused the fatal flood, developed over relatively flat terrain, state-of-the-art regional models, such as the COSMO model
the second developed upslope of the mountains, i.e. oro- used here.
graphic, and the third formed in the Jordan Valley. The syn-
optic factor supplied the background for the rainstorm, and
the mesoscale features determined the locations and times of Data availability. ERA5 ECMWF reanalysis data have been down-
the major rain events. loaded from the Copernicus Climate Data Store (https://cds.
The synoptic background of the storm was an upper-level climate.copernicus.eu, last access: 25 December 2019) (Coperni-
cut-off low that originated in southern Europe and slowed its cus, 2019). Meteosat Second Generation water vapour imageries
were retrieved from EUMETSAT data centre (https://navigator.
movement while approaching the Levant. This cut-off low
eumetsat.int/product/EO:EUM:DAT:MSG:HRSEVIRI, last access:
was found to have the highest vorticity with respect to the set
1 June 2019) (Kerkmann, 2019). Air back trajectories for detect-
of 12 reference storms observed over the study region in the ing moisture transport were retrieved from the site of the NOAA
late spring during the last 33 years. The lower levels were HYSPLIT model (https://www.ready.noaa.gov/HYSPLIT.php, last
dominated by a cyclone centred east of Israel. The implied access: 1 April 2019) (Rolph et al., 2017).
winds were north-westerly, hence advecting moist air from
the Mediterranean inland. During the approach of the upper-
level cyclone, the atmosphere over the study region became Author contributions. UD conceived the study, set the goals of the
conditionally unstable, with instability indices reaching val- article and developed its methodology. IML selected and analysed
ues indicating the potential for thunderstorms. At the same the data sources. BZ was engaged in the dynamic aspects of the
time, the precipitable water increased by a factor of 2 over study and their issuing calculations. PK performed the numerical
the study region, which triggered deep moist convection from simulation with IMS-COSMO model. All the authors contributed
25 April onward. The mesoscale distribution of MKI (mod- to the interpretation of the results and to writing the manuscript.
ified k-index) indicated that the instability was considerably
higher inland than along the coastal plain. This may explain
Competing interests. The authors declare that they have no conflict
why most of the rain was observed there. In addition to the
of interest.
lower-level moisture advection, a mid-level band of moist air,
extending from Iraq westward, curved cyclonically through
Syria and the EM and entered southern Israel from the north-
west. The combination of both moisture contributions and
Nat. Hazards Earth Syst. Sci., 21, 1583–1597, 2021 https://doi.org/10.5194/nhess-21-1583-2021U. Dayan et al.: Atmospheric conditions leading to an exceptional fatal flash flood in the Negev Desert 1595
Acknowledgements. The authors wish to thank Efrat Morin and Corfidi, S. F., Merritt, J. H., and Fritsch, J. M.: Predicting the move-
Yair Rinat from HUJI for the hydrometric data and the radar im- ment of mesoscale convective complexes, Weather Forecast., 11,
ages. We are grateful to Noam Halfon and Yoav Levi from the 41–46, 1996.
Israel Meteorological Service (IMS) for providing the IMS C- Dayan, U. and Morin, E.: Flash Flood-Producing rainstorms
band Doppler radar imagery and the integrated rain maps and to over the Dead Sea, Israel: A Review, in: New Frontiers in
Elyakom Vadislavsky for the MSG IR images and for his assis- Dead Sea paleo-environmental research, edited by: Enzel, Y.,
tance and scientific inputs while running the IMS-COSMO model Agnon, A., and Stein, M., Geol. S. Am. S., 401, 53–62,
and to Michal Kidron and Guy Keren from HUJI for their help in https://doi.org/10.1130/2006.2401(04), 2006.
the preparation of the figures. Baruch Ziv thanks the Israeli Sci- Dayan, U. and Sharon, D.: Meteorological Parameters for Discrim-
ence Foundation (ISF; grant no. 1123/17). We also wish to express inating Between Widespread and Spotty Storms in the Negev,
our gratitude to the three anonymous referees for their most help- Israel J. Earth Sci., 29, 253–256, 1980.
ful comments and constructive suggestions which led to substantial Dayan, U., Ziv, B., Margalit, A., Morin, E., and Sharon, D.: A se-
improvements of the paper. vere autumn storm over the middle-east: synoptic and meso-scale
convection analysis, Theor. Appl. Climatol., 69, 103–122, 2001.
Diakakis, M., Priskos, G. and Skordoulis, M.: Public perception of
Financial support. This research has been supported by the Israel flood risk in flash flood prone areas of Eastern Mediterranean:
Science Foundation (grant no. 1123/17). the case of Attica Region in Greece, Int. J. Disast. Risk Re., 28,
404–413, https://doi.org/10.1016/j.ijdrr.2018.03.018, 2018.
Doswell, C.: The Distinction between Large-Scale and Mesoscale
Review statement. This paper was edited by Joaquim G. Pinto and Contribution to Severe Convection: A Case Study Exam-
reviewed by three anonymous referees. ple, Weather Forecast., 2, 3–16, https://doi.org/10.1175/1520-
0434(1987)0022.0.CO;2, 1987.
Flocas, H. A., Maheras, M. P., Karacostas, T. S., Patrikas, I., and
Anagnostopoulos, C.: A 40 year climatological study of relative
vorticity distribution over the Mediterranean, Int. J. Climatol.,
21, 1759–1778, https://doi.org/10.1002/joc.705, 2001.
References Fragoso, M., Tildes Gomes, P.: Classification of daily abundant
rainfall patterns and associated large-scale atmospheric circula-
Alpert, P. and Ziv, B.: The Sharav cyclone – observations and some tion types in Southern Portugal, Int. J. Climatol., 28, 537–544,
theoretical considerations, J. Geophys. Res.-Atmos., 94, 18495– https://doi.org/10.1002/joc.1564, 2008.
18514, https://doi.org/10.1029/JD094iD15p18495, 1989. Galway, J. G.: The lifted index as a predictor of latent instability, B.
Alpert, P., Osetinsky, I., Ziv, B., and Shafir, H.: Semi-objective clas- Am. Meteorol. Soc., 37, 528–529, 1956.
sification for daily synoptic systems, Application to the Eastern Geer, I. W.: Glossary of Weather and Climate, American Meteoro-
Mediterranean climate change, Int. J. Climatol., 24, 1001–1011, logical Society, Boston, USA, 272 pp., 1996.
https://doi.org/10.1002/joc.1036, 2004. Haiden, T., Kann A., Wittmann C., Pistotnik G., Bica B.,
Altaratz, O., Levin, Z., and Yair, Y.: Winter thunderstorms in Israel: and Gruber C.: The Integrated Nowcasting through Com-
A study with lightning location systems and weather radar, Mon. prehensive Analysis (INCA) System and Its Validation over
Weather Rev., 129, 1259–1266, 2001. the Eastern Alpine Region, Weather Forecast., 26, 166–183,
Armon, M., Morin, E., and Enzel, Y.: Overview of mod- https://doi.org/10.1175/2010WAF2222451.1, 2011.
ern atmospheric patterns controlling rainfall and floods Harats, N., Ziv, B., Yair, Y., Kotroni, V., and Dayan, U.: Dynamic
into the Dead Sea: Implications for the lake’s sedimentol- and thermodynamic predictors for lightning and flash floods in
ogy and paleohydrology, Quaternary Sci. Rev., 216, 58–73, the Mediterranean, Adv. Geophys., 23, 57–64, 2010.
https://doi.org/10.1016/j.quascirev.2019.06.005, 2019. HMSO: Weather in the Mediterranean I: General Meteorology, 2nd
Ashbel, D.: Great floods in Sinai Peninsula, Palestine, Syria and the ed., Her Majesty’s Stationery Office, London, 362, 1962.
Syrian Desert, and the influence of the Red Sea on their forma- Holton, J. R.: An Introduction to Dynamic Meteorology, 2nd Edn.,
tion, Q. J. Roy. Meteror. Soc., 64, 635–639, 1938. Academic Press, Massachusetts, USA, 507 pp., 1992.
Bardossy, A. and Filiz, F.: Identification of flood produc- Hoskins, B. J., McIntyre, M. E., and Robertson, A. W.: On the use
ing atmospheric circulation patterns, J. Hydrol., 313, 4857, and significance of isentropic potential vorticity maps, Q. J. Roy.
https://doi.org/10.1016/j.jhydrol.2005.02.006, 2005. Meteor. Soc., 877–946, https://doi.org/10.1002/qj.49711147002,
Becker, J. S., Taylor, H. L., Doody, B. J., Wright, K. C., Grunt- 1985.
fest, E., and Webber, D.: A review of people’s behavior Jacobeit, J., Homann, M., Philipp, A., and Beck, C.: Atmospheric
in and around floodwater, Weather Clim. Soc., 7, 321–332, circulation types and extreme areal precipitation in southern cen-
https://doi.org/10.1175/WCAS-D-14-00030.1, 2015. tral Europe, Adv. Sci. Res., 14, 71–75, 2017.
Copernicus: Welcome to the Climate Data Store, available at: https: Kahana, R.: Synoptic Hydro-climatology of Major Floods in the
//cds.climate.copernicus.eu, last access: 25 December 2019. Negev and Arava, Southern Israel, MSc Thesis, Institute of Earth
Copernicus Climate Change Service (C3S): ERA5: Fifth genera- Sciences, The Hebrew University of Jerusalem, Jerusalem,1999.
tion of ECMWF atmospheric reanalyses of the global climate, Kahana, R., Ziv, B., Enzel, Y., and Dayan, U.: Synoptic climatology
Copernicus Climate Change Service Climate Data Store (CDS), of major floods in the Negev Desert, Israel, Int. J. Climatol., 22,
https://cds.climate.copernicus.eu/cdsapp#!/home (last access: 25 867–882, https://doi.org/10.1002/joc.766, 2002.
December 2019), 2017.
https://doi.org/10.5194/nhess-21-1583-2021 Nat. Hazards Earth Syst. Sci., 21, 1583–1597, 20211596 U. Dayan et al.: Atmospheric conditions leading to an exceptional fatal flash flood in the Negev Desert Kalnay, E., Kanamitsu, M., Kistler, R., Collins, W., Deaven, Porat, A., Halfon, N., and Forshpan, A.: Examining the exception- D., Gandin, L., Iredell, M., Saha, S., White, G., Woollen, ality of 25–27 April 2018, in: IMS, 16 August 2018, Israel Me- J., Zhu, Y., Chelliah, M., Ebisuzaki, W., Higgins, W., teorological Service, Beit Dagan, Israel, 2018. Janowiak, J., Mo, K. C., Ropelewski, C., Wang, J., Leet- Porcù, F., Carrassi, A., Medaglia, C. M., Prodi, F., and Mugnai, maa, A., Reynolds, R., Jenne, R., and Joseph, D.: The A.: A study on cut-off low vertical structure and precipitation in NCEP/NCAR 40 years reanalysis project, B. Am. Me- the Mediterranean region, Meteorol. Atmos. Phys., 96, 121–140, teorol. Soc., 77, 437–472, https://doi.org/10.1175/1520- 2007. 0477(1996)0772.0.CO;2, 1996. Rinat, Y., Marra, F., Armon, M., Metzger, A., Levi, Y., Khain, P., Kerkmann, J.: Applications of Meteosat Second Generation – Me- Vadislavsky, E., Rosensaft, M., and Morin, E.: Hydrometeoro- teorological use of the SEVIRI IR3.9 Channel, EUMETSAT, logical analysis and forecasting of a 3 d flash-flood-triggering European Organisation for the Exploitation of Meteorologi- desert rainstorm, Nat. Hazards Earth Syst. Sci., 21, 917–939, cal Satellites, available at: http://www.eumetsat.int, last access: https://doi.org/10.5194/nhess-21-917-2021, 2021. 1 June 2019. Rolph, G., Stein, A., and Stunder, B.: Real-time Environmental Ap- Khain, P., Levi, Y., Shtivelman, A., Vadislavsky, E., Brainin, E., and plications and Display sYstem: READY, Environ. Model. Softw., Stav, N.: Improving the precipitation forecast over the Eastern 95, 210–228, 2017. Mediterranean using a smoothed time-lagged ensemble, Meteo- Saaroni, H., Halfon, N., Ziv, B., Alpert, P., and Kutiel, H.: rol. Appl., 27, e1840, https://doi.org/10.1002/met.1840, 2020. Links between the rainfall regime in Israel and location and Khain, P., Levi, Y., Muskatel, H., Shtivelman, A., intensity of Cyprus lows, Int. J. Climatol., 30, 1014–1025, Vadislavsky, E., and Stav, N.: Effect of shallow convec- https://doi.org/10.1002/joc.1912, 2010. tion parametrization on cloud resolving NWP forecasts Sharif, H., Jackson, T., Hossain, M., and Zane, D.: Analysis of over the Eastern Mediterranean, Atmos. Res., 247, 105213, flood fatalities in Texas, Nat. Hazards Rev., 16, 04014016, https://doi.org/10.1016/j.atmosres.2020.105213, 2021. https://doi.org/10.1061/(ASCE)NH.1527-6996.0000145, 2015. Kistler, R., Kalnay, E., Collins, W., Saha, S., White, G., Sharon, D.: Rainfall Fields in Israel and Jordan and the Effect of Woollen, J., Chelliah, M., Ebisuzaki, W., Kanamitsu, Cloud Seeding on Them, J. Appl. Meteorol., 17, 40–48, 1978. M., Kousky, V., Van Den Dool, H., Jenne, R., and Fior- Sharon, D. and Kutiel, H.: The distribution of rainfall in- ino, M.: The NCEP-NCAR 50 year Reanalysis: Monthly tensity in Israel, its regional and seasonal variations and means CD-ROM and documentation, B. Am. Mete- its climatological evaluation, J. Climatol., 6, 277–291, orol. Soc., 82, 247–267, https://doi.org/10.1175/1520- https://doi.org/10.1002/joc.3370060304, 1986. 0477(2001)0822.3.CO;2, 2001. Shay-El, Y. and Alpert, P.: A diagnostic study of win- Kushnir, Y., Dayan U., Ziv B., Morin E., and Enzel Y.: Climate ter diabatic heating in the Mediterranean in relation of the Levant: phenomena and mechanisms, in: Quaternary of to cyclones, Q. J. Roy. Meteor. Soc., 117, 715–747, the Levant: Environments, Climate Change, and Humans, edited https://doi.org/10.1002/qj.49711750004, 1991. by: Enzelm, Y. and Bar-Yosef, O., Cambridge University Press, Showalter, A., K.: A Stability Index for Thunderstorm Forecasting, London, 31–44, 2017. B. Am. Meteorol. Soc., 34, 25–252, 1953. Kutiel, H.: Spatial Coherence of Monthly Rainfall in Israel, Arch. Stein, A. F., Draxler, R. R., Rolph, G. D., Stunder, B. J. B., Meteor. Geophy. B, 31, 353–367, 1982. Cohen, M. D., and Ngan, F.: NOAA’s HYSPLIT atmospheric Lensky, I. M. and Rosenfeld, D.: Clouds-Aerosols-Precipitation transport and dispersion modeling system, B. Am. Meteo- Satellite Analysis Tool (CAPSAT), Atmos. Chem. Phys., 8, rol. Soc., 96, 2059–2077, https://doi.org/10.1175/BAMS-D-14- 6739–6753, https://doi.org/10.5194/acp-8-6739-2008, 2008. 00110.1, 2015. Liu, W. T.: Statistical relation between monthly mean precip- Stephan, K., Klink, S., and Schraff, C.: Assimilation of radar de- itable water and surface-level humidity over global oceans, Mon. rived rain rates into the convective scale model COSMO-DE at Weather Rev., 114, 1591–1602, https://doi.org/10.1175/1520- DWD, Q. J. Roy. Meteor. Soc., 134, 1315–1326, 2008. 0493(1986)1142.0.CO;2, 1986. Terti, G., Ruin, I., Anquetin, S., and Gourley, J. J.: A situation-based Marra, F. and Morin, E.: Use of radar QPE for the analysis of flash flood fatalities in the united states, B. Am. Me- derivation of Intensity–Duration–Frequency curves in teorol. Soc., 98, 333–345, https://doi.org/10.1175/BAMS-D-15- a range of climatic regimes, J. Hydrol., 531, 427–440, 00276.1, 2017. https://doi.org/10.1016/j.jhydrol.2015.08.064, 2015. Tsvieli, Y. and Zangvil, A.: Synoptic climatological analysis of Red Moncrieff, M. W. and Miller, M., J.: The dynamics and simulation Sea Trough and non-Red Sea Trough rain situations over Is- of tropical cumulonimbus and squall lines, Q. J. Roy. Meteror. rael, Adv. Geosci., 12, 137–143, https://doi.org/10.5194/adgeo- Soc., 102, 373–394, 1976. 12-137-2007, 2007. Montz, B. E. and Gruntfest, E.: Flash flood mitigation: Rec- Uccellini, L. W. and Kocin, P. J.: The interaction of jet streak circu- ommendations for research and applications, Global Environ- lations during heavy snow events along the east coast of United mental Change Part B: Environmental Hazards, 4, 15–22, States, Weather Forecast., 2, 289–308, 1987. https://doi.org/10.1016/S1464-2867(02)00011-6, 2002. Uzan, L., Egert, S., Khain, P., Levi, Y., Vadislavsky, E., and Alpert, Morin, E., Harats, N., Jacoby, Y., Arbel, S., Getker, M., P.: Ceilometers as planetary boundary layer height detectors and Arazi, A., Grodek, T., Ziv, B., and Dayan, U.: Studying a corrective tool for COSMO and IFS models, Atmos. Chem. the extremes: hydrometeorological investigation of a flood- Phys., 20, 12177–12192, https://doi.org/10.5194/acp-20-12177- causing rainstorm over Israel, Adv. Geosci., 12, 107–114, 2020, 2020. https://doi.org/10.5194/adgeo-12-107-2007, 2007. Nat. Hazards Earth Syst. Sci., 21, 1583–1597, 2021 https://doi.org/10.5194/nhess-21-1583-2021
You can also read