Application and Feasibility Analysis of DCF Model in Corporate Valuation: A Case Study of Tesla, Inc.
←
→
Page content transcription
If your browser does not render page correctly, please read the page content below
Application and Feasibility Analysis of DCF
         Model in Corporate Valuation: A Case Study
                        of Tesla, Inc.

                                           Jiayi Pan(B)

                University of Illinois at Urbana-Champaign, Champaign, USA
                                 jiayip3@illinois.edu

       Abstract. Although in the past two years, the COVID-19 pandemic and the result-
       ing rise in global raw materials and labor costs have had a more serious adverse
       impact on the entire automotive industry, the new energy vehicle industry has
       shown a strong momentum of development in the past two years, with significant
       improvement in both the scale and speed of development. Therefore, given the
       rapid growth of the electric vehicle industry in the past two years, it is necessary
       to evaluate companies in some related fields from the aspects of business scope
       and development policies in early 2022 to rejudge the value they can generate in
       the future. This paper adopts the Discounted Cash Flow (DCF) model, a classical
       capital pricing model, to discount all cash flows of Tesla in the future, thus obtain-
       ing the current corporate value of Tesla. It turns out that the final estimation of
       Tesla’s enterprise value is about $900 billion. Compared with the public valuation
       of Tesla, there is a risk that the corporate value of Tesla may be overvalued by
       the public. Through analysis, it can be concluded that although the DCF valuation
       model has certain inevitable restrictions, it is still practical to evaluate large-scale
       companies. For the future development of new energy electric vehicles, although
       the far-reaching impact of the epidemic may continue for several more years, it can
       be argued that the development potential of the electric vehicle industry cannot be
       underrated, especially for new energy electric vehicle companies represented by
       Tesla.

       Keywords: Tesla · Corporate Valuation · Capital · Discounted Cash Flow
       (DCF) · Weighted Average Cost of Capital (WACC) · Capital Asset Pricing
       Model (CAPM)

1 Introduction

The global automotive industry has already experienced a global economic recession,
tax increases, a trade war between China and the United States, and strict environmental
regulations until 2019. Nonetheless, the industry has been further hit by the worldwide
outbreak of COVID-19 in 2020. For instance, many fields were negatively affected,
such as the labor shortage, rising raw material prices, and fractured supply chains [1].
According to the data shown by International Energy Agency, due to the epidemic and

© The Author(s) 2022
F. Balli et al. (Eds.): ESFCT 2022, AEBMR 226, pp. 1005–1023, 2022.
https://doi.org/10.2991/978-94-6463-052-7_114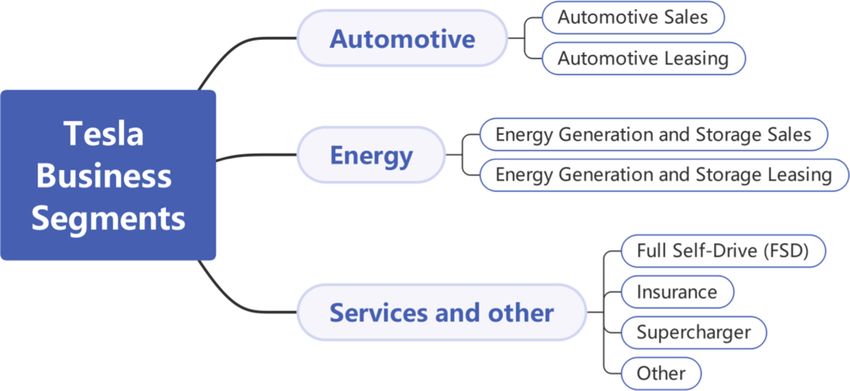
1006    J. Pan

other factors, global car sales declined by 16% from 2020 to 2021. However, against
this backdrop, registrations of electric vehicles (EV) increased by 41%, so that by early
2021, the number of electric cars on the worldwide roads reached 10 million [2].
    To sum up, the valuation methods of EV companies based on outmoded methods or
statistics may not be suitable for today’s post-epidemic era. Therefore, this paper will
take Tesla, the leading company in the electric vehicle industry, as the research object,
to estimate its corporate value by DCF methods. Then the final estimated result will be
used to assess the strategies of new energy vehicle companies and show the relevant
issues regarding DCF model in the process of corporate valuation.

2 Introduction of Discounted Cash Flow Methods and Tesla, Inc.
2.1 Theoretical Framework: Discounted Cash Flow (DCF) Methods

As a classical valuation method, the DCF model mentioned in this paper is still prevalent
in current financial valuation and corporate management. This method involves estimat-
ing future cash flows and discounting them at a discount rate to produce the present value
of future cash flows. It is used to compare the relative value of competing investment
opportunities within companies and is a traditional way to determine the fundamental
value of a company’s assets, such as shares and debt [3].
    DCF models are now often directly linked to evaluating economic activity to max-
imize the benefit of shareholders, since the sole purpose of a company is to maximize
wealth for its owners while ensuring that the interests of creditors are fully protected.
This idea has become particularly important in the 21st century. As the model has been
expanded and developed, it has been used for making company management decisions
and as a general method for valuing asset, from publicly traded stocks to acquiring com-
panies and start-ups. The DCF model has become the basic but essential method in terms
of general corporate management and corporate valuation.

2.2 Analytic Target: Tesla, Inc.

Tesla is an American electric vehicle and energy company headquartered in Austin,
Texas. Production and marketing of electric vehicles, solar panels, energy storage equip-
ment and related products and services. The company has the world’s most significant
sales of battery electric vehicles (BEV) and plug-in hybrid electric vehicles (PHEV),
capturing 14% of the electric market in 2021 [4]. In terms of electric vehicle sales (mainly
for the four models: Model Y, X, S and 3), Tesla sold 936,222 cars globally in 2021, and
its cumulative sales reached 2.3 million by the end of 2021. In the energy business, Tesla
is mainly responsible for two businesses: the solar generation business and the energy
storage business. Tesla Energy, a subsidiary of Tesla, develops and installs photovoltaic
systems in the United States. In 2021, energy storage deployment reached 3.992 GWh,
up 32% YoY; Installed solar power capacity was 345 megawatts, up 68% YoY [5]. Tesla
is constantly making breakthroughs in both electric generation and energy storage.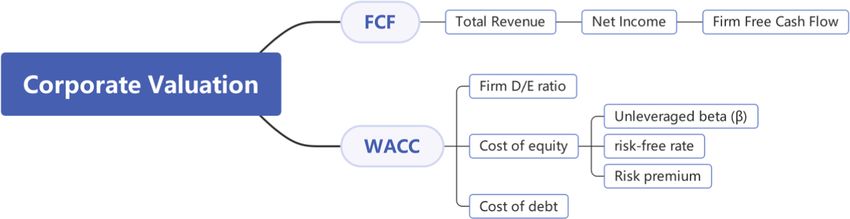
Application and Feasibility Analysis of DCF Model     1007

2.3 Data Sources
The primary data cited are mainly from: The annual report of Tesla, Inc. on Form
10-K published by United States securities and exchange commission [6], Quarterly
Disclosure published by Tesla, Inc [5].
   Some ancillary data are from: Statista, Iea, ValueInvesting, Finbox, Macrotrends,
NYU Stern, Bloomberg, CSIMarket, Global Ranking, Social Security Administration,
Mortgage, CNBC, WSJ|Market.

3 The Application of DCF
3.1 DCF Model Review
One of the meaning of using the Discounted Cash Flow (DCF) valuation model is that
the value of a company can be derived from the expected discounted cash flow to reflect
the opportunity cost of the investment and the risks associated with it at the present
timeline [7]. In summary, the essence of valuing a company is to estimate its present
value by presenting its future cash flows at a reliable discount rate.
    Therefore, calculating the free cash flow (FCF) and the company’s discount rate
plays a vital role in DCF valuation. According to the study of Copeland, Koller, and
Murrin [8], the cash flow structure is defined as:
    Revenue (net sales) - Cost of sales = Gross profit - Depreciation-Operating expenses
= Operating income ± Other income(expense) = EBIT (Earnings before interest and
taxes) - Income tax on operating income = NOPLAT (Net Operating Profit Less adjusted
Taxes) + Depreciation = Operating cash flow ± CAPEX (Capital Expenditure) ± WC
(Working Capital Variation) = Free Cash Flow of the Company.
    When a company’s free cash flow (FCF) is obtained, the Weighted Average Cost of
Capital (WACC) should be used as a discount rate to calculate the present value of cash
flows. The formula for estimating the present value of the company is as follows:


                                              t=n
                                                       FCF(t)
                         Company Value =                                                (1)
                                                    (1 + WACC)t
                                              t=0

t: future period; FCF(t) : The company’s free cash flow at time t; WACC: weighted average
cost of capital
     The DCF method is used to forecast the operating results of a company over a discrete
multi-year period. The discrete cash flow projection is then converted into a single present
value. Therefore, the concept of perpetuity is introduced here, representing the ultimate
value of the company’s cash flows at the end [9]. The “long-term growth rate,” which
represents the company’s predicted growth, should then be introduced.
                                            FCF(t) × (1 + g)
                             Perpetuity =                                               (2)
                                              WACC − g
g: company growth rate
    The weighted average cost of capital (WACC) formally appears in the above formula,
which mainly considers how changes in bond and stock portfolio affect the company’s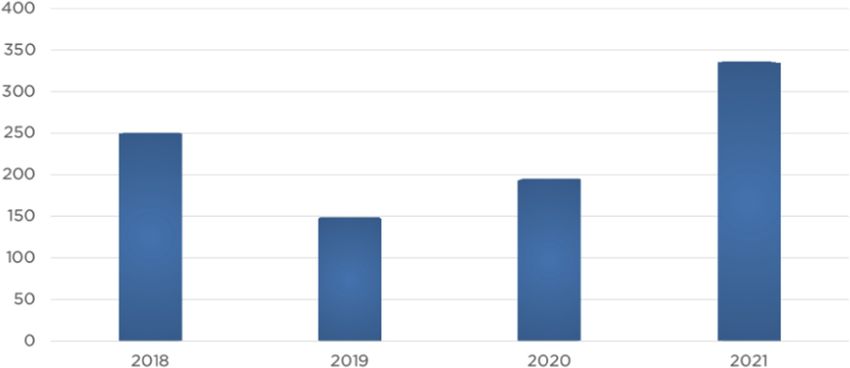
1008     J. Pan

cost of capital and the valuation result of the whole company. The WACC formula is as
follows:
                                 D                      E
                      WACC =       × rdebt × (1 − Tc ) + × requity                         (3)
                                 V                      V
    V: enterprise value; E: equity cost of capital; D: debt cost of the capital; requity : cost
of equity; required rate of return; rdebt : cost of debt; Tc : marginal tax rate of the firm.
    In particular, the cost of equity presented in the WACC formula represents the min-
imum rate of return reasonably required by investors for an asset, which is mainly
determined by the market risk-free rate of return, leverage-free beta and market risk pre-
mium. The Capital Asset Pricing Model (CAPM) can abstractly express the relationship
among the three elements, which is defined as follows:

                             requity = rf + β × [E(Rm ) − rf ]                             (4)

rf : risk-free return; β: security beta, the regression coefficient; E(Rm ): expected market
return.
      In summary, corporate value is measured by the present value discounted from the
future free cash flow of the enterprise. The rough method is to obtain the current FCF of
the enterprise through the accounting income data and finally estimate the present value
represented by the discounted FFCF through the weighted average treatment based on
the current state. When it comes to estimating the final value estimation, it is highlighted
that the final result is sensitive to the expected long-term growth rate (LTG) and WACC
because a slight change in LTG and weighted average rate can significantly impact the
value of the company, so the business growth rates should be carefully assessed [10].
      This paper will conduct a specific scenario analysis of Tesla’s commercial data in
2021 and then to show the application and credibility of the DCF model in real business
valuation practice with possible issues.

3.2 Data Input and Numerical Analysis
For the valuation of Tesla through DCF, the first step is using data sources, such as
the annual report mentioned above and the disclosed data set, to input primary data to
calculate and evaluate the total revenue and costs of Tesla in 2021. In addition, reasonable
assumptions are put forward to predict Tesla’s development in the next five years. This
section will explain some of the relevant figures involved in “total revenue” and “free
cash flow” and highlight some vital assumptions that were artificially referred in the
calculation.
    The revenue and costs analysis of Tesla needs to clarify its main business scope.
According to the investigation, Tesla’s business is mainly simplified and divided into
electric vehicle sales, energy business, and other essential support services (Fig. 1).
    First, the relevant expenses and revenue brought by “automotive sales” with the
largest proportion among all the business can be obtained through the sales and delivery
quantity statistics of four classic Tesla Models (Model Y, X, S, and 3) and their cor-
responding average selling price and costs. At the same time, some ancillary services
such as Full Self-Driving (FSD) system and insurance contract services should also be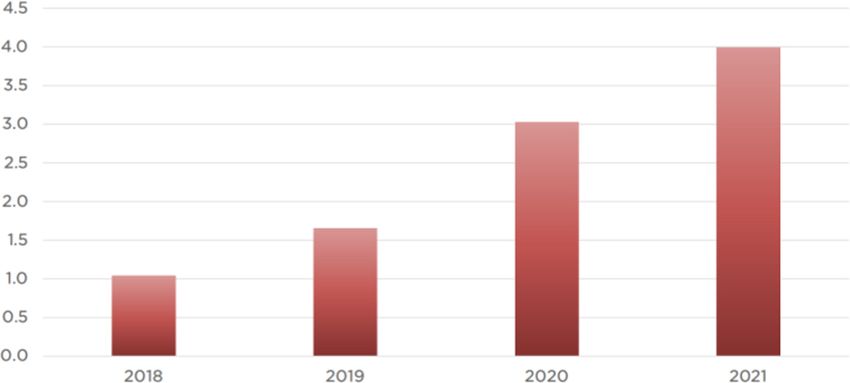
Application and Feasibility Analysis of DCF Model                               1009

                                             Fig. 1. Tesla Business Scope

                            Table 1. Tesla Annual Revenue & Cost: 2021–2027

Revenue &       2,021            2,022            2,023            2,024             2,025             2,026             2,027
Expenses
Total       $   55,391,489,361   68,700,882,334   96,113,950,565   141,626,451,090   182,567,877,249   238,086,299,384   298,649,726,253
Revenue
Total       $   37,270,704,713   42,718,618,685   57,197,255,875   76,983,963,333    97,136,253,760    118,077,607,178   144,753,354,065
Expense

taken into account. The revenue and costs generated by the energy business mainly come
from the value created by the energy generated or stored by setting relevant hardware
(Table 1).
    Based on the primary data, the total revenue and the costs can be obtained, so that
future free cash flow can be estimated. Therefore, the following content will analyze
some specific parts involved in the charts shown above.

3.2.1 Sales of the Automotive
According to Tesla’s annual report, Tesla’s electric vehicle sales are basically in balance
with supply and demand. Thus, the number of cars produced is assumed to be roughly
equal to the number of vehicles sold and delivered. It will help determine the production
volume for each model and facilitate subsequent cost analysis. Meanwhile, based on
the sales status of the four Models in recent years and the adjustment of Tesla’s internal
sales plan, it is assumed that Model 3/Y will grow at a growth rate of 20% and Model
S/X at a growth rate of 6%. For Cybertruck, which has not yet been officially launched,
it is assumed that it will debut at an average price of $55,000 in 2023 and grow at a rate
of 25% in the first two years, 35% in 2026, and 40% in 2027 (Tables 2 and 3).
1010 J. Pan
Table 2. Average Sale Price of Models
Average Sale Price of Models
Model 3 $/car 46,000
Model Y $/car 60,000
Model S $/car 80,000
Model X $/car 95,000
CyberTruck $/car 55,000
Table 3. Production Yield of Models: 2021–2027
Production 2021 2022 2023 2024 2025 2026 2027
Yield of
Models
Model cars 600,000 720,000 864,000 1,036,800 1,244,160 1,492,992 1,791,590
3
Model cars 306,000 367,200 422,280 485,622 607,028 758,784 948,480
Y
Model cars 12,000 15,600 20,280 23,322 25,654 26,937 28,284
S
Model cars 12,390 14,868 18,585 21,373 23,724 24,910 26,155
X
Cyber cars 150,000 187,500 234,375 316,406 442,969
Truck
930,390 1,117,668 1,475,145 1,754,617 2,134,940 2,620,029 3,237,479
3.2.2 Cost Structure
In terms of cost structure, Tesla plans to fully operate gigafactories in the U.S, Shanghai
and Berlin to increase production capacity. Therefore, it is reasonable to believe that
Tesla’s production of Model 3/Y can achieve economies of scale in recent three years
under scientific arrangements. However, with the rise of global inflation and labour and
raw material prices, its costs will inevitably increase. Because of that, the production cost
rate will reach a steady state from 2024. Therefore, the following model is established
(Table 4).
Due to the lack of information about Model S, Model X, and Cybertruck, The
estimates are based on the forecast performance of Model 3 and Model Y.Application and Feasibility Analysis of DCF Model 1011
Table 4. Production Cost of Models: 2021–2027
Production Cost of Models 2021 2022 2023 2024 2025 2026 2027
Model 3 % of price 73% 71% 70% 69% 69% 69% 69%
Model Y % of price 74% 72% 70% 70% 70% 70% 70%
Model S % of price 78% 78% 78% 78% 78% 78% 78%
Model X % of price 77% 77% 77% 77% 77% 77% 77%
CyberTruck % of price 79% 78% 77% 76% 75%
3.2.3 FSD and Other Services Related to Automotives
Tesla’s Full Self-drive (FSD) system has two main payment methods: one is a one-time
payment plan, and the second is a monthly payment plan. The one-time payment plan
accounts for the majority of FSD system revenue.
3.2.3.1 One-Time Payment Model
It is worth noting that when calculating the lump-sum payment, deferred income is
involved, i.e. the current FSD fee may be paid in the next 2–3 years. The calculation
formula is as follows:
FSD annual revenue = FSD current deferred revenue + early deferred revenue confirmed
Tesla current sales × FSD current installation rate × FSD current unit price
=
2
+ early deferred revenue confirmed (5)
3.2.3.2 The Monthly Payment Model
The annual revenue generated by monthly FSD payments is easier to calculate. The
terms of payment are as follows:
Year-end holdings × FSD adoption rate × monthly revenue per user × 12.
As the number of Tesla vehicles delivered increases, FSD monthly payment revenue
increases. But at the same time, although a one-time payment is a more economical way
of payment, more car owners say they prefer to pay for a monthly subscription because
the price of one-time payment has risen too fast in recent years. Many car owners do not
have the habit using a car all the time [11]. Therefore, it is reasonable to assume that the
number of monthly paying FSD users will increase from 7% in 2021 to 10% in 2027.
By 2027, monthly payments are projected to reach $1.1 billion (Table 5).
3.2.4 Energy Business
Tesla energy business is divided into solar generation (residential and commercial solar
roofs) and energy storage (Powerwall, Powerpack, Megapack).
3.2.4.1 Analysis of Historical Data
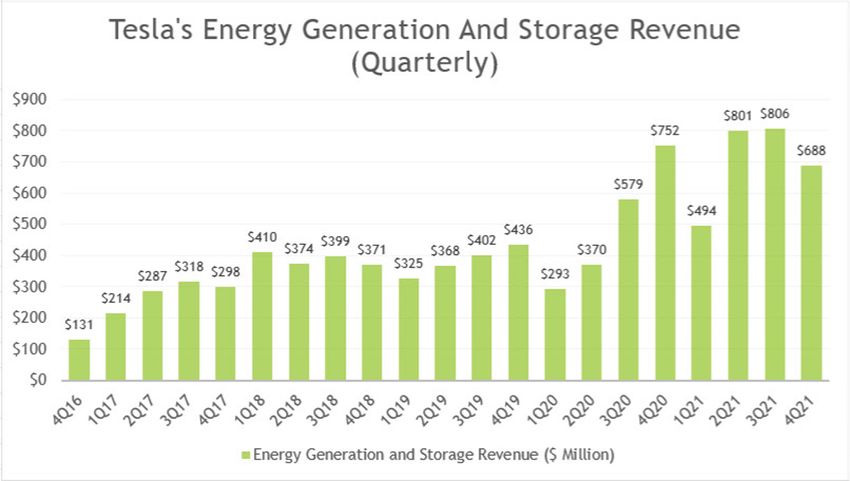
The chart Fig. 2 shows Tesla’s total energy or solar revenue from 2017 to 2021 [12]. For
the fiscal fourth quarter of 2021, Tesla’s energy revenue was $688 million, down 15%1012 J. Pan
Table 5. FSD: One-time and Monthly Payment Plans
Full Self-drive 2021 2022 2023 2024 2025 2026 2027
(FSD)
One-time
Payment Plan
Adoption % 35% 40% 45% 50% 55% 60% 65%
rate
Unit $ 10,500 11,025 11,576 12,155 12,763 110,884 116,428
Price
Revenue $ 2,158,000,000 3,969,000,000 6,500,000,000 9,827,000,000 14,176,000,000 21,264,000,000 27,052,000,000
Monthly
Payment Plan
Year-end cars 2,250,000 3,450,000 5,000,000 6,910,000 9,220,000 12,020,000 14,100,000
holding
Adoption % 7% 7% 9% 9% 9% 10% 10%
rate
Revenue $ 272,000,000 422,000,000 556,000,000 776,000,000 1,046,000,000 1,072,000,000 1,109,000,000
Fig. 2. 2016–2021 Tesla’s Energy Generation and Storage Revenue
from the prior quarter and 9% from a year ago. While Tesla’s energy revenue fell slightly
last quarter, it was up 60% from fiscal 2019 and nearly double from fiscal 2018.
As a result, Tesla’s energy revenue has been growing steadily over the long term.
3.2.4.2 Assumption
According to historical data [5], Tesla’s solar and storage deployments continued to
soar in the fourth quarter of 2021, reportedly at 345MW and 4GWh, respectively. It
is observed that Tesla is expanding in the energy sector, which is reflected in decline
in gross margins while revenue grows. Therefore, once the breakeven point is reached,
Tesla’s energy business will start making money. Thus, based on the average increase
rate of solar generation and considering the risk of plummeting solar generation rates,Application and Feasibility Analysis of DCF Model 1013
Fig. 3. 2018–2021 Total Energy storage deployments in GWh
Fig. 4. 2018–2021 Residential solar deployed in MW
the solar deployment rate is assumed to keep at 15%. Relying on the general increasing
trend of energy storage, the assumption is that the storage deployment rate will remain
at 25% (Figs. 3, 4 and Table 6).
According to the previous analysis, the total revenue of the energy business of Tesla
will increase from $2789 million in 2021 to $9428.654 million in 2027.
3.2.5 Supercharging Business and Insurance Business
3.2.5.1 Supercharging Business
As an essential part of expanding the use scene of electric vehicles, Tesla supercharging
piles have the characteristics of high investment cost and fuzzy operation mode in the
previous period, and their profit model has a significant correlation with the use frequency
(equivalent to the vehicle ownership).
There are some assumptions used to estimate revenue in the supercharging business.
(i) Tesla’s electric-only range will remain at 4 miles/KWh. It is also revealed that the
average electricity per mile for Tesla is 0.25 KWh per mile.
(ii) Based on the trend analysis of sales and leasing of Tesla vehicles [13], the vehicle
ownership will grow steadily1014 J. Pan
Table 6. Tesla’s Energy Generation & Storage Business: 2022–2027 revenue estimation
Energy generation 2021 2022 2023 2024 2025 2026 2027
Solar MW 345 397 456 525 603 694 798
deployment
YoY-solar % 15% 15% 15% 15% 15% 15% 15%
deployed
Solar energy $/W 2 2 2 2 2 2 2
price
YoY-solar % 1% 1% 1% 1% 1% 1% 1%
energy
Revenue $ 517,500,000 601,076,250 698,150,064 810,901,300 941,861,860 1,093,972,550 1,270,649,117
Energy storage 2021 2022 2023 2024 2025 2026 2027
Enregy MWh 4,000 5,000 6,250 7,813 9,766 12,207 15,259
storage
deployment
YoY-energy % 25% 25% 25% 25% 25% 25% 25%
storage rate
Energy $/MWh 568 562 557 551 545 540 535
storage
price
YoY-energy % −1% −1% −1% −1% −1% −1% −1%
storage
price
Revenue $ 2,271,500,000 2,810,981,250 3,478,589,297 4,304,754,255 5,327,133,390 6,592,327,571 8,158,005,369
Total $ 2,789,000,000 3,412,057,500 4,176,739,361 5,115,655,555 6,268,995,250 7,686,300,121 9,428,654,486
revenue
Table 7. Tesla Supercharging Business: 2022–2027 revenue estimation
Tesla Supercharging Business 2021 2022 2023 2024 2025 2026 2027
Annual average mileage mile/car 8,500 10,000 11,000 12,000 13,000 14,000 15,000
Electric vehicle endurance mile/KWh 4 4 4 4 4 4 4
Average annual charge KWh/car 2,125 2,500 2,750 3,000 3,250 3,500 3,600
Charging fee $/KWh 0.25 0.25 0.25 0.25 0.25 0.25 0.25
Annual charging fee $/car 531.25 625.00 687.50 750.00 812.50 875.00 900.00
Vehicle owership cars 2,250,000 3,450,000 5,000,000 6,910,000 9,220,000 12,020,000 14,000,000
Total charging revenue $ 1,195,312,500 2,156,250,000 3,437,500,000 5,182,500,000 7,491,250,000 10,517,500,000 12,818,000,900
(iii) The average mileage of Tesla vehicles worldwide is estimated to be 8,500 miles
in 2021, which is expected to be increased to 15,000 miles in 2027 (Table 7).
3.2.5.2 Insurance Business
Since Tesla knows its cars best, the Tesla insurance business can ensure electric vehicles
at a lower cost using advanced technology, safety, and serviceability. Therefore, Tesla’s
premiums are personalized and lower than those of traditional insurance companies.
There are some assumptions used to estimate revenue in the insurance business.Application and Feasibility Analysis of DCF Model 1015
Table 8. Tesla Insurance Business: 2022–2027 revenue estimation
Tesla Insurance 2021 2022 2023 2024 2025 2026 2027
Business
Insurance % 0.5% 1.0% 3.0% 5.0% 7.0% 8.5% 9.0%
market
Share
Insured cars 10,000 30,000 150,000 350,000 650,000 900,000 900,000
vehicles
Premium $/car 1,015 1,030 1,046 1,061 1,077 1,093 1,110
per Policy
premium $ 10,150,000 30,906,750 156,851,756 371,477,243 700,234,603 984,098,938 998,860,422
revenue
Insurance % 75% 75% 75% 75% 75% 75% 75%
claims
Revenue $ 2,537,500 7,726,688 39,212,939 92,869,311 175,058,651 246,024,734 249,715,105
after
settlement
of claims
(i) Based on the insurance industry’s average risk rate data, 75% is chosen as the
average insurance claims, which means that annual claims account for 75% of
insurance revenue.
(ii) The premium per policy will increase by 1.5% per year, from $1015 in 2021 to
$1093 in 2027. According to a service conducted to indicate the average insurance
payment for a Tesla [14], it was discovered that the minimum coverage is around
$800 per year. Considering some vehicle owners choose full coverage insurance,
the overall cost of insurance for Tesla is $1015/yr.
In the market, the average car insurance rate increases 2% per year. It is estimated
that the premium per policy of Tesla will increase 1.5% per year due to the Tesla benefits
policy (Table 8).
3.3 WACC and Corporate Valuation
When the total profit is calculated from the existing data, the operational goal is to
determine the free cash flow and WACC separately (Fig. 5).
3.3.1 From Total Revenue to FCF
The simplified free cash flow formula is as follows (Table 9):
NOPLAT = Total Revenue − Cost − Operating Income Tax (6)
Free Cash Flow = NOPLAT + Depreciation − Capital Expenditure
+ Change of Working Capital (7)1016 J. Pan
Fig. 5. The structure of Corporate Valuation
Table 9. Fixed Assets & Taxes
Fixed Assets
Value of Fixed Assets at the end $ 18,884,000,000 Balance sheet
of 2021
Depreciation Rate % of Rev 3% Estimated
CAPEX % of Rev 15% Valueinvesting
Taxes
Payroll Tax % 7.65% Federal Insurance Contributions
Act (FICA)
Profit Tax % 17.15% Discounted US Federal Tax rate
Property Tax % 1.10% US nationwide average rate
(Mortgage)
Confirming fixed assets and income tax is the first issue to be solved from transferring
the revenue to the final free cash flow of the company. According to the collected data
from Valueinvesting [15], when dealing with fixed assets, it is assumed that Tesla adopts
a 3% depreciation rate for fixed assets and a 15% capital expenditure rate for profits.
In terms of the tax rate, relying on the general tax policies applied in the United States,
it is stipulated that the individual payroll tax and property taxes are 7.65% and 1.10%
respectively. The corporate income tax is based on the US federal tax rate, combined
with the corporate income tax rate paid by foreign companies in China and Europe, and
the final tax rate is assumed to be 17.15%. The last element is working capital, which is
the net of total current assets minus total current liabilities of the enterprise. Namely, it is
the net of current capital available for use and turnover in the operation of the enterprise.
According to WSJ|Market [16], the change in working capital was worth $518,000,000,
and the assumption is that the change rate is 10% because of the rapid expansion of
Tesla.
Combined with the above assumptions and calculated gross income, the estimated
cash flow of Tesla from 2021 to 2027 is obtained (Table 10).Application and Feasibility Analysis of DCF Model 1017
Table 10. Cash Flow Estimation
2021 2022 2023 2024 2025 2026 2027
Free Cash Flow 5,837,462,842 8,276,015,767 13,455,431,255 24,863,972,892 33,511,762,264 49,068,664,344 63,729,933,731
3.3.2 WACC Calculation
The most critical thing in estimating WACC is to understand the relationship between
several important variables and adjust accordingly. The Table 11 shows the values of each
related coefficient related to WACC, which are collected and processed from different
credible data platform.
The majority of relevant coefficients could be obtained from data platforms. While
the company beta of Tesla needs to be specifically explained how it is estimated. Beta is
a pointer used to measure the systemic risk of an asset. According to CAPM, a suitable
beta estimation method is to find the industry beta of electric vehicle and new energy
industries similar to Tesla and deleverage the beta based on the average capital structure
of the target industry. Then, the beta coefficient of Tesla is obtained by leveraging again
relying on its capital structure. The specific operation formula is as follows:
Industry Equity Beta
Industry Assets Beta = (8)
1 + Target D/E Ratio
Industry Assets Beta
Company Beta = (9)
1 + Company D/E Ratio
Ultimately, the company’s beta value of Tesla is estimated to be 0.9522.
The final step is corporate valuation. In order to minimize the error. Firstly, the
net present value (2022–2027) could be estimated by formula (10). Then, using the
perpetuity formula (11) based on the data in 2027, the continued corporate value after
2027 could be obtained. The estimated corporate value of Tesla equals NPV2022–2027
plus NPV2027 continued (Table 12).
FCF2022 FCF2023 FCF2024
NPV2022−2027 = + +
1 + WACC2022 (1 + WACC2023 )2
(1 + WACC2024 )3
Table 11. Vital coefficients in WACC evaluation
WACC related coefficients
US risk-free % 2.40% 10-year US Treasury
Market Premium % 4.50% Finbox
Beta 1.13 NYU Stern
Target D/E Ratio % 19.86% NYU Stern
Growth Rate % 5.00% Valueinvesting
Inflation in the base year % 7.00% Bloomberg
Company D/E Ratio % 1.00% Valueinvesting1018 J. Pan
Table 12. WACC Calculation & Enterprise Valuation
WACC & 2021 2022 2023 2024 2025 2026 2027
Corporate
Valuation
Industry 1.13
Equity Beta
Industry 0.9428
Assets Beta
Company 0.9522 0.9522 0.9522 0.9522 0.9522 0.9522 0.9522
Beta
Cost of 14.15% 10.42% 10.42% 9.99% 9.57% 9.46% 9.99%
Equity
Cost of Debt 4.50% 4.50% 4.50% 4.50% 4.50% 4.50% 4.50%
WACC 14.05% 10.35% 10.35% 9.93% 9.51% 9.40% 9.93%
Discounted --- 7,499,610,960 11,049,241,684 18,716,335,072 23,303,473,551 31,309,709,957 36,111,376,465
CF
NPV 127,989,747,688
Forecast
Period from
2022–2027
NPV 769,092,862,558
Continuation
Period
Corporate 897,082,610,246
Value
FCF2025 FCF2026 FCF2027
+ + +
(1 + WACC2025 ) 4
(1 + WACC2026 ) 5 (1 + WACC2027 )6
(10)
FCF2027 × (1 + g)
NPV2027 continued = (11)
WACC2027 - g
Therefore, the estimated perpetual corporate value of Tesla is $ 897,082,610,246.
4 Discussion
This paper uses the DCF model to evaluate Tesla, the representative company of new
energy auto vehicle enterprises. Furthermore, the application of the DCF model in cor-
porate valuation is demonstrated. The final prediction results are used to adjust investors’
views on the future development prospects of new energy enterprises in the epidemic
era. Using the DCF model, Tesla was eventually valued at about $900 billion. This part
will discuss the practical significance and rationality of this result.
4.1 The Practical Significance of DCF Model Valuation Results
According to Global Ranking [17], as of December 31, 2021, Tesla’s valuation reached
$1.06 trillion, slightly higher than the final valuation of $900 billion derived from the
DCF model. With a valuation of more than $1 trillion, Tesla remains the sixth mostApplication and Feasibility Analysis of DCF Model 1019
valuable company globally. As early as October 26, 2021, CNN Business reported that
Tesla’s valuation had officially broken through $100 billion [18].
Since the valuation data of Tesla by the DCF model combined with WACC is slightly
less than that in the current market, it can also prove the practicability and feasibility of
DCF in the process of corporate valuation. The reason for the slight difference between
the estimated result from DCF and the market cap is that Tesla seemed to be overval-
ued at the end of 2021. According to the Global Ranking [17], the market cap of Tesla
dropped dramatically from January 14 to January 21, when on January 17 the market cap
decreased below $1 trillion and reached $947.92 billion on January 21. Then this statistic
fluctuated around $900 trillion until March 20, 2022, when the market cap rose over $1
trillion again. The information delay could explain the decrease of the corporate valua-
tion. It appears that when the fourth-quarter results were released, shareholders expressed
distrust of Tesla’s operations. Thus, the final estimation of DCF model shows a relatively
accurate result. Meanwhile, this $900 billion valuation of Tesla also reflects the market’s
recognition of Tesla’s sustainable, high-quality and rapid development prospects. It also
reflects the vast development potential of new energy vehicle enterprises represented by
Tesla in the epidemic period.
Therefore, combined with the auxiliary materials and the analysis of the above parts
of Tesla’s proprietary business, success factors that Tesla will emerge from the global
new energy enterprises can be simply boiled down to the following several factors. For
example, the expansion of the company’s related business scope, the improvement of
supporting facilities and production capacity, and the company’s unique sophisticated
technology and innovative products.
First of all, in addition to the company’s main business - electric vehicles, Tesla has
expanded into related energy production and storage businesses. Its main representative
products are solar roofs and solar panels. According to the annual report [6] revealed
by the United States Securities and Exchange Commission, the energy generation and
storage segment revenue of Tesla has increased from $181.39 million in 2016 to $2789
million in 2021. At the same time, it was found that Tesla’s energy business profit
maintained 5% of the total profit after 2019. Compared with Tesla’s electric vehicle
sales, the energy business is a relatively small but stable part of Tesla’s whole business.
It is expected that, with the adjustment of the industrial structure, the energy business
will become increasingly important to the company.
Second, Tesla’s current factories worldwide are being planned and built at a rapid
pace. By April 10, 2022, Tesla had built 6 gigafactories around the world, among which
the latest two plants, Berlin Gigafactory and Texas Gigafactory, were officially put
into operation on March 22, 2022 and April 7, 2022 respectively. Tesla is creating
gigafactories to match its economies of scale as the market changes. It can be predicted
that Tesla’s EV business will increase output with increased production capacity and
reduce relative profit before reaching the maximum profit point for Tesla, thus achieving
the final economies of scale.
Finally, the introduction of high-tech components and innovative products with inde-
pendent intellectual property rights guarantees the sustainable and efficient development
of the company. The new 4680 cylindrical lithium-ion battery that Tesla is currently work-
ing on, according to Kazuo Tadanobu, CEO of Panasonic’s Energy Division, which is1020 J. Pan
one of Tesla’s major battery partners, could help the company grow its global business
in the future because it can reduce the cost of electric vehicles while also ensuring the
efficient and safe operation of vehicles [19]. In addition to industrial components similar
to car batteries, Tesla is expected to launch the much-anticipated CyberTruck in 2023
officially. Elon Reeve Musk, CEO of Tesla, at the recent Tesla Gigafactory opening
ceremony, said, “Sorry for the delay. But you’re going to have [CyberTruck] next year,
and it’s really going to be great.” [20] Tesla continues to launch new products, from the
Model S, released in 2012, to the Cybertruck, released in 2023. The innovative pace led
Tesla to its success, with an estimated valuation of $900 billion, making it the sixth most
valuable company in the world.
4.2 Possible Problems of the DCF Model in Valuation
In the above application of the DCF model, Tesla’s final valuation is about $900 billion,
and the practical significance is assessed. To further analyzing the feasibility of the
DCF model, some valuation issues that may arise in the real world also need to be
considered. In fact, there is a risk that the discounted corporate value may differ greatly
from the actual situation. This section will analyze why this problem may occur from
three potential pitfalls of the DCF valuation model [21].
The first potential pitfall comes in Tesla’s cash flow estimation. When using the
DCF model to value Tesla, the most important thing is to estimate the future cash
flow, and the most common problem is that the company’s annual forecast of cash flow
growth is uncertain. Specifically, Tesla’s past data can precisely predict 2021 and 2022
performance and cash flow, but it is uncertain to predict the business performance in
the next few years, which will negatively impact the sustainable cash flow forecast.
Based on the historical records of previous years, if the prediction of recent years differs
significantly from the actual situation, the final valuation result will become wildly
inaccurate. For instance, the 4 Models of electric vehicles are analyzed respectively
in this paper. However, some crucial elements, such as the production and delivery
situations of each Model, are not revealed by Tesla. The annual report combined Model
S with X, Model 3 with Y, which made it hard to estimate the sales revenue and related
costs. The possible solution is to estimate free cash flows rationally for the first five or
even ten years based on existing data, and finally add aggregate discounted cash flow
with the perpetuity cash flows afterwards. Based on this step, the final perpetual cash
flow could be more precise.
The second pitfall is Tesla’s CAPEX projections. According to the understanding
of free cash flow, forecasting free cash flow requires a forecast of CAPEX for each
model year. In this model, uncertainty about CAPEX increases with each additional
year of valuation. However, capital expenditure is more discretionary. For example,
when the company is in recession, the management will control and suppress capital
expenditure, and vice versa. As a result, CAPEX projections are highly risky because
even small changes in forecasts can significantly impact DCF’s final valuation structure.
In combination with the global deployment plan of Tesla’s future gigafactor and the
forecast of the increased company’s fixed assets (e.g. supercharger) with the increase in
electric vehicle sales, this DCF model assumes a CAPEX-to-revenue ratio of 15% using
the sales ratio method. The ratio of 15% is close to the CAPEX-to-revenue ratio of TeslaApplication and Feasibility Analysis of DCF Model 1021
in 2021 and close to the ratio of Tesla’s average sales from 2017 to 2021. Therefore, this
data is used as Tesla’s sustainable CAPEX-to-revenue ratio to estimate free cash flow to
reduce errors.
The discount rate and forecasted sustainable growth rate are discussed in the final
section. First of all, for the discount rate, the current widely used method is the Weighted
Average Cost of Capital. However, estimating NPV through WACC is problematic
because the cost of leverage of equity (from CAPM) is used throughout the project.
However, in the future, the non-leverage cost of equity and the leverage cost of equity
mainly depends on the strategic decision of the company, so it will change in a small
range at any time. For example, if the company changes its capital structure, a variable
WACC should be applied instead of keeping the original estimated WACC for NPV [22].
Therefore, there may be inevitable errors in calculating NPV, and the predicted results
will often be conservative. In addition, the other part is the growth rate, which must be a
permanent-growth rate forecast in the DCF model. It can be predicted that the sustainable
management company’s sustainable growth rate is affected by the long-term economic
growth rate, and the company will eventually enter the mature low growth mode. How-
ever, it is too idealistic to assume that something is permanent, and the growth rate of a
mature company is rarely constant from year to year. Therefore, based on the long-term
historical data of the global economy and Tesla’s rapid development in the recent five
years, Tesla’s sustainable growth rate is assumed to be 5% to minimize the prediction
error, although the error is inevitable [15]. However, though some solutions exist to make
the result accurate, the errors derived from the estimation of growth rate and discount
rate are ineluctable. Because of the property of the DCF valuation model, this valuation
result is sensitive to small changes in the discount rate and growth rate assumptions, and
a difference of a few tenths of a decimal point can make the final result very different.
5 Conclusion
To explore the future corporate value of the new energy electric vehicle industry in the
epidemic era, this report uses the DCF valuation model to conduct the company valuation
for Tesla. The theoretical level of the DCF valuation model clarifies how to make a
specific valuation of a company based on the company’s total profit, capital structure,
industry development status, and other factors. Finally, it clarifies the valuation scheme
by FCF, WACC, CAPM, and different formulas. Then the DCF model is used to analyze
and forecast the corporate valuation of Tesla. In the practical application of the DCF
model at the commercial level, the main business fields of Tesla need to be clarified based
on the investigation. The value brought to Tesla by electric vehicle sales, energy, and
other businesses should be explored. With the data before 2021 reasonably estimated,
the value of free cash flow from 2022 to 2027 can be obtained through the DCF valuation
model. Then, the cost of equity can be estimated through CAPM, and WACC can be
obtained. Finally, the company value of Tesla is estimated to be $900 billion. Although
this figure is lower than the market cap of Tesla at the end of 2021, it still makes sense.
During the epidemic period, as a new energy electric vehicle company, it can obtain a
high company valuation, which revealed the huge development space of the new energy
field in the future. At the same time, Tesla’s development strategy, innovation ability,1022 J. Pan
and other advantages also inspire other electric vehicle companies. Finally, although the
DCF valuation model may be inaccurate in estimating free cash flow, capital expenditure,
or sustainable growth rate, it could also better adapt to the actual situation by studying
more company data, market development status, and dynamic adjustment according to
the company’s development strategy, so as to obtain more accurate future valuation data.
References
1. Kaitwade, N. COVID-19 shatters global automotive industry; sales of metal powder take a
nosedive amid wavering demand. Metal Powder Report, vol. 76(3), 2021, pp. 137–139.
2. IEA, Global EV Outlook 2021, 2021. Online: https://www.iea.org/reports/global-ev-outlook-
2021
3. Ortiz, H. Political Imaginaries of the Weighted Average Cost of Capital: A Conceptual
Analysis. Valuation Studies, vol. 8(2), 2021, pp. 5–35.
4. Carlier, M. (2022, March 9). Plug-in EV producers - worldwide market share. Statista.
Retrieved March 20, 2022, from https://www.statista.com/statistics/541390/global-sales-of-
plug-in-electric-vehicle-manufacturers/#statisticContainer
5. Tesla, “Tesla Fourth Quarter & Full Year 2021 Update” (PDF). 2022. Online: http://ir.tesla.
com/
6. Form 10-K to Tesla. (n.d.). the United States Securities and Exchange Commission. Retrieved
May 15, 2022, from https://www.sec.gov/Archives/edgar/data/1318605/000095017022000
796/tsla-20211231.htm
7. Silva Jacques, K., Duarte Couto Fernandes, V., de Melo Queiroz, L., & Ferreira da Cunha,
M. (2021). What is the value of the company? The valuation case of Magazine Luiza.
RevistaAmbiente Contábil, vol. 13(1), pp. 359–377.
8. Copeland, T. E., Koller, T., & Murrin, J. (2006). Avaliação de empresas-valuation: calculando
e gerenciando o valor das empresas. Pearson Makron Books.
9. Rotkowski, A. & Clough, E. How to Estimate the Long-Term Growth Rate in the Discounted
Cash Flow Method. Insights, 2013, pp. 9–20.
10. Berry, S. G., Betterton, C. E., & Karagiannidis, I. Understanding Weighted Average Cost
of Capital: A Pedagogical Application. Journal of Financial Education, vol. 40(1/2), 2014,
pp. 115–136. http://www.jstor.org/stable/24331031
11. Loveday, S. (2022, January 18). Tesla’s FSD subscription unchanged while package price
increases. InsideEVs. Retrieved March 21, 2022, from https://insideevs.com/news/561604/
Tesla-fsd-subscription-unchanged/
12. Tesla’s energy revenue, Gross Margin and growth rates (2022). Fundamental Data And Statis-
tics For Stocks. Retrieved March 6, 2022, from https://stockdividendscreener.com/auto-man
ufacturers/Tesla-energy-products-revenue/
13. Kane, M. (2022, January 27). Tesla Q4 2021 final EV delivery numbers and outlook.
InsideEVs. Retrieved March 6, 2022, from https://insideevs.com/news/563407/Tesla-2021q4-
final-delivery-numbers/
14. Lynch, A. (2022, March 3). Car Insurance Rate Increases. Retrieved March 6, 2022, from
https://www.thezebra.com/auto-insurance/how-to-shop/car-insurance-rate-increases/
15. ValueInvesting. (n.d.). Discounted cash flows and WACC (TSLA). Retrieved May 15, 2022,
from https://valueinvesting.io/TSLA/valuation/dcf-growth-exit-5y
16. WSJ|Market (n.d.). Tsla | Tesla Inc.. annual cash flow - WSJ. The Wall Street Journal. Retrieved
May 15, 2022, from https://www.wsj.com/market-data/quotes/TSLA/financials/annual/cash-
flowApplication and Feasibility Analysis of DCF Model 1023
17. Tesla (TSLA) - market capitalization. (n.d.). CompaniesMarketCap. Retrieved May 15, 2022,
from https://companiesmarketcap.com/tesla/marketcap/
18. Isidore, C. (2021, October 26). Tesla is now worth more than $1 trillion. CNN. Retrieved
April 10, 2022, from https://www.cnn.com/2021/10/25/investing/Tesla-stock-trillion-dollar-
market-cap/index.html
19. Loveday, S. (2022, March 14). Panasonic Energy CEO shares info about Tesla’s 4680 Battery
Cells. InsideEVs. Retrieved April 10, 2022, from https://insideevs.com/news/573347/Tesla-
4680-battery-panasonic-insight/
20. Ewing, J. (2022, April 8). Tesla will sell its long-awaited Cybertruck next year, Elon Musk
says. The New York Times. Retrieved April 10, 2022, from https://www.nytimes.com/2022/
04/08/business/Tesla-cybertruck-elon-musk.html
21. Segal, T. (2022, February 8). Top 3 pitfalls of Discounted Cash Flow Analysis. Investope-
dia. Retrieved April 11, 2022, from https://www.investopedia.com/investing/pitfalls-of-dis
counted-cash-flow-analysis/
22. Fernández, P. WACC: Definition, Misconceptions, and Errors. Business Valuation Review.
vol. 29 (4), 2010, pp. 138–144.
Open Access This chapter is licensed under the terms of the Creative Commons Attribution-
NonCommercial 4.0 International License (http://creativecommons.org/licenses/by-nc/4.0/),
which permits any noncommercial use, sharing, adaptation, distribution and reproduction in any
medium or format, as long as you give appropriate credit to the original author(s) and the source,
provide a link to the Creative Commons license and indicate if changes were made.
The images or other third party material in this chapter are included in the chapter’s Creative
Commons license, unless indicated otherwise in a credit line to the material. If material is not
included in the chapter’s Creative Commons license and your intended use is not permitted by
statutory regulation or exceeds the permitted use, you will need to obtain permission directly from
the copyright holder.You can also read