Appendix A Discrimination Experienced by Immigrants, Visible Minorities, and Indigenous Peoples in London and Middlesex
←
→
Page content transcription
If your browser does not render page correctly, please read the page content below
Appendix A

Discrimination Experienced by Immigrants, Visible
       Minorities, and Indigenous Peoples
            in London and Middlesex
       An Empirical Study by the London & Middlesex
              Local Immigration Partnership

        Mamta Vaswani, Ph.D. and Victoria M. Esses, Ph.D.
 Network for Economic and Social Trends (NEST), Western University

                           August, 2021
Acknowledgments

We would like to express our appreciation to the Southwestern Ontario Local Immigration
Partnerships Discrimination Survey Working Group for their collaboration on this project. We
would also like to express our gratitude to Dr. Zenaida R. Ravanera, Shelley Hill and Tehya
Quachegan for their input. Additionally, we would like to thank Annie Liu for her help preparing
portions of this report.
i

                                                         Table of Contents

Executive Summary ............................................................................................................... 1

Overview............................................................................................................................... 3

Discrimination ....................................................................................................................... 4

Discrimination in Canada ....................................................................................................... 4

Correlates and Consequences of Experiences of Discrimination .............................................. 7

London-Middlesex ................................................................................................................. 8

   London-Middlesex’s Sociocultural Context ................................................................................ 8

   Discrimination in London-Middlesex ........................................................................................ 11

Study on Experiences of Discrimination in London-Middlesex .............................................. 13

Profile of Respondents ........................................................................................................ 14

   Respondent Demographics ....................................................................................................... 15

Experiences of Discrimination .............................................................................................. 20

   To what extent have Immigrants & Visible Minorities, Indigenous Peoples, and comparison
   White Non-immigrants experienced discrimination in London-Middlesex in the past three
   years? ........................................................................................................................................ 20

   Within the three groups, to what extent do experiences of discrimination differ as a function
   of demographic characteristics? ............................................................................................... 20

       The role of gender................................................................................................................. 20

       The role of age ...................................................................................................................... 22

       The role of employment status ............................................................................................ 23

       The role of education level ................................................................................................... 24

       The role of annual household income .................................................................................. 25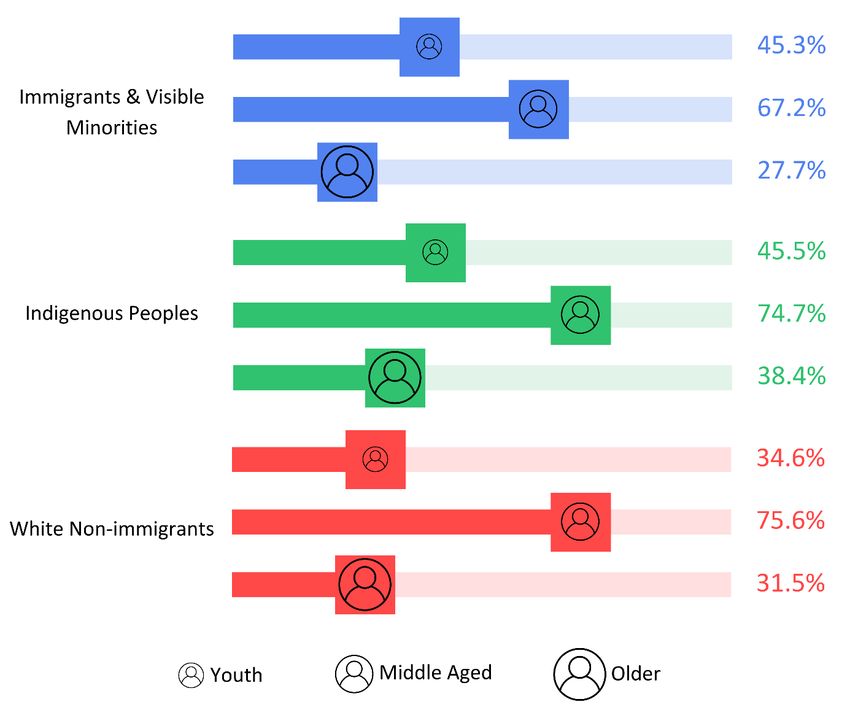
ii

      The role of length of time residing in London-Middlesex .................................................... 26

      Immigrants and visible minorities: The role of religion ........................................................ 27

      Immigrants and visible minorities: The role of ethnicity/race ............................................. 27

      Immigrants and visible minorities: The role of immigrant and visible minority status........ 28

      Immigrants: The role of current immigration status ............................................................ 29

      Immigrants: The role of length of time in Canada ................................................................ 29

   In how many contexts is discrimination being experienced? ................................................... 30

   In what contexts is discrimination being experienced? ........................................................... 30

   What are the presumed bases of experiences of discrimination? ........................................... 34

   Are specific types of discrimination being experienced? ......................................................... 37

   Who are the perpetrators of discrimination?........................................................................... 38

      Perpetrator age ..................................................................................................................... 39

      Perpetrator gender ............................................................................................................... 40

      Perpetrator race or ethnicity ................................................................................................ 41

   Have experiences of discrimination increased or decreased during the COVID-19
   pandemic? ................................................................................................................................. 44

Potential Coping Strategies and Emotions in Response to Discrimination ............................. 45

   What coping strategies are used in response to discrimination? ............................................ 45

   What feelings are elicited by experiences of discrimination? .................................................. 46

   How much psychological distress is experienced in response to discrimination? ................... 47

London-Middlesex as a Welcoming Community ................................................................... 48

Summary of Findings ........................................................................................................... 49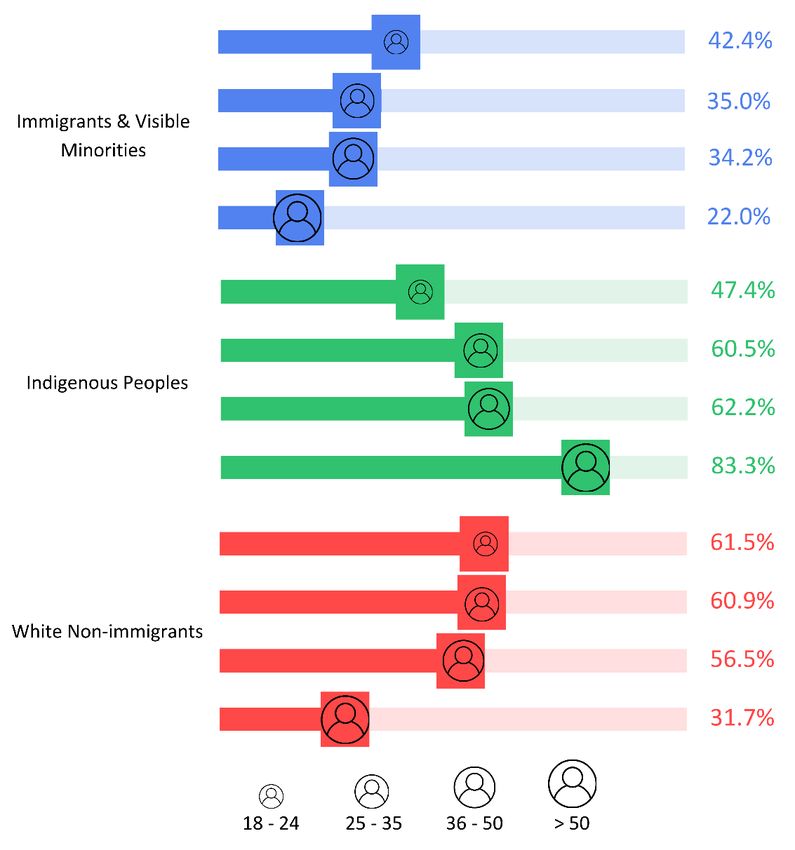
iii

   Immigrants & Visible Minorities ............................................................................................... 49

   Indigenous Peoples ................................................................................................................... 49

   Comparison White Non-immigrants ......................................................................................... 50

Methodological Strengths and Limitations ........................................................................... 51

Recommendations .............................................................................................................. 52

   #1: Promote an environment that encourages victims of discrimination to report their
   experiences ............................................................................................................................... 52

   #2: Help victims of discrimination to use effective coping strategies ...................................... 53

   #3: Engage in effective initiatives to prevent and reduce discrimination ................................ 53

References .......................................................................................................................... 58

Appendix: Survey on Experiences of Discrimination in London-Middlesex ............................ 72
1

                                         Executive Summary

This report provides insight into the discrimination experiences of immigrants, visible minorities,
and Indigenous Peoples in London-Middlesex in order to support the development of evidence-
based anti-discrimination initiatives at the local level. To this end, a representative survey (N =
829) was conducted in March 2021 to examine the extent and context of discrimination
experienced by immigrants, visible minorities, and Indigenous Peoples in London-Middlesex, in
comparison to people who are not members of these groups. The survey also investigated the
presumed basis for this discrimination, who is perpetrating these acts of discrimination, and
whether specific forms of discrimination are taking place. In addition, the survey examined how
individuals respond to these experiences of discrimination, including how they cope with
discrimination and feel about it, and their more general feelings of acceptance and welcome in
the community.

A methodological strength of this research was the targeting of substantial numbers of
immigrants, visible minorities, and Indigenous Peoples for inclusion, and the recruitment
procedure that used random digit dialing, ensuring relatively representative samples. Immigrants
and visible minorities were combined for the majority of analyses because of the substantial
overlap between these two groups in London-Middlesex (though we of course acknowledge that
not all immigrants in London-Middlesex are visible minorities and not all visible minorities in
London-Middlesex are immigrants). In our Immigrants & Visible Minorities group, over 60% of
respondents were both immigrants and visible minorities.

The results show that approximately 6 out of 10 Indigenous Peoples reported experiencing
discrimination in London-Middlesex in the last three years compared to about 4 out of 10
Immigrants & Visible Minorities and comparison White Non-immigrants. Immigrants & Visible
Minorities and Indigenous Peoples perceived their experiences of discrimination as based on
ethnocultural factors related to different minority group statuses (e.g., race or skin colour,
indigenous identity, ethnicity or culture). In contrast, comparison White Non-immigrants tended
to perceive their experiences of discrimination as based on more universal factors (e.g., gender,
age, physical appearance, income level).

On average, Indigenous Peoples reported experiencing discrimination in more contexts than
Immigrants & Visible Minorities and White Non-immigrants. In both the Immigrants & Visible
Minorities group and the Indigenous Peoples group, contexts for discrimination that were most
frequently indicated included when applying for a job or promotion, at their job (e.g., from
supervisors, co-workers, clients), while using public transit (e.g., buses, trains or taxis), in a store,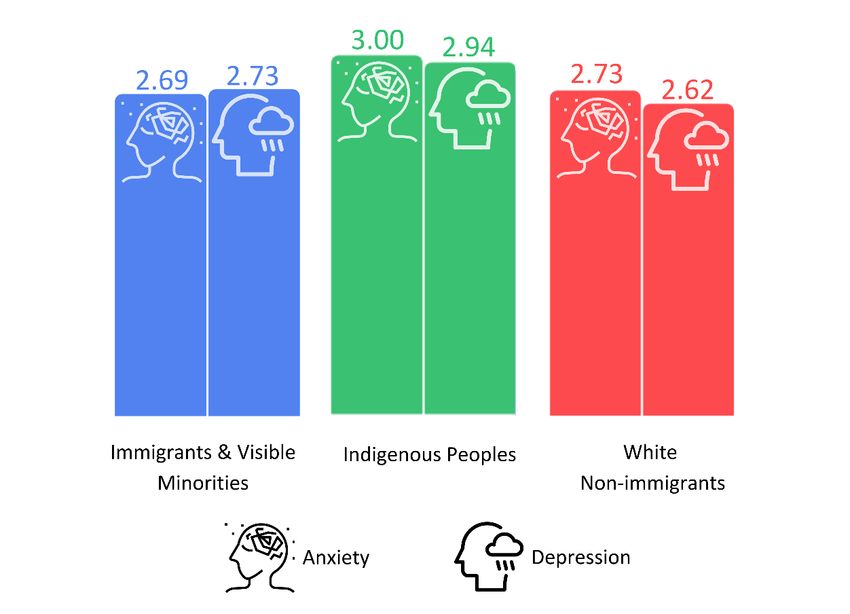
2

bank, or restaurant, and when attending school or classes. For Indigenous Peoples, a top context
for experiencing discrimination was also while using public areas such as parks and sidewalks.

In terms of specific types of discrimination that were experienced, from the list provided,
respondents in all three groups were most likely to indicate inappropriate jokes, derogatory
language, and verbal abuse. Immigrants & Visible Minorities also reported experiencing verbal
threat, and Indigenous Peoples also reported experiencing physical threat. Furthermore, in all
three groups, respondents identified perpetrators as male and female, although females were
mentioned more often than males by Immigrants & Visible Minorities, whereas males were
mentioned more often than females by Indigenous Peoples and White Non-immigrants. Also,
perpetrators were most commonly reported to be middle aged and White.

In all three groups, respondents reported that experiencing discrimination was more likely to
lead to feelings of discouragement, exclusion, and powerlessness than shame. On average,
respondents in all three groups also reported experiencing anxiety and depression to some
extent as a result of their discrimination experiences. Of note, however, Indigenous Peoples
tended to experience more negative emotions and psychological distress than respondents in
the other two groups. To cope with their discrimination experiences, respondents reported using
both active and passive coping strategies, though they tended to use passive coping strategies
more. Finally, White Non-immigrants tended to report, on average, higher feelings of acceptance
and welcome in London-Middlesex than the other two groups.

Recommendations for counteracting this discrimination focus on three areas. First, it is important
to promote an environment that encourages victims of discrimination to report their
experiences. Only experiences that are acknowledged can be addressed. Second, the findings
suggest that it is important to help victims of discrimination to use effective coping strategies so
that they do not internalize the discrimination that they experience. As a primary focus of the
recommendations, the third recommendation focuses on strategies for preventing and
counteracting the discrimination reported in London-Middlesex. These strategies should take
into account the findings of the current research in terms of the context and nature of
discrimination in London-Middlesex, as well as the research literature on effective anti-
discrimination strategies. In this way, London-Middlesex can work toward becoming a more
welcoming community in which all groups are treated with respect, and discriminatory treatment
becomes an exception rather than an everyday occurrence for members of certain groups.
3

    Discrimination Experienced by Immigrants, Visible Minorities, and Indigenous
                          Peoples in London and Middlesex

         An Empirical Study by the London & Middlesex Local Immigration Partnership

                                                   Overview

This report describes the results of a representative survey (March 2021, N = 829) examining
discrimination experienced by immigrants, visible minorities1, and Indigenous Peoples in London-
Middlesex. Although there have been a number of previous large-scale national surveys on
discrimination conducted in Canada (e.g., Environics Institute, 2010; Ibrahim, 2018), small sample
sizes at the local level have precluded the ability to examine results of these surveys for specific
communities outside of the large metropolises. The study described in this report fills this gap by
examining local experiences of discrimination within the London-Middlesex area. Gaining insight
into these experiences is crucial as a basis for developing anti-discrimination evidence-informed
initiatives for the community that target where discrimination is occurring, who is most likely to
be perpetrating and experiencing discrimination, and how to reduce its negative impact. These
anti-discrimination initiatives would help make London-Middlesex a more just and equitable
community, and would protect its residents from the harmful negative outcomes that
experiencing discrimination can produce. Additionally, relationships between people of different
groups would be improved as a result of anti-discrimination initiatives, making London-Middlesex
a more neighbourly community. Furthermore, anti-discrimination initiatives would help make
London-Middlesex a more welcoming community that could attract, integrate, and retain diverse
individuals, an integral part of Canada’s strategy to sustain the economy (Government of Canada,
2020; Morency et al., 2017).

The study described in this report examined the extent and context of discrimination experienced
by immigrants, visible minorities, and Indigenous Peoples in comparison to people who are not
members of these groups, whether specific forms of discriminations are being experienced, the
presumed basis for this discrimination and its perpetrators, and how targets of discrimination
respond to these experiences (how they cope with those experiences and feel about them). In

1
  This report uses the term ‘visible minorities’ as utilized by Statistics Canada (2020a). However, we acknowledge
that in the current discourse, the term racialized persons may be preferred in public discussions of the findings.
Indigenous Peoples are not included in this category.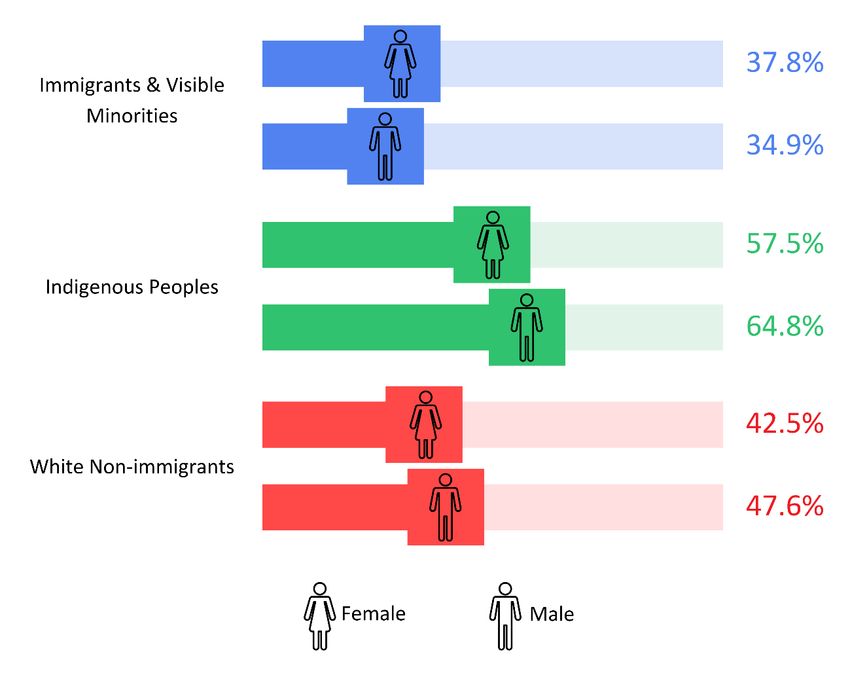
4

the following sections we provide background and context for the need for this research, describe
the results of the survey, and provide recommendations that are informed by these results.

                                         Discrimination

Discrimination refers to inappropriate and unfair treatment of people simply because they
belong to certain groups. Discrimination includes both negative behaviour toward a member of
another group based on their group membership, and less positive behaviour toward them than
toward a member of one’s own group in comparable situations (Dovidio et al., 2010).
Discriminatory treatment can occur as a result of cultural understandings, policies, and practices
that deny members of certain groups equal treatment, referred to as institutional discrimination
(Dovidio et al., 2010). For instance, European understandings, policies, and practices related to
governance, land ownership, and education have resulted in significant mistreatment and
injustice experienced by Indigenous Peoples throughout Canada’s history, the impact of which
still persist today (Neylan, 2018). Additionally, immigration related policies and practices have
historically denied or made it difficult for people from visible minority groups to enter Canada
(Dench, 2000). These examples of unfair treatment towards immigrants, visible minorities, and
Indigenous Peoples describe how institutional discrimination can become a systemic form of
mistreatment experienced by people who belong to certain minority groups.

Discrimination also occurs between individuals. At an individual level, discrimination refers to
behaviour that disproportionately favours or provides an advantage to people belonging to some
groups while disadvantaging or harming people belonging to other groups (Dovidio et al., 2010).
Discriminatory behaviour can be overt or take more subtle forms. Overt forms of discrimination
are clearly recognizable as unfair, are generally viewed as unacceptable, are often unlawful, and
are for the most part intentional (e.g., verbal and physical assault; Jones et al., 2016). Subtle
forms of discrimination (e.g., being avoided or ignored, inappropriate jokes; Jones et al., 2016)
can appear as though they are harmless, can be viewed as acceptable, are typically lawful, and
are more likely to be seen as unintentional. Therefore, people may experience discrimination in
a variety of ways: through institutional systems as well as through overt and subtle discriminatory
behaviour perpetrated by individuals.

                                    Discrimination in Canada

In Canada, immigrants, visible minorities, and Indigenous Peoples tend to experience
discriminatory behaviour on an individual level, and unequal access to employment, housing,
education, and private and public services on a more systemic level (Environics Institute, 2010;
Environics Institute for Survey Research, 2019; Esses, 2021). These experiences are based on a
variety of factors including their ethnicity, race, and religion, factors which typically do not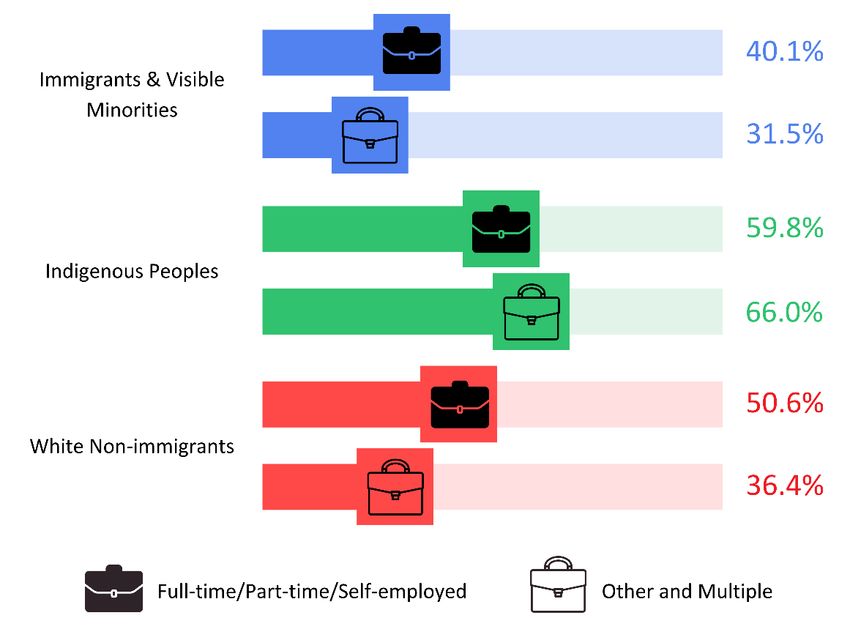
5

disadvantage their native-born White counterparts. Furthermore, they experience discrimination
across a variety of settings as they attempt to engage in day-to-day life such as when walking in
the streets, using public transit, frequenting stores and restaurants, in the workplace, in
educational settings, when accessing health care, when engaging with the police and criminal
justice system, when attempting to rent places to live, and when travelling across borders and
through airports (Environics Institute for Survey Research, 2019; Nangia, 2013; Novac et al.,
2002). A recent national study revealed that the majority of Indigenous (53%) and Black (54%)
Canadians have personally experienced discrimination based on their race or ethnicity, with
South Asian (38%) and Chinese (36%) Canadians, and Canadians of other racialized groups (32%)
also reporting experiences of discrimination (Environics Institute for Survey Research, 2019).

Discrimination experienced by immigrants, visible minorities, and Indigenous Peoples has
unfortunately been on the rise over the last decade. For instance, hate crimes (criminal offenses
motivated by hate that target specific populations such as particular ethnic, racial, and religious
groups) have been increasing. Data collected by Statistics Canada reveal that approximately
2,000 hate crimes in Canada were noted by police in 2019, a marked increase from the
approximately 1,200 noted in 2013 (Moreau, 2021). Of the hate crimes reported in 2019, most
(46%) were motivated by hate based on race or ethnicity, followed by a large portion (32%)
motivated by religion. The data also reveal that the most common types of hate crimes being
committed include general mischief, uttering threats, and assault. Additionally, the data reveal
that Black and Jewish people are the targets of most hate crimes, while Indigenous youth are the
youngest population to be victims and to sustain injuries from the incidents. Furthermore, the
data reveal that hate crimes targeting Arab or West Asian populations, the Black population, and
Muslims are on the rise. These hate crimes tend to occur in public spaces such as the street or
parks, educational and religious institutions, and commercial businesses (Moreau, 2021).

Hate-based behaviours are also prevalent on social media. A recent study conducted for the
Canadian Race Relations Foundation revealed that Canadians are concerned about hate speech
occurring online and would like to see more being done to address the issue (Abacus Data, 2021).
In that study, racialized people were found to experience online hate more so than non-racialized
people. Results of that study also revealed that online hate was occurring in the form of offensive
name calling, racist comments, comments inciting violence, and threats of physical harm.
Similarly, data collected by Statistics Canada reveal that online hate crimes tend to target Muslim,
Jewish, and Black populations and tend to occur in the form of uttering threats, public incitement
of hatred, and harassment (Moreau, 2021).

Immigrants, visible minorities, and Indigenous Peoples in Canada also experience everyday
discrimination as they attempt to build secure lives. In the context of employment, immigrants
6

who do not have English sounding names, who are religious minorities (e.g., Muslim), and who
are visible minorities (e.g., Black, South Asian), are given fewer opportunities to interview for
jobs, and when they do interview, they are evaluated less favourably than Canadian-born
applicants (Esses et al., 2014; Oreopoulos, 2011). Similarly, the results of a large-scale Canadian
survey conducted by Statistics Canada revealed that immigrants tend to experience
discrimination at their places of work and when applying for a job or a promotion (Ibrahim, 2018).
Immigrants, visible minorities, and Indigenous Peoples also experience discrimination when
attempting to secure housing. A study conducted by researchers in collaboration with the Canada
Mortgage and Housing Corporation found that immigrants, visible minorities, and Indigenous
Peoples tend to be denied access to rental units by landlords more often than White Canadian-
born people (Novac et al., 2002). Additionally, high-profile incidents highlight Indigenous
Peoples’ experiences of discrimination when attempting to access health care. Recently, one
Indigenous woman fell victim to demeaning racial slurs, swearing, and neglect from hospital staff
and ultimately passed away in their care (Shingler, 2020).

There is also evidence of systemic injustices and disadvantage experienced by immigrants, visible
minorities, and Indigenous Peoples in Canada. For instance, many immigrants are admitted into
Canada based on their skills and credentials; however, after they immigrate, their foreign
credentials and experience are often not recognized by employers and they often do not qualify
for licensure from Canadian regulatory bodies (Ertorer, et al., 2020; Ng & Gagnon, 2020). That
lack of recognition leaves immigrants unemployed or underemployed (i.e., in jobs for which they
are overqualified), particularly if they are visible minorities (Esses et al., 2007; Ng & Gagnon,
2020). Rooted in a long history of oppression, Black and Indigenous populations tend to be
disproportionately overrepresented in the criminal justice system, have poorer economic and
health conditions, and lower educational attainment (Truth and Reconciliation Commission of
Canada, 2015; United Nations Human Rights Council, 2017). Canada’s historical Indian residential
school policy physically removed Indigenous children from their homes and families in an attempt
to remove their Indigenous cultures and assimilate them to European ways of thinking and being,
and included experiences of psychological trauma and physical harm, resulting in substance
abuse, poor family dynamics, violence, and self-harm passed down over generations (Loppie et
al., 2014; Palmater, 2014).

A recent Statistics Canada survey (2020b) revealed that immigrants, visible minorities, and
Indigenous Peoples reported experiencing more discrimination during the COVID-19 pandemic
than the average reported incidents by all respondents. Again, these incidents were often based
on race, ethnicity, and culture. Most incidents of discrimination experienced by these groups
occurred when frequenting a store, bank, or restaurant, while at work or when applying for a job,
and when walking on sidewalks or at parks. The COVID-19 pandemic has also resulted in
7

increased anti-Asian discrimination in Canada. The Chinese Canadian National Council Toronto
Chapter received 1,150 reports of racist attacks targeting the Asian community between March
2020 and February 2021 (Kong et al., 2020). Of the incidents included in the analyses (643
incidents reported between March 2020 and December 2021) most occurred in public spaces,
parks, streets, or sidewalks, and in grocery stores and restaurants in Ontario and British
Columbia. Most incidents took the form of verbal and physical assaults, unwanted physical
contact, as well as being coughed at or spit on. A qualitative analysis of the reported incidents
revealed that many of these attacks were perpetrated in a blatant and ruthless manner, were
instigated by blame for the COVID-19 pandemic, targeted vulnerable people (the elderly and
youth), and caused severe physical and psychological harm. The COVID-19 pandemic has also
highlighted the rise of Islamophobia in Canada. Recently, the media has covered alarming forms
of discrimination against Muslims including brutal physical attacks (e.g., a Muslim woman
wearing a hijab having a gun shot at her; Baig, 2021). These findings reveal how experiences of
discrimination can increase in frequency and severity in response to contextual factors, and how
the specific groups that become targets of discrimination can vary, leaving them vulnerable to
and unprepared for the negative consequences of such experiences.

                Correlates and Consequences of Experiences of Discrimination

Experiences of discrimination leave victims feeling as though they are not welcome and do not
belong in the community, are associated with mistrust of and a lack of confidence in institutions,
and are associated with poor physical and mental health. For instance, discrimination has been
found to be associated with a lower sense of belonging to London and to Canada among
immigrants and visible minorities (Huot, et al., 2014; Painter, 2013; Reitz & Banerjee, 2007).
Results of a recent study conducted by Statistics Canada (2020b) suggest that experiences of
discrimination are also associated with mistrust and less confidence in institutions. In that study,
experiencing discrimination was associated with less trust in the court system among Indigenous
Peoples. Similarly, experiencing discrimination was associated with less confidence in the police
among Black respondents.

Discrimination experienced by immigrants, visible minorities, and Indigenous Peoples has also
been associated with poor physical health and psychological distress (Currie et al., 2012; Spence
et al., 2016; Williams et al., 2003). For instance, Spence and colleagues (2016) found that
experiences of discrimination were associated with stress among a community sample of
Indigenous Peoples in Canada. Similarly, in a qualitative study, Currie and colleagues (2012) found
that Indigenous university students in Canada described experiencing distress including
frustration, helplessness, and hopelessness because of experiences of discrimination.
Additionally, in a large-scale review of empirical research on the impact of discrimination,
8
Williams and colleagues (2003) found strong evidence suggesting that experiences of
discrimination are associated with psychological distress including depression and anxiety among
immigrants and visible minorities.
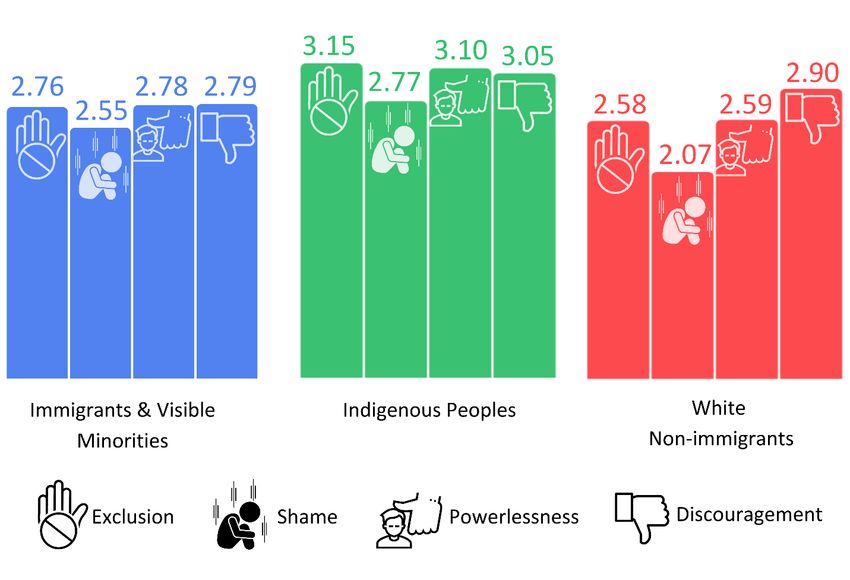
There is also some evidence to suggest that discrimination is associated with psychological
distress through different ways of thinking about and responding to those negative experiences
(Noh et al., 1999, 2007; Noh & Kaspar, 2003). For instance, perceptions of exclusion,
powerlessness, shame, and discouragement can intensify the association between discrimination
and psychological distress (Noh et al., 2007). These negative outcomes of discrimination can
therefore make it difficult for immigrants, visible minorities, and Indigenous Peoples to enjoy a
healthy, happy, and satisfying life.
London-Middlesex
The study described in this report was conducted to examine everyday experiences of
discrimination in London-Middlesex, located in Southwestern Ontario. The London-Middlesex
area comprises the City of London as well as other smaller surrounding communities in Middlesex
County (e.g., Strathroy, Lucan, Dorchester, Glencoe). It is a mid-sized area that is home to
innovative and reputable health care services and facilities, excellent post-secondary education
and research facilities, and diverse industry. However, London-Middlesex also offers the
advantages of living in smaller communities such as affordability, short commute times within
the area, and outdoor recreation and natural spaces.
London-Middlesex’s Sociocultural Context
London-Middlesex is the original Lands of the Anishinaabe, Haudenosaunee, Attawandaron
(Neutral), and Wendat Peoples. It was later occupied by British settlers in the early 1800s, and
shortly after also became home to Irish and some Black residents, most of whom escaped slavery
from the United States (Bradford & Esses, 2012; Henry, 2010). Up until the early 1960s, the
cultural composition of London-Middlesex was predominantly White people of European
descent, as was the case in the rest of Canada (Banting & Kymlicka, 2003; Boyd & Vickers, 2000;
Bradford & Esses, 2012). However, with changes to federal immigration policies in the late 1960s
that removed barriers faced by people from non-European countries trying to enter Canada (i.e.,
Canada’s Immigration Act, 1967), not only did London-Middlesex begin to receive more
immigrants, but the cultural composition of London-Middlesex started to become more diverse
(Bradford & Esses, 2012). This increasing cultural diversity is a result of more newcomers
immigrating from non-European countries over the past few decades.9
Immigrant Population in London-Middlesex (Middlesex County Census Division) by Census Year
from 1981 to 2016.
Immigrant Population by Census Year
100,000
75,000
50,000
25,000
0
1981 1986 1991 1996 2001 2006 2011 2016
Source: Statistics Canada (1981, 1986, 1991, 1996, 2001, 2006, 2013, 2017a).
The 2016 Census indicates that the total London-Middlesex population is approximately 455,500
people (Statistics Canada, 2017a), the majority of whom (approximately 384,000) reside in the
City of London (Statistics Canada, 2017b). London-Middlesex continues to be home to
approximately 11,000 Indigenous Peoples (First Nations, Métis, and Inuit) including the Oneida
Nation of the Thames, Chippewas of the Thames First Nation, and Munsee-Delaware Nation
communities (Statistics Canada, 2017a). As with the general population, the majority of the
Indigenous population (approximately 9,700) also resides in the City of London (Statistics Canada,
2017b).2 The London-Middlesex population also comprises approximately 91,000 immigrants and
approximately 76,500 visible minority group members (Statistics Canada, 2017a). Again, the
majority of the immigrant population (approximately 83,800) and the majority of the visible
minority population (approximately 75,000) reside in the City of London (Statistics Canada,
2017b). In 2016 more than half of the immigrant population was born outside of Europe, with
approximately 60% of those born outside Europe being born in Asia, in countries such as China,
India, Iraq, and the Philippines (Statistics Canada, 2017a). London-Middlesex’s visible minority
population has also been increasing, with the largest visible minority groups in 2016 being Arab,
South Asian, Black, Chinese, and Latin American (Statistics Canada, 2017a).
2
These numbers for the Indigenous population are likely vastly under-estimated, however, because of incomplete
enumeration in the census (Statistics Canada, 2017a).10
Region of Birth for Immigrants Residing in London-Middlesex (Middlesex County Census Division)
by Census Year from 1981 to 2016.
Immigrant Region of Birth by Census Year
50,000
40,000
30,000
20,000
10,000
0
1981 1986 1991 1996 2001 2006 2011 2016
Europe Americas Asia Africa Oceania & Other
Source: Statistics Canada (1981, 1986, 1991, 1996, 2001, 2006, 2013, 2017a).
Visible Minority Population in London-Middlesex (Middlesex County Census Division) by Census
Year from 2001 to 2016.
Visible Minority Population by Census Year
15,000
10,000
5,000
0
2001 2006 2011 2016
Source: Statistics Canada (2002, 2006, 2013, 2017a).11 Discrimination in London-Middlesex Recent media coverage has highlighted local incidents of discrimination experienced by members of some minority groups. Recently, an Indigenous woman reported having her Indian status card refused when attempting to purchase goods at a local retail store (Lamberink, 2020). One man reports being constantly stared at when shopping because of his Indigenous appearance (Butler, 2019). Another man of Indigenous and European ancestry reported not being invited for job interviews when he disclosed his Indigenous identity but being invited for job interviews when he hid his Indigenous identity (Butler, 2019). He also reported experiencing overt racism from a police officer who explicitly stated that he considered the man to be a criminal based solely on his Indigenous identity. In another incident, a visible minority man was physically blocked from leaving a large grocery store by another shopper who suggested that he was in the country illegally (Carbone, 2018). In yet another incident, two Muslim women reported being told by a fellow shopper at a large retail outlet to “go back to” where it was assumed their ancestry originated, likely motivated by the religious head coverings the two women were wearing (Rodriguez, 2020). Most disturbing, in the spring of 2021 (after the current survey was conducted) an explicit and fatal act of hate toward a religious and visible minority family who were Pakistani Muslims occurred in London. That incident involved a young man driving a truck into a family of five who were simply out for a walk on a Sunday evening, resulting in four deaths and leaving a young boy seriously injured and orphaned (CBC News, 2021). Members of the London-Middlesex Black community have also fallen victim to incidents of discrimination. One man reported that someone yelled racial slurs at him while he was simply walking in public to a job interview (Van Brenk, 2016). Similarly, in the academic setting, young Black students have been exposed to racial slurs and made to feel as though they are inferior (CBC News, 2020; Rivers, 2020; Rodriguez, 2019). Outside of formal classroom settings, several virtual cultural club meetings have been disrupted with anti-Black messages (Rivers, 2020). Incidents of discrimination have also been reported to occur in the political realm, with visible and religious minorities in London-Middlesex reporting being targets of racial slurs and having their property damaged during election campaigns (CTV London, 2015; Pearson, 2014; Van Brenk, 2016). One politician of Lebanese origin reported having his campaign signs burned and defaced with racial slurs (CTV London, 2015), while a Black Muslim politician reported having culturally offensive items being left at his doorstep (Pearson, 2014). Discrimination has also been reported on school campuses. For instance, in a campus climate survey, 38.8% of undergraduate university students and 23.8% of faculty members at Western
12

University reported experiencing racism (Western University’s Anti-Racism Working Group,
2020). Respondents of that survey identified a sense of disregard for the lives of Black people,
misperceptions about Indigenous Peoples, and assumptions about colonialism. Jewish students
reported seeing swastikas drawn throughout campus, and hearing statements diminishing the
extent of the Holocaust. Muslim and Jewish students reported not being accommodated to
observe their religions, such as not having dedicated prayer spaces on campus. Muslim female
students were particularly targeted with sexism, harassment, and racism (e.g., a professor
referring to a hijab as a “tea towel”). International students from Middle Eastern countries
reported being stereotyped and students from Asian countries reported being stigmatized in
relation to COVID-19. Prompting Western University’s campus climate survey, one student
experienced racist attacks online after revealing her experiences of racism on the university’s
campus.

It is clear that incidents of discrimination are occurring in the day-to-day lives of immigrants,
visible minorities, and Indigenous Peoples in London-Middlesex. In addition, an increasing
number of hate crimes have been reported in the London Census Metropolitan Area, with 45
reported by police services in 2020 compared to 17 in 2016 (Statistics Canada, 2021).

A key player in efforts to counteract racism and discrimination is the London & Middlesex Local
Immigration Partnership (LMLIP). The LMLIP was founded in 2009 and is funded by Immigration,
Refugees and Citizenship Canada. It is one of over 80 Local Immigration Partnerships now
operating across the country with the goals of improving coordination of services to facilitate
immigrant settlement and integration, facilitating community knowledge sharing and local
strategic planning, and promoting more welcoming communities for newcomers. As such, the
LMLIP works to create a welcoming and inclusive sociocultural environment including through
various anti-racism and anti-discrimination initiatives. The study described in this report is part
of the LMLIP’s anti-racism and anti-discrimination work to promote a more welcoming
community in London-Middlesex.
13

                 Study on Experiences of Discrimination in London-Middlesex

Although there is evidence that discrimination takes place in London-Middlesex, and indeed
experiences of discrimination in the London-Middlesex area are being brought to light through
the media and official hate crime statistics, a comprehensive understanding of these experiences
is lacking. Such an understanding is crucial for effective evidence-informed anti-discrimination
initiatives to be developed. Thus, the goal of this study was to systematically examine
discrimination experienced by immigrants, visible minorities, and Indigenous Peoples (in
comparison to individuals who do not belong to these groups) in London-Middlesex through a
representative survey conducted in March 2021. The survey examined who is experiencing
discrimination, in what contexts, on what basis, who is perpetrating these acts of discrimination,
and whether specific forms of discrimination are taking place. The study also examined how
immigrants, visible minorities, and Indigenous Peoples respond to these experiences of
discrimination (coping strategies and feelings of psychological distress), and associated feelings
of being accepted and welcomed in the community. It is important to note that the survey was
conducted prior to the act of hate against Muslim visibility minorities in London in which four
innocent individuals were killed.

A community sample of London-Middlesex residents was recruited to take part in the study,
including people who identify as (a) immigrants or visible minorities (Immigrants & Visible
Minorities group), (b) Indigenous (Indigenous Peoples group), and (c) residents who do not
identify with any of these groups (comparison White Non-immigrants group). The immigrants
and visible minorities were combined for our target numbers and for the majority of analyses
because of the substantial overlap between these two groups in London-Middlesex (though we
of course acknowledge that not all immigrants in London-Middlesex are visible minorities and
not all visible minorities in London-Middlesex are immigrants). Where possible, analyses were
conducted in which we separated immigrant-visible minorities, immigrant-not visible minorities,
and visible minorities-not immigrants.

Forum Research Inc., a market research firm, was retained by the London & Middlesex Local
Immigration Partnership to recruit participants, administer the survey, and collect the data. The
research was conducted through random digit dialing of phone numbers in the region, and if
individuals then qualified to participate and agreed, they were sent the link to the online survey
via SMS text message or email. Targets of 300 Immigrants & Visible Minorities, 200 Indigenous
Peoples, and 300 White Non-immigrants were set, and the final sample included 379 Immigrants
& Visible Minorities, 164 Indigenous Peoples, and 286 White Non-immigrants. This ensured a
relatively representative sample of participants within each of the three groups. The survey took
14
approximately 10 minutes to complete, and was available in both English and French. Ethics
approval for this study was obtained from Western University’s research ethics board.
The survey included questions about whether respondents had experienced discrimination or
been treated unfairly in the past three years in different contexts (e.g., in a store, bank, or
restaurant; when applying for a job or promotion), the presumed basis of this discrimination (e.g.,
race or skin colour, status as an immigrant, accent, gender), whether the respondents had
experienced specific types of discrimination (e.g., inappropriate jokes, verbal abuse), and who
the main perpetrators of this discrimination were (gender, age, race or ethnicity). One question
asked respondents whether their experiences of discrimination have changed during the COVID-
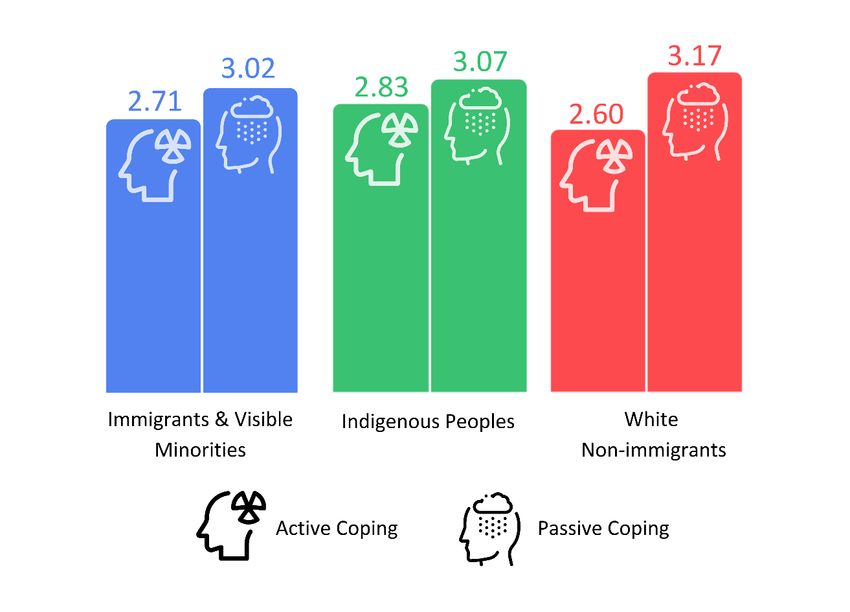
19 pandemic. The survey also asked how people coped with (active and passive coping) and felt
about (powerless, shame, excluded, discouraged) their experiences of discrimination, and their
psychological distress (anxiety and depression) in response to discrimination in the past three
years. Questions about how accepted and welcomed participants felt in London-Middlesex at the
present time were also asked. Finally, a set of demographic questions were included. The survey
was based on established measures where available, with the language adapted to plain language
(for full details on the measures, see the attached Appendix).
Profile of Respondents
Immigrants & Visible Minorities reported speaking languages other than English more and
reported more diverse religions than Indigenous Peoples and White Non-immigrants. Immigrants
& Visible Minorities also tended to be more highly educated. Despite this, Immigrants & Visible
Minorities, and Indigenous Peoples, reported lower annual household incomes than White Non-
immigrants. Additionally, White Non-immigrants tended to be on average quite a bit older, more
likely to be female, less likely to be employed, and to have resided in London-Middlesex longer
than Immigrants & Visible Minorities and Indigenous Peoples.
In terms of the specific characteristics of Immigrants & Visible Minorities, members of this group
were most likely to be Christian, Muslim, Hindu, or have no religion. They were most likely to be
East Asian and Southeast Asian, South Asian, Black, or other/multiple ethnicities. Close to 70%
were not born in Canada. When immigrant status and visible minority status were separated, just
over 60% were both immigrants and visible minorities, over 30% were non-immigrant visible
minorities, and only 7% were immigrants but not visible minorities. Most of the immigrants
entered Canada as economic immigrants, and the majority were now permanent residents or
citizens of Canada. Close to 75% had been in Canada 10 years or less.15
Respondent Demographics
Immigrants & Indigenous Comparison White
Visible Minorities Peoples Non-immigrants
(N = 379) (N = 164) (N = 286)
Gender
Female 49.6% 44.5% 63.3%
Male 49.1% 55.5% 36.0%
Non-binary 0.8% 0% 0.3%
No response 0.5% 0% 0.3%
Range: 18-79 Range: 19-67 Range: 18-84
Age
Average: 35 years Average: 34 years Average: 51 years
18 to 24 years 15.6% 11.6% 4.5%
25 to 35 years 46.7% 52.4% 16.1%
36 to 50 years 20.8% 27.4% 24.1%
Older than 50 10.8% 7.3% 50.7%
No response 6.1% 1.2% 4.5%
Language(s) Most Often Spoken at Home
English only 57.0% 86.0% 92.7%
English and another 23.7% 11.0% 2.8%
language
Another language only 18.7% 3.0% 4.2%
No response 0.5% 0% 0.3%
Employment Status
Employed full- 65.2% 71.3% 56.6%
time/part-time/self-
employed
Other employment 23.5% 22.0% 37.8%
(includes unemployed,
retired, student,
homemaker, and other)
Multiple employment 10.0% 6.7% 4.5%
statuses16
No response 1.3% 0% 1.0%
Education Level
Secondary/high school 17.4% 40.9% 28.3%
and less
College/vocational 29.0% 35.4% 36.7%
training
University 29.6% 17.1% 16.8%
undergraduate degree
University graduate 22.7% 6.7% 17.1%
degree and
Professional degree
No response 1.3% 0% 1.0%
Annual Household Income
Less than $45,000 36.4% 44.5% 22.0%
$45,001 to $80,000 36.4% 39.6% 31.5%
$80,001 and more 19.0% 14.6% 36.0%
No response 8.2% 1.2% 10.5%
Years Living in London- Range: 0-66 Range: 0-61 Range: 0-81
Middlesex Average: 8 years Average: 12 years Average: 32 years
Less than 5 years 50.1% 18.3% 11.9%
5 to 10 years 31.4% 36.0% 7.3%
10 to 20 years 10.3% 31.7% 12.6%
Longer than 20 years 7.9% 13.4% 68.2%
No response 0.3% 0.6% 0%
Religion
Christian 42.7% 23.8% 57.0%
Traditional/Spirituality 1.8% 36.0% 6.6%
No religion (atheist or 14.5% 28.7% 30.1%
agnostic)17
Other religion (includes 39.3% 9.1% 5.9%
Baha’i, Buddhist,
Hindu, Jewish,
Mennonite, Muslim,
Sikh, and other) and
multiple religious
categories
No response 1.6% 2.4% 0.3%
Sense of Belonging to Average: 3.54 Average: 3.51 Average: 3.43
Religious Group(s)
(Scale of Very Weak = 1 to
Very Strong = 5)
Religion of Immigrants & Visible Minorities
Christian 42.7%
Muslim 15.3%
Hindu 12.7%
Sikh 5.3%
No religion (atheist 14.5%
or agnostic)
Other religion 7.9%
(includes Baha’i,
Buddhist, Jewish,
Mennonite,
Traditional /
Spirituality, and
other) and multiple
religious categories
No response 1.6%
Race/Ethnicity
White 5.3% 0% 99.7%
First Nations, Métis, or 1.6% 95.1% 0%
Inuk (Inuit)
Visible minority, other, 93.1% 4.9% 0.3%
and multiple
races/ethnicities
No response 0% 0% 0%18
Sense of Belonging to Average: 3.61 Average: 3.82 Average: 3.91
Racial/Ethnic Group(s)
(Scale of Very Weak = 1 to
Very Strong = 5)
Race/Ethnicity of Immigrants & Visible Minorities
East Asian and 33.2%
Southeast Asian
South Asian 27.2%
Black 16.4%
White 5.3%
Other (includes 17.9%
Arab, Indigenous,
Latin American,
West Asian, or
other) and multiple
races/ethnicities
No response 0%
Born in Canada
Yes 30.6%
No 69.1%
No response 0.3%
Immigrant & Visible Minority Status
Immigrant visible 61.7%
minority
Non-immigrant visible 30.6%
minority
Immigrant non-visible 7.4%
minority
No response 0.3%
Immigrants: Status Upon Arrival to Canada
Economic class 46.6%
immigrant
Family class immigrant 18.7%
Temporary worker 14.9%19
Temporary student 14.5%
Other entry class 5.0%
No response 0.4%
Immigrants: Current Immigration Status
Permanent resident 46.2%
Canadian citizen 33.2%
Other status 19.8%
(temporary resident,
protected person,
refugee claimant,
undocumented, other)
No response 0.8%
Immigrants: Years living in Range: 0-75
Canada Average: 11 years
Less than 5 years 32.4%
5 to 10 years 42.0%
Longer than 10 years 25.6%
No response 0%20
Experiences of Discrimination
To what extent have Immigrants & Visible Minorities, Indigenous Peoples, and comparison
White Non-immigrants experienced discrimination in London-Middlesex in the past three
years?
A substantial percentage of respondents experienced discrimination in one or more contexts in
London-Middlesex over the last three years, with Indigenous Peoples especially likely to have
experienced discrimination.
Percentage of Respondents Who Have Experienced Discrimination in One or More Contexts in
the Past Three Years
Within the three groups, to what extent do experiences of discrimination differ as a function
of demographic characteristics?
The role of gender
In the Immigrants & Visible Minorities group, females were slightly more likely to report
experiencing discrimination in London-Middlesex than males. In contrast, in the Indigenous
Peoples group and in the White Non-immigrants group, males were slightly more likely than
females to report experiencing discrimination in London-Middlesex.21 Percentage of Respondents Who Experienced Discrimination by Gender
22

The role of age

In the Immigrants & Visible Minorities group and in the White Non-immigrants group, younger
respondents were more likely to report experiencing discrimination in London-Middlesex than
older respondents. In contrast, in the Indigenous Peoples group, older respondents were more
likely to report experiencing discrimination in London-Middlesex than younger respondents.

              Percentage of Respondents Who Experienced Discrimination by Age

     Note: Due to the small cell sizes, the findings for White Non-immigrants aged 18 to
     24 years old and the findings for Indigenous Peoples aged 51 years old and above are
     suggestive only.
23
The role of employment status
In the Immigrants & Visible Minorities group and the White Non-immigrants group, full-time,
part-time, or self-employed respondents were more likely to report experiencing discrimination
in London-Middlesex than those with other and multiple employment statuses. In contrast, in
the Indigenous Peoples group, those with other and multiple employment statuses were more
likely to report experiencing discrimination in London-Middlesex.
Percentage of Respondents Who Experienced Discrimination by Employment Status
Note: The “Other and Multiple” employment status category includes people who
indicated that they are unemployed, retired, students, homemakers, or other, as well
as people who indicated more than one employment status (e.g., homemaker and
retired).24
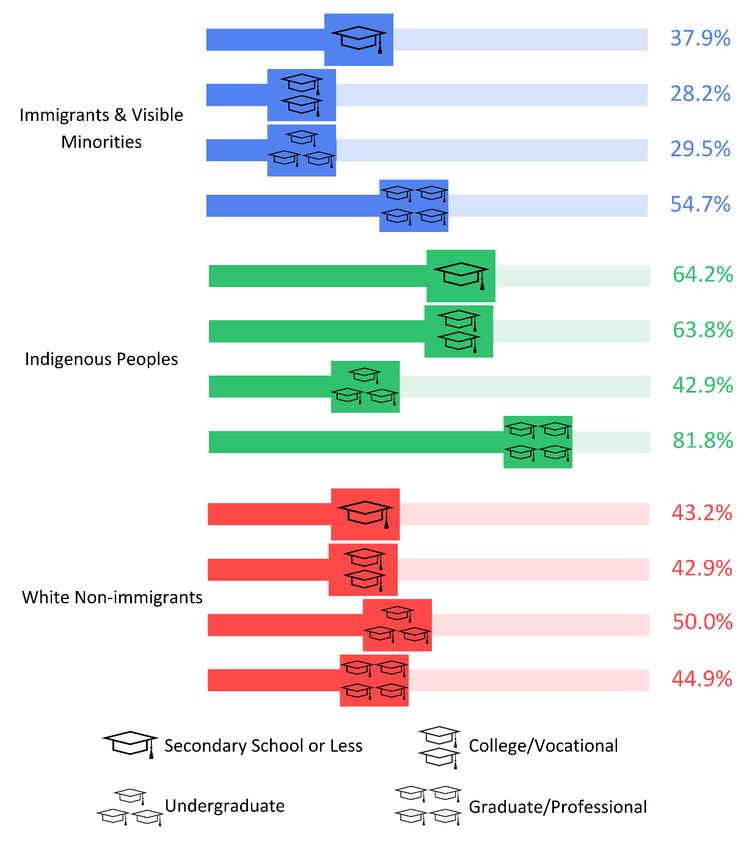
The role of education level
In the Immigrants & Visible Minorities group and in the Indigenous Peoples group those with
graduate and professional degrees were most likely to report experiencing discrimination in
London-Middlesex. In the comparison White Non-immigrants group, those with undergraduate
degrees were most likely to report experiencing discrimination in London-Middlesex.
Percentage of Respondents Who Experienced Discrimination by Highest Level of Education
Note: Due to the small cell size, the finding for Indigenous Peoples with a
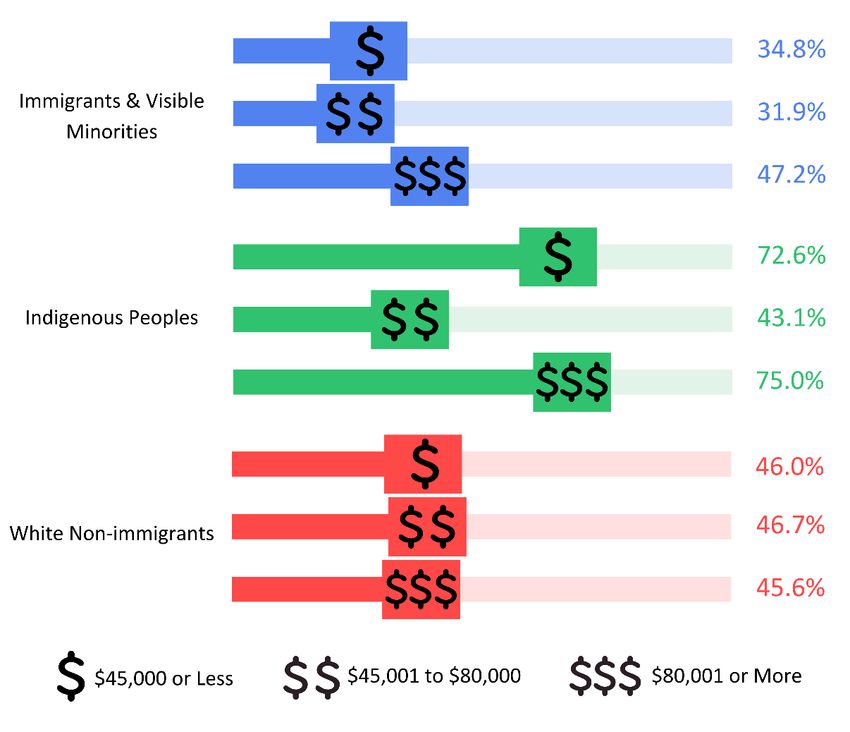
graduate/professional degree is suggestive only.25 The role of annual household income In the Immigrants & Visible Minorities group, those with the highest household income were most likely to report experiencing discrimination in London-Middlesex. In the Indigenous Peoples group, those with the highest and lowest household incomes were most likely to report experiencing discrimination in London-Middlesex. In the comparison White Non-immigrants group, the likelihood of experiencing discrimination in London-Middlesex did not differ by household income. Percentage of Respondents Who Experienced Discrimination by Annual Household Income
26

The role of length of time residing in London-Middlesex

In the Immigrants & Visible Minorities group and in the Indigenous Peoples group, those who
have lived in London-Middlesex for more than 20 years were most likely to report experiencing
discrimination in the past three years, followed by those who have lived in London-Middlesex for
less than five years. In the comparison White Non-immigrants group, those who have lived in
London-Middlesex for 10 years or less were most likely to report experiencing discrimination in
London-Middlesex in the past three years.

                Percentage of Respondents Who Experienced Discrimination by
                        Length of Time Residing in London-Middlesex
27
Immigrants and visible minorities: The role of religion
In the Immigrants & Visible Minorities group, Sikhs were most likely to report experiencing
discrimination in London-Middlesex.
Percentage of Immigrant and Visible Minority Respondents Who
Experienced Discrimination by Religion
Note: The “Other and Multiple Religions” category includes people who indicated
their religions as Baha’i, Buddhist, Jewish, Mennonite, Traditional/Spirituality, or
other, as well as people who indicated more than one religion (e.g., Christian and
Buddhist).
Immigrants and visible minorities: The role of ethnicity/race
In the Immigrants & Visible Minorities group, South Asians were most likely to report
experiencing discrimination in London-Middlesex.28
Percentage of Immigrant and Visible Minority Respondents Who
Experienced Discrimination by Ethnicity/Race
Note: “Other and Multiple Categories” includes people who identify as Arab, Latin
American, West Asian, Indigenous, or other, as well as people who indicated more than
one category (e.g., White and Latin American).
Immigrants and visible minorities: The role of immigrant and visible minority status
In the Immigrants & Visible Minorities group, immigrant non-visible minorities were most likely
to report experiencing discrimination in London-Middlesex.
Percentage of Immigrant and Visible Minority Group Respondents Who Experienced
Discrimination as a Function of their Immigrant and Visible Minority Statuses29
Immigrants: The role of current immigration status
Of the immigrant respondents, those who were not Canadian citizens or Permanent residents
were most likely to report experiencing discrimination in London-Middlesex.
Percentage of Immigrants Who Experienced Discrimination by Current Immigration Status
Note: The “Other Immigration Status” category includes temporary residents, protected
persons, refugee claimants, undocumented, or other.
Immigrants: The role of length of time in Canada
Of the immigrant respondents, those who had lived in Canada for less than five years were most
likely to report experiencing discrimination in the past three years in London-Middlesex.
Percentage of Immigrants Who Experienced Discrimination by Length of Time in Canada30
In how many contexts is discrimination being experienced?
The survey included a list of 16 contexts in which respondents might be experiencing
discrimination, including an other category to capture any contexts not included. On average,
Indigenous Peoples reported experiencing discrimination in more contexts than Immigrants &
Visible Minorities and White Non-immigrants.
Average Number of Contexts in Which Respondents Experienced Discrimination
in the Past Three Years
In what contexts is discrimination being experienced?
Overall, Immigrants & Visible Minorities are most likely to experience discrimination in London-
Middlesex when attending school or classes, when applying for a job or promotion, at their job,
while using public transit, and in a store, bank, or restaurant.31
Immigrants & Visible Minorities:
Contexts in Which Discrimination OccurredYou can also read