Analysing the effect of DSM projects at South African cement factories
←
→
Page content transcription
If your browser does not render page correctly, please read the page content below

Chapter 1 || Introduction

     Analysing the effect of DSM projects at
        South African cement factories

                               JP Spangenberg
                                  20790902

  Dissertation submitted in fulfilment of the requirements for the
        degree Magister in Mechanical Engineering at the
      Potchefstroom Campus of the North-West University

Supervisor:                  Dr JF van Rensburg

October 2015

Analysing the effect of DSM projects at South African cement factories   i
Spangenberg (2015)

    Abstract

 Title:               Analysing the effect of DSM projects at South African cement factories

 Author:              Mr. J.P. Spangenberg

 Supervisor:          Dr. J. F. van Rensburg

 Degree:              Master of Engineering (Mechanical)

 Keywords:            Demand Side Management, Load Shift, Cement, Production Line,
                      Eskom

In any developing country an increasingly higher demand for electricity supply exists. South
Africa experienced load shedding during late 2007 and early 2008 and again in 2014 due to a
supply shortfall. New power stations are being built to increase the capacity of the national
power grid. However this is a lengthy process.

Demand Side Management (DSM) was adopted by Eskom’s Integrated Demand Management
(IDM) division. DSM is a short-term solution to stabilise the national grid in South Africa by
managing the electricity demand on the consumer’s or client’s side. DSM aims to reduce the
electricity consumption with immediate results in the short-term.

DSM projects were successfully implemented at nine South African cement factories since
2012. Cement factories are ideal for the implementation of DSM projects for the following
reasons: cement factories are energy intensive; have adequate reserve production capacity;
sufficient storage capacity and interruptible production schedules.

The aim of this study is to analyse the effect of DSM projects at South African cement factories.
A detailed understanding of the cement production process is a prerequisite. Therefore a critical
review of energy utilisation in the cement industry was conducted. Previous work done in the
cement production field is evaluated to identify the possible literature shortfall on DSM
projects.

A set of five distinctive parameters was derived from the literature survey to quantify the
possible effects of DSM projects at cement factories. The parameters are demand reduction
and electricity cost; production targets; infrastructure; product quality and sustainability.

Analysing the effect of DSM projects at South African cement factories                          i
Spangenberg (2015)

One cement factory, Factory #1, was selected as a primary case study for the analysis model.
Factory #1 was used to determine and quantify the effects of DSM projects at cement factories.
A simulation was developed to verify the analysis model outcome. DSM projects were
implemented at various factories in South Africa and the results from nine sites were used to
validate the aim of this study.

The study concluded that most DSM projects at South African cement factories were
sustainable. Both the electricity supplier and the factories benefitted from the projects. The
funding received from Eskom to implement DSM projects is a short-term initiative. However,
sustainability of DSM projects is made possible in the long-term by the substantial electricity
cost savings on the client’s or factory’s side.

Analysing the effect of DSM projects at South African cement factories                       ii

Spangenberg (2015)

    Acknowledgements

Firstly, thank you to God Almighty, my Father, for the blessing to partake in this study.

Thank you to my loving wife, Lanelle, for her motivation and support throughout this study.

Thank you to Dr. H. G. Brand, Dr. A. J. Schutte, Dr. J. A. Swanepoel and all my fellow
colleagues at CRCED Pretoria who assisted me with this study.

Thank you to my supervisor, Dr. J. F. van Rensburg, for the guidance and support throughout
this study.

Thank you to TEMM International (Pty) Ltd and HVAC International (Pty) Ltd for the
opportunity, financial assistance and support to complete this study.

Analysing the effect of DSM projects at South African cement factories                      iii
Spangenberg (2015)

    Table of contents
         Abstract ........................................................................................................................... i
         Acknowledgements ...................................................................................................... iii
         Table of contents ........................................................................................................... iv
         List of figures ................................................................................................................ vi
         List of tables ............................................................................................................... viii
         List of abbreviations ..................................................................................................... ix
         Introduction .................................................................................................................... 1
  1.1.     Background on the South African electricity supply and demand .............................. 2
  1.2.     Demand Side Management techniques ....................................................................... 4
  1.3.     Possible effects of DSM projects ................................................................................ 5
  1.4.     Aim of the study .......................................................................................................... 6
  1.5.     Scope of the study ....................................................................................................... 7
  1.6.     Dissertation overview .................................................................................................. 8
         Overview of energy management in the cement industry ........................................... 10
  2.1.     Introduction to cement production ............................................................................ 11
  2.2.     Critical review of energy utilisation in the cement industry ..................................... 17
  2.3.     Energy intensity of factory components.................................................................... 21
  2.4.     Previous DSM projects.............................................................................................. 25
  2.5.     Energy cost structure ................................................................................................. 27
  2.6.     Conclusion................................................................................................................. 29
         Methodology to investigate the possible effects of DSM ............................................ 30
  3.1.     Introduction to methodology ..................................................................................... 31
  3.2.     Energy Management System ..................................................................................... 32
  3.3.     Overview of factory .................................................................................................. 34
  3.4.     Analysis model .......................................................................................................... 35
  3.5.     Possible effects on cement factories.......................................................................... 38
  3.6.     Conclusion................................................................................................................. 49
         Sustainability results .................................................................................................... 51
  4.1.     Introduction ............................................................................................................... 52
  4.2.     Demand reduction and electricity cost savings ......................................................... 52
  4.3.     Effect on production .................................................................................................. 59

Analysing the effect of DSM projects at South African cement factories                                                                      iv
Spangenberg (2015)

   4.4.     Impact on cement production equipment .................................................................. 61
   4.5.     Quality of the cement product ................................................................................... 62
   4.6.     Sustainability ............................................................................................................. 65
   4.7.     Conclusion................................................................................................................. 66
          Conclusion and recommendations ............................................................................... 68
   5.1.     Introduction ............................................................................................................... 69
   5.2.     Addressing the effect of DSM projects ..................................................................... 69
   5.3.     Recommendations for future research....................................................................... 73
   5.4.     Conclusion of study................................................................................................... 73
          References .................................................................................................................... 74
Appendix A – Factory #1 production schedule ....................................................................... 80
Appendix B – Example of Factory #1 stop matrix .................................................................. 82
Appendix C – Eskom Megaflex tariff pricing ......................................................................... 83
Appendix D – Factory #1 production data ............................................................................... 84
Appendix E –Awareness statement ......................................................................................... 85
Appendix F – Example of the daily reports issued .................................................................. 86

Analysing the effect of DSM projects at South African cement factories                                                                    v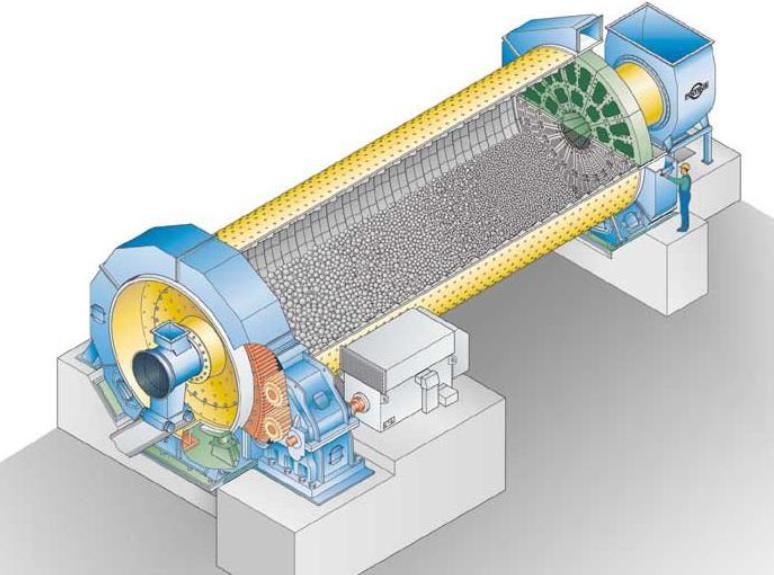
Spangenberg (2015)

      List of figures
Figure 1: Cumulative Eskom tariff increase vs CPI .................................................................. 3
Figure 2: Illustration of various DSM interventions .................................................................. 4
Figure 4: Layout of the dry process ......................................................................................... 11
Figure 5: Basic flow chart of the cement production process .................................................. 12
Figure 3: Geographical illustration of South African cement factories ................................... 15
Figure 6: Breakdown of average expenditure of a typical global cement factory ................... 18
Figure 7: Cement factory kiln ................................................................................................. 22
Figure 8: Vertical Roller Mill .................................................................................................. 23
Figure 9: Ball mill .................................................................................................................... 23
Figure 10: The breakdown of electricity consumption by factory process .............................. 23
Figure 11: Electrical and thermal energy flow in a typical cement production process .......... 24
Figure 12: Eskom defined TOU periods .................................................................................. 28
Figure 13: Methodology overview........................................................................................... 31
Figure 14: PTB viewer screen.................................................................................................. 33
Figure 15: Factory #1 layout .................................................................................................... 34
Figure 16: Power profile of the baseline model ....................................................................... 36
Figure 17: Simulation model power profiles ........................................................................... 39
Figure 18: Simulation model power profiles (energy neutral)................................................. 40
Figure 19: Simulated hourly energy consumption ................................................................... 40
Figure 20: Simulated average weekly electricity cost saving for the winter demand-season . 41
Figure 21: Calculated annual electricity cost saving ............................................................... 42
Figure 22: Simulated cement production ................................................................................. 43
Figure 23: Simulated raw meal silo level ................................................................................ 44
Figure 24: Simulated clinker silo level .................................................................................... 44
Figure 25: Simulated cement silo level .................................................................................... 45
Figure 26: Simulated raw meal silo control level distribution ................................................. 48
Figure 27: Simulated improvement in raw meal silo control range......................................... 48
Figure 28: The baseline power profiles for Factory #1............................................................ 52
Figure 29: Average power profile of Factory #1 ..................................................................... 54
Figure 30: Average daily power profile of Factory #1 during PA ........................................... 54
Figure 31: Average daily power profile of Factory #1 during PT ........................................... 55

Analysing the effect of DSM projects at South African cement factories                                                                  vi
Spangenberg (2015)

Figure 32: Comparison between baseline and PT power profiles of Factory #1 ..................... 56
Figure 33: Winter power profile of Factory#1 during PT ........................................................ 57
Figure 34: Summer power profile of Factory #1 during PT .................................................... 57
Figure 35: Annual electricity cost saving for Factory #1 ........................................................ 58
Figure 36: Cumulative evening peak demand reduction of Factory #1 ................................... 58
Figure 37: PTB viewer used at Factory #1 .............................................................................. 59
Figure 38: Monthly production and sales figures of Factory #1 .............................................. 60
Figure 39: Cement silo level of Factory #1 ............................................................................. 60
Figure 40: Pre-implementation raw meal silo level distribution ............................................. 63
Figure 41: Post-implementation raw meal silo level distribution ............................................ 63
Figure 42: Pre- and post-implementation raw meal silo level control improvement .............. 64
Figure 43: Difference between simulated and actual raw meal silo level control ................... 65

Analysing the effect of DSM projects at South African cement factories                                                 vii

Spangenberg (2015)

     List of tables
Table 1: Basic composition of cement ..................................................................................... 14
Table 2: Global cement production statistics ........................................................................... 16
Table 3: Global comparison of electrical and thermal SEC of cement factories ..................... 17
Table 4: Critical review of SEC improvements in the cement industry .................................. 19
Table 5: Electrical energy distribution in the cement industry ................................................ 21
Table 6: Previous DSM projects at South African cement factories ....................................... 27
Table 7: Eskom Megaflex 2013/2014 TOU tariffs .................................................................. 28
Table 8: Functional components of Factory #1 ....................................................................... 34
Table 9: Storage facility capacity of Factory #1 ...................................................................... 35
Table 10: Analysis model description...................................................................................... 36
Table 11: Simulated impact on equipment .............................................................................. 46
Table 12: Summary of simulation results ................................................................................ 50
Table 13: The average electricity demand for the baseline period .......................................... 53
Table 14: Impact on equipment ............................................................................................... 61
Table 15: Summary of demand reduction and electricity cost saving results .......................... 66
Table 16: Summary of long-term results ................................................................................. 67
Table 17: Summary of the effect of DSM projects at South African cement factories ........... 72

Analysing the effect of DSM projects at South African cement factories                                                     viii
Spangenberg (2015)

       List of abbreviations
 c/kWh             Cent per kilowatt-hour

 CPI               Consumer Price Index

 DSM               Demand Side Management

 EMS               Energy Management System

 ESCo              Energy Services Company

 GDP               Gross Domestic Product

 GHG               Greenhouse Gas

 GJ/t              Gigajoule per tonne

 GJ/year           Gigajoule per year

 IDM               Integrated Demand Management

 IEA               International Energy Agency

 IRP               Integrated Resource Plan

 kT                kilotonnes

 kWh               Kilowatt-hour

 MT                Megatonnes

 MWh               Megawatt-hour

 MYPD              Multi-Year Price Determination

 NERSA             National Energy Regulator of South Africa

 PA                Performance Assessment

 PT                Performance Tracking

 PTB               Process Toolbox

 REMS              Real-time Energy Management System

 SEC               Specific Energy Consumption

 t/h               Tonne per hour

 TOU               Time-Of-Use

 VRM               Vertical Roller Mill

Analysing the effect of DSM projects at South African cement factories   ix
Spangenberg (2015)
Introduction
Chapter 1 provides an introduction to the study. This includes an overview of the global
electrical consumption and economic growth. It emphasises the importance of sustainable
energy conservation. The reader is made aware of the national electricity situation in South
Africa and DSM techniques are discussed in brief. Lastly, Chapter 1 states the aim and the
scope of this study.
Bird’s eye view photo of the kiln (centre) and cooler (top right) taken at Factory #1, courtesy of the author
Analysing the effect of DSM projects at South African cement factories 1Chapter 1 || Introduction Spangenberg (2015) 1.1. Background on the South African electricity supply and demand The demand for electricity is growing at an alarming rate. The estimated total global demand increase for the years 2010 to 2030 is 33% [1]. Africa follows the global energy trend, with South Africa consuming 43% of the continent’s electrical energy [2], [3]. South Africa is a developing country consuming vast amounts of energy. Since 1994, South Africa experienced a significant increase in electricity consumption. During this time focus was placed on economic growth, developing previously disadvantaged communities and job creation [4], [5]. Research suggests that South Africa’s economy is heavily dependent on the energy sector which accounts for 15% of the Gross Domestic Product (GDP) [6]. In 2007 the electricity demand came dangerously close to the supply capacity. This resulted in load shedding interventions from Eskom to stabilise the national supply grid [7]. The same scenario occurred in 2014 and 2015 [8]. New power stations are being built in an attempt to meet the increasing demand. Unfortunately, there are time constraints involved. New builds, Medupi and Kusile, were expected to supply the grid by 2013 and 2014 respectively. This followed approval for construction in 2007 and 2008 by Eskom’s board [8]–[10]. Eskom announced that Medupi is expected to supply stable commercial base load power from mid-2015. This is when the first of six units will be synchronised with the grid. Medupi is expected to reach the final completion stage during 2018 and Kusile during 2019 [9]–[11]. The supply capacity must be adequately managed ensuring sufficient availability when the demand peaks [11]. The reserve margin is the difference between the present supply capacity and the electricity demand. The increasing electricity demand will eventually match the supply capacity of the national power grid [12]. According to the Integrated Resource Plan (IRP) of 2010 new generating capacity of 45 228 MW will need to be developed [13]. This is over and above Eskom’s current capacity expansion programme. The present generation capacity of Eskom is 41 194 MW. The capacity expansion programme will increase the national supply capacity by 17 120 MW by 2018 [14]. This increase of 42% will bring much needed stability to the national power grid. Analysing the effect of DSM projects at South African cement factories 2
Chapter 1 || Introduction                                                                                Spangenberg (2015)

Eskom’s tariffs are adjusted on an annual basis. Figure 1 shows the cumulative percentage
increase in Eskom’s average tariff price and South Africa’s Consumer Price Index (CPI) for
the past 15 years [15].The Department of Minerals and Energy released a White Paper in 1998
which predicted the supply shortfall that occurred in 2007 [16]. The failure to plan accordingly,
urgent need for expansion and accompanying supply shortages needed to be provided for in
the tariffs. Therefore the spike in tariff increases above the CPI was justified.

                                             Average Eskom price adjustment       Consumer Price Index (CPI)
                              200

                              180

                              160

                              140
    Cumulative increase [%]

                              120

                              100

                              80

                              60

                              40

                              20

                               0
                                    2000 2001 2002 2003 2004 2005 2006 2007 2008 2009 2010 2011 2012 2013 2014
                                                                Time [financial years]

                                                 Figure 1: Cumulative Eskom tariff increase vs CPI

In order for a country to sustain economic growth, adequate resources must be readily
available. Electricity is a valuable resource without which a country cannot advance
competitively in the global market [17]. The supply side capacity will be increased through the
new build program. In the meantime, alternative solutions need to be applied urgently to ensure
an adequate reserve margin of electricity on the national power grid.

One of these solutions is Demand Side Management (DSM) through Eskom’s Integrated
Demand Management (IDM) initiative. The International Energy Agency (IEA) found that
DSM is more cost effective than conventional short-term supply side initiatives [18]. Findings
from the IEA support the existence and importance of the South African DSM program.

Analysing the effect of DSM projects at South African cement factories                                                   3
Chapter 1 || Introduction Spangenberg (2015)
Eskom’s IDM department is responsible for funding various methods of DSM. Effective
management of demand side consumption will ensure a more stable grid for a longer time
period and introduce a new cost reducing component for clients in the increasingly competitive
cement market.
1.2. Demand Side Management techniques
The sustainability of energy resources is an increasing global concern [1], [19]. The effective
management of electrical energy consumption is crucial within any energy intensive industry.
Sustainable energy management is on the forefront of discussion in many countries [20].
The Millennium Development Goals (MDGs) is a United Nations initiative and one of its goals
is to ensure environmental sustainability. This is done by integrating the principles of
sustainable development into country policies and programmes. DSM is an incentive assisting
Eskom in fulfilling its constitutional obligations as set out by the MDGs [21]. The DSM
initiative promotes sustainable usage of energy resources in South Africa by reducing the
electricity demand.
Figure 2 shows three distinct load profile trends that graphically describe the effect of DSM on
the power consumption. These profiles are classified as a) energy efficiency, b) load shift and
c) peak clip. These three methods are globally used in DSM initiatives and were adopted by
Eskom through the IDM programme.
Figure 2: Illustration of various DSM interventions
Energy efficiency is achieved by reducing the electrical input while maintaining the same
operational output. Peak clip is best described by an intervention that reduces the electrical
input and the operational output for a given peak period in the demand. Load shift aims to
Analysing the effect of DSM projects at South African cement factories 4Chapter 1 || Introduction Spangenberg (2015) reduce peak load and shift the reduced load into other periods. In the case of energy efficiency and load shift there is no nett effect on the output. Section 2.3 shows that this is very feasible in the cement industry. 1.3. Possible effects of DSM projects The energy consumption cost in the cement industry accounts for 50% to 60% of the overall production costs [22]. Thus the opportunity to investigate DSM projects on cement factories was justified. [23], [24]. The cement industry can benefit from implementing electricity cost savings strategies. The typical electricity consumption of a modern cement factory is about 105 – 120 kWh per tonne of cement produced [25]–[27]. The electricity costs associated with cement production, especially after the recent tariff increases, justified the need to investigate the possibility of DMS projects at South African cement factories. Eskom implements Time Of Use (TOU) tariff structures to promote DSM initiatives. This allows industrial consumers to manage their electricity consumption accordingly to realise maximum cost savings. Cement factories, like most large industrial consumers, can benefit from the various TOU tariff structures and reduce costs. This study will focus on factories that utilise the Eskom Megaflex tariff structure (described in section 2.5). The advantages of DSM projects are twofold. The demand during the evening peak is reduced which brings much needed relief to the supply side. Additionally the client receives electricity cost savings due to load management practices. Eskom DSM projects are dependent on the client’s cooperation to ensure sustainability. The client’s best interests are of utmost importance to ensure seamless cooperation. The energy intensity, adequate reserve production capacity, sufficient storage capacity, interruptible production schedules and a competitive cement market justify the need to develop Energy Management Systems (EMS) specifically for cement factories. Successful implementation of EMS and long-term effects thereof are crucial in determining the feasibility of DSM projects. Sustained peak demand reduction throughout the project lifecycle is required to motivate Eskom funding for similar DSM projects. Therefore a need exists to analyse the possible effects of DSM projects at cement factories. Analysing the effect of DSM projects at South African cement factories 5
Chapter 1 || Introduction                                                  Spangenberg (2015)

1.4.   Aim of the study

Various studies on implementing DSM projects in the cement industry have been carried out.
To date nine DSM projects were implemented on South African cement factories from 2012.
The literature review pointed out that five categories are possibly affected by DSM projects.
These categories are demand reduction and electricity cost savings, production, equipment,
quality and sustainability. This study aims to analyse these effects of DSM projects at South
African cement factories within the five categories described below:

Category 1 – Demand reduction and electricity cost savings:

There exists a need to identify and address the different stakeholder’s impacts and benefits.
The utility, Eskom, needs to see results in terms of peak demand reduction, whereas the client
or factory requires results in terms of electricity cost savings.

 Aim 1: Analyse the long-term evening peak demand reduction and electricity cost saving

Category 2 – Effect on production:

Simulations and pilot studies have shown that load shift did not affect the daily sales and
production targets. The pilot studies were done on single components with adjoining silos in
the production line [23], [28], [29]. A need exists to determine and quantify the effect of load
shift on various components of the entire production line over a long time period.

            Aim 2: Analyse the long-term effect of DSM projects on production

Category 3 – Impact on cement production equipment:

Infrastructure upgrades that automate and monitor the system can improve the total life cycle
of the equipment. Whereas altering the operational philosophy and production schedule might
decrease the total lifespan and efficiency of components. This possible effect must be
determined and quantified.

Analysing the effect of DSM projects at South African cement factories                        6
Chapter 1 || Introduction Spangenberg (2015)
Aim 3: Analyse the long-term impact of DSM projects on cement production equipment
Category 4 – Effect on cement quality:
The grinding processes and clinker formation might be very sensitive to changes associated
with DSM initiatives. This could have adverse effects on the product quality. This possible
effect must be determined and quantified.
Aim 4: Analyse the long-term effect of DSM projects on cement quality
Category 5 – Sustainability:
The implementation and practical follow through of DSM projects could lead to widespread
adoption if the benefits are substantial as well as sustainable. The long-term sustainability of
these projects are analysed with data obtained after the implementation and handover occurred.
The sustainability through awareness must be determined and quantified.
Aim 5: Analyse the sustainability of DSM projects at South African cement factories
1.5. Scope of the study
The scope of this study entails the following:
Process: This study focusses solely on factories that use the dry process to produce cement.
None of the DSM projects were implemented on wet process factories.
Energy source: Electricity is the only energy source analysed in this study. No coal, fuel, oil,
natural gas or any other energy source was investigated because DSM is an electricity demand
management initiative.
Analysing the effect of DSM projects at South African cement factories 7Chapter 1 || Introduction Spangenberg (2015) Components: Only milling and grinding components were investigated. The electrical motors of these components, together with the kiln drive motor, are the primary electricity consumers. The milling components formed the focus of the analysed DSM projects. Implementation: Only load shift effects are analysed. The effects considered are due to changes in the electricity demand profile. 1.6. Dissertation overview Chapter 1 provides an introduction to the study. This includes an overview of the global electrical consumption and economic growth. It emphasises the importance of sustainable energy conservation. The reader is made aware of the national electricity situation in South Africa and DSM techniques are discussed in brief. Lastly, Chapter 1 states the aim and the scope of this study. Chapter 2 gives an overview of energy management in the cement industry. It starts with an introduction to the cement production process. A critical review of energy utilisation in the cement industry is conducted to determine the various technologies available to the industry. The fundamental concepts of cement industry components and infrastructure are discussed. Research carried out on previous DSM projects in the cement and other industries is reported. The gaps in the research field are identified and the need for this study is promulgated. Lastly, Chapter 2 investigates the TOU electricity cost structures of South Africa’s power utility, Eskom. Chapter 3 describes the methodology to investigate the possible effects of DSM projects at South African cement factories. The research procedures followed to design the analysis model is explained in the introduction to this chapter. The energy management system (EMS) and its functional purpose is described. An overview of the cement factory, Factory #1, and the simulation to verify the analysis model is given. The analysis model designed to investigate the need for this study is explained in depth. Finally, Chapter 3 ends with a comprehensive design to validate the analysis results of DSM effects at South African cement factories. Chapter 4 discusses the long-term results obtained from the analysis of DSM effects at South African cement factories. The possible effects are analysed and discussed within the determined model categories which are demand reduction and electricity cost; production Analysing the effect of DSM projects at South African cement factories 8
Chapter 1 || Introduction                                                    Spangenberg (2015)

targets; infrastructure; product quality; and sustainability. Verification of the analysis model is
achieved by comparing the simulated and actual factory results. Furthermore, the outcome of
the results clearly validates the initial need for this study. Lastly, Chapter 4 summarises the
results obtained from the analysis of DSM effects at South African cement factories.

Chapter 5 provides the final conclusion to this study with findings on the effects of DSM
projects at South African cement factories. Validation of the initial study aim is reiterated.
Recommendations are discussed and the adoption of this analysis model in other industries is
identified for possible future investigation.

Analysing the effect of DSM projects at South African cement factories                           9
Spangenberg (2015)

    Overview of energy management in the cement industry

Chapter 2 gives an overview of energy management in the cement industry. It starts with an
introduction to the cement production process. A critical review of energy utilisation in the
cement industry is conducted to determine the various technologies available to the industry.
The fundamental concepts of cement industry components and infrastructure are discussed.
Research carried out on previous DSM projects in the cement and other industries is reported.
The gaps in the research field are identified and the need for this study is promulgated. Lastly,
Chapter 2 investigates the TOU electricity cost structures of South Africa’s power utility,
Eskom.

      Photo of the cement grinding process (front) and cement storage silos (back) taken at Factory # 1, courtesy of the author

Analysing the effect of DSM projects at South African cement factories                                                            10
Chapter 2 || Overview of energy management in the cement industry Spangenberg (2015)
2.1. Introduction to cement production
The typical cement factory is a production line with buffers between the adjoining components.
The buffers are huge silos with adequate storage capacity to allow for scheduling of subsequent
components. The components have different production rates and can operate independently.
The scheduling of the operational intervals of energy intensive components is the key factor in
investigating DSM opportunities at cement factories.
The dry process is the market leader and the most energy efficient of all the cement production
processes [24]. The dry process with major components is illustrated in Figure 3.
Figure 3: Layout of the dry process1
The factories in this study are equipped with a kiln and both raw and finishing mills. This
improves the probability of sustainable savings. The reason is because it is not only the general
supply and demand that will influence production, but also the conveying of material between
the storage silos and the grinding mill.
1 Heidelberg Cement, How cement is made. [Online] Available at: http://www.heidelbergcement.com [Accessed 19 July
2013].
Analysing the effect of DSM projects at South African cement factories 11Chapter 2 || Overview of energy management in the cement industry Spangenberg (2015)
It is common that the production rate of the above mentioned components differ from each
other. Given adequate storage between components, load shift becomes viable.
Figure 4 shows a flow chart of the cement production process. The section below describes
each component of Figure 4. Note that each mill and the kiln have buffers on each side of the
component respectively.
Boundary buffer Storage buffer
Milling process Pyroprocess Milling process Boundary buffer
Storage buffer Storage buffer
Figure 4: Basic flow chart of the cement production process
i) Stockpile
The most important raw material for making cement is limestone. This is extracted from
quarries by blasting or by ripping using heavy machinery. Wheel loaders and dumper trucks
transport the raw material to the crushing installations. The crushers break the rock into pieces
until the raw material reaches a specified size which allows easy conveying. The raw material
is stored in the stockpile yard. Stackers and reclaimers are heavy machinery used in the
stockpile yard. Stackers blend layers of raw material to build a homogenised pile. Reclaimers
are used to quarry the raw materials layer by layer from the pile. The raw material is transported
to the raw mill by conveyer-belt, cableway, railway or truck.
ii) Raw mill
The raw material, together with other ingredients, is fed into the raw mill. The desired raw mix
of crushed raw material and the additional components is prepared using metering devices.
Vertical Roller Mills (VRM) or ball mills grind the mixture to a fine powder. Heat is applied
Analysing the effect of DSM projects at South African cement factories 12Chapter 2 || Overview of energy management in the cement industry Spangenberg (2015) to the grinding process to dry the material. Once the material reaches the desired particle size, the newly formed raw meal is conveyed to the raw meal silos for further homogenisation. iii) Raw meal silo The raw meal is stored in this silo after being ground. The raw meal silo level is kept above a specified level which allows for homogenisation of the raw meal as it is extracted. It is crucial that raw meal is always available and at a safe level for the kiln. iv) Kiln The burning of the raw meal at approximately 1,450°C is carried out in Lepol or preheater kilns that operate on various methods, the main difference being in the preparation and preheating of the kiln feed. By chemical conversion, a process known as sintering, a new product, called clinker, is formed. This is a very sensitive process and the clinker quality is highly dependent on changes in the feed-rate and raw meal composition. In the final stage of the pyroprocess the clinker is cooled by large cooling grates which allow cold air to blow over the clinker. The cooled clinker is conveyed to the clinker silo. v) Clinker silo The clinker volume inside this silo must be kept within the minimum and maximum thresholds. The next component has an interruptible running schedule and careful planning ensures that the production rate of the kiln is not influenced by this schedule. vi) Cement mill From the clinker silo the material is conveyed to the finishing mills where it is ground down to very fine powder cement. Gypsum, anhydrite and other additives are added during the cement grinding process. The addition of additives allows the cement to have different properties. This is done to increase the strength, setting time or cost of the final cement product and is regulated by the general demand for cement with specific properties. Analysing the effect of DSM projects at South African cement factories 13
Chapter 2 || Overview of energy management in the cement industry           Spangenberg (2015)

vii)     Cement mill silo

The finished products are stored in separate silos, classified by cement type and strength class.
The majority of cement is usually loaded and transported in bulk via rail, road or ships.

viii)    Packing plant

Only a small proportion of the cement reaches the customer in the form of bags that have been
filled by rotary packers and stacked by automatic palletising systems.

The basic composition of cement is given in Table 1 [26]. There are various types of cement
depending on the intended use. The most common type of cement is Portland cement.

                               Table 1: Basic composition of cement

 Elements                                                                        Composition
                                                                                           [%]
 CaO                                                                                     65 ± 3
 SiO2                                                                                    21 ± 2
 Al2O3                                                                                      5±2
 FeO3                                                                                       3±1

Portland cement is made by heating limestone (calcium carbonate) and small quantities of other
materials (such as clay) to 1 450°C in a kiln. At this temperature a chemical process known as
calcination takes place. During calcination the calcium carbonate splits up into calcium oxide
and carbon dioxide. The carbon dioxide is a by-product and naturally dissipates as a gas. The
calcium oxide blends with the other materials inside the kiln to form clinker. Clinker is a hard
substance which is grinded with the addition of gypsum, fly ash, lime and other raw materials
into a powder to make Portland cement [30].

Portland cement is a basic ingredient of concrete, mortar and most non-speciality grout. The
most common use for Portland cement is in the production of concrete. Concrete is a composite
material consisting of aggregate (gravel and sand), cement, and water. Concrete can be cast in
almost any shape desired and once hardened, can become the basic structural element in most
construction applications [30].

Analysing the effect of DSM projects at South African cement factories                        14
Chapter 2 || Overview of energy management in the cement industry Spangenberg (2015)
There are various facilities in the cement industry. These facilities include production units,
milling or blending factories and distribution depots. The production factories manufacture
cement and clinker. The milling or blending factories buy clinker and, together with the correct
amount of additives, produce different types of cement depending on the present demand [31].
Figure 5 shows the various cement facilities in the South African industry. The production units
are labelled as yellow and the milling units are labelled red, each with the corresponding
factory’s name in the legend. The green labels show the various distribution depots throughout
South-Africa. The distribution depots will not form part of this study, because no production
of cement takes place there.
Figure 5: Geographical illustration of South African cement factories2
2
Adopted from J. Magliolo, “African Research: The Cement Industry,” 2007. [Online]. Available:
http://www.wealthportfolio.co.za/website/reports/African Research Cement Report 21-01-07.pdf. [Accessed: 12-Apr-2013].
Analysing the effect of DSM projects at South African cement factories 15Chapter 2 || Overview of energy management in the cement industry Spangenberg (2015)
Table 2 shows the global cement production statistics [32]. China is producing almost half of
the global cement share. South Africa is producing less than 17% of the global share.
Table 2: Global cement production statistics
Sectors Production Share
[MT/year] [%]
China 1,064 47%
India 130 6%
United states 99 4%
Japan 66 3%
Korea 50 2%
Spain 48 2%
Russia 45 2%
Thailand 40 2%
Brazil 39 2%
Italy 38 2%
Turkey 38 2%
Indonesia 37 2%
Mexico 36 2%
Germany 32 1%
Iran 32 1%
Egypt 27 1%
Vietnam 27 1%
Saudi Arabia 24 1%
France 20 1%
South Africa < 20 < 1%
Other (including South Africa) 392 17%
World total 2,284 100%
Analysing the effect of DSM projects at South African cement factories 16Chapter 2 || Overview of energy management in the cement industry Spangenberg (2015)
2.2. Critical review of energy utilisation in the cement industry
Energy is needed in the industrial sector to produce valuable resources. One of the key
resources in any developing country is cement. The world demand for cement was
2 836 million tonnes in 2010, with a growth rate of 4.7% per annum between 2005 and
2010 [26]. Between 12 – 15% of the global industrial sector’s energy consumption is allocated
to the cement production industry [26], [33].
The aim of this study is to analyse the effect of DSM projects at South African cement factories.
This critical review focuses on energy costs associated with various processes and cost
reduction methods within the cement industry. Recent spikes in electricity costs further
motivate DSM initiatives on cement factories. The Specific Energy Consumption (SEC) is a
benchmark indicator of industry intensity and efficiency.
Table 3 [32] shows the electrical and thermal SEC of a few selected countries around the world.
The typical cement factory will have an electrical SEC of between 105 – 120 kWh/t [24]–[26].
The thermal SEC of a typical cement factory is between 3.5 – 4.2 GJ/t [34]. Variation energy
consumption is mostly due to raw meal composition and different process efficiencies [32].
Table 3: Global comparison of electrical and thermal SEC of cement factories
Country Electrical SEC Thermal SEC
[kWh/t] [GJ/t]
India 88 3.0
Spain 92 3.5
Germany 100 3.5
Japan 100 3.5
Korea 102 3.7
Brazil 110 3.7
Italy 112 3.8
China 118 4.0
Mexico 118 4.2
South Africa 120 4.3
Canada 140 4.5
US 141 4.6
World best 65 2.7
India, Spain Germany, Japan and Korea have the lowest energy usage per unit of cement
produced while Canada and USA are the most energy intensive. The world best cement
Analysing the effect of DSM projects at South African cement factories 17Chapter 2 || Overview of energy management in the cement industry Spangenberg (2015)
factory’s SEC is 65 kWh/t electrical and 2.7 GJ/t thermal respectively. The South African
cement factories used in this study have an average electrical SEC of 120 kWh/t [27]. The
thermal SEC does not form part of the scope of this study as set out in section 1.5.
The energy intensity of the pyroprocess and the electrical energy of the grinding circuits
account for a large portion of Greenhouse Gas (GHG) emissions [35]. The GHG emissions at
cement factories are excluded from the scope of this study.
The average expenditure for a typical global cement factory is 29% on energy, 27% on raw
materials, 32% on labour and 12% on depreciation [26] as seen in Figure 6. Thus, reducing the
expenditure on energy will be of substantial benefit to the cement industry.
Energy Raw materials Labour Depreciation
27%
29%
32%
12%
Figure 6: Breakdown of average expenditure of a typical global cement factory
Table 4 provides a critical review of SEC improvements and energy cost reduction
interventions in the cement industry. The literature reviewed was divided into the basic
production processes seen in the first column. A short description of each intervention is given
with the electrical and thermal energy improvement per tonne cement produced.
Factory #1, the main cement factory researched in this study, has an average annual cement
output of 1,2 million tonnes as calculated in Appendix D. The annualised electrical and thermal
improvements due to possible energy savings interventions for Factory #1 were calculated and
noted in Table 4.
Analysing the effect of DSM projects at South African cement factories 18Chapter 2 || Overview of energy management in the cement industry Spangenberg (2015)
Table 4: Critical review of SEC improvements in the cement industry
Electrical Thermal Annualised Annualised thermal
Process Energy savings intervention Reference
improvement improvement electrical improvement* improvement*
[kWh/t] [GJ/t] [MWh/year] [GJ/year]
Raw materials Efficient transport systems 1.2 – 3.4 0.02 – 0.04 2 760 36 000 [36]–[40]
preparation and grinding Blending 1.0 – 4.3 0.01 – 0.03 3 180 24 000 [36]–[38], [41]–[44]
Process control on vertical mills 0.8 – 1.7 0.01 – 0.02 1 500 18 000 [38]–[40]
Use of roller mills 6.0 – 11.9 0.03 – 0.08 10 740 66 000 [36], [38]–[40]
High efficiency separators 2.8 – 3.7 0.01 – 0.03 3 900 24 000 [36]–[40], [43], [45]
Fuel preparation 0.7 – 10.0 - 6 420 - [38]
Clinker production Improved refractories - 0.12 – 0.63 - 450 000 [38], [46]
Energy and process control systems 2.4 – 2.5 0.10 – 0.20 2 940 180 000 [38]–[40], [43]
VSD for kiln fan 0.6 – 6.1 0.05 – 0.07 4 020 72 000 [38]–[41], [47]
Preheater/precalciner - 0.16 – 0.43 - 366 000 [37]–[40], [48], [49]
Multi-stage preheater 0.9 0.08 – 4.10 540 2 508 000 [36]–[40]
Reciprocating grate cooler - 0.19 – 0.30 - 294 000 [37], [38], [40], [50], [51]
Kiln combustion system - 0.10 – 0.24 - 204 000 [37], [38], [40], [46], [52], [53]
Indirect firing - 0.02 - 12 000 [38]
Heat recovery - 0.05 – 0.10 - 90 000 [36]–[40], [43], [54]
Seal replacement - 0.01 - 6 000 [38], [55]
Low pressure drop cyclones 0.7 – 4.4 0.01 – 0.04 3 060 30 000 [37]–[41], [43], [54]
Efficient kiln drives 0.6 – 3.9 - 2 700 - [38]–[40], [56]
Finish grinding Process control 3.2 – 4.2 0.04 – 0.05 4 440 54 000 [38]–[40], [57]–[59]
Use of VRM 10.0 – 25.9 0.02 – 0.29 21 540 186 000 [38]–[40], [60], [61]
High pressure roller press 8.0 – 28.0 0.03 – 0.31 21 600 204 000 [37]–[40], [43], [62], [63]
Horizontal roller mill - 0.10 – 0.30 - 240 000 [37], [63]
High efficiency separators 1.6 – 7.0 0.01 – 0.30 5 160 240 000 [36]–[38], [40], [59], [64]
Improved grinding media 1.8 – 6.1 0.02 – 0.10 4 740 72 000 [37]–[40], [43], [52]
General applications High efficiency motors 3.0 – 25.0 0.02 – 0.31 16 800 198 000 [37]–[41], [43], [50]
Variable speed drives 0.1 – 9.2 0.03 – 0.10 5 580 78 000 [37]–[39], [43]
* Values based on the average annual production of Factory #1
Analysing the effect of DSM projects at South African cement factories 19Chapter 2 || Overview of energy management in the cement industry Spangenberg (2015) It was deducted from the critical review in Table 4 that various SEC improvement technologies exist within the global cement industry. Implementing some of these technologies and infrastructure has substantial electrical and thermal energy cost saving potential. The technologies and infrastructure stated in Table 4 require the installation of new equipment and offer an average electrical energy saving of between 1 kWh and 5 kWh per tonne cement produced [38]. These installations are expensive and require prolonged production downtime [65]. The payback periods for these installations are often longer than 10 years [38]. As pointed out in section 1.1, one of the key motivational aspects of DSM projects is the fast implementation time relative to the present delays in Eskom’s new build programme. The combination of unbalanced production rates of individual components and adequate storage silos between these components make cement factories excellent candidates for load shift projects [66]. Load shift initiatives were found to be the most cost effective solution as viable DSM projects and it can be implemented within a relatively short time frame [27]. Therefore this study will focus on the effect of load shift projects at South African cement factories. Analysing the effect of DSM projects at South African cement factories 20
Chapter 2 || Overview of energy management in the cement industry                 Spangenberg (2015)

2.3.    Energy intensity of factory components

The cement production industry is energy intensive and energy utilisation accounts for
50 – 60% of the overall production cost [26]. The primary energy distribution of a cement
production factory is 25% electrical energy from the grid and 75% thermal energy from fossil
fuels [26]. All grinding and milling processes use electrical energy and the major portion of
electrical demand originates from machine driven processes [30]. Large electric motors rotate
the grinding mills and kiln.

The SEC is calculated by dividing the energy consumed by the volume of cement produced.
Typical values of SEC are given in Table 5 [32], [67]. The largest electrical SEC can be
attributed to the mills and kilns.

                     Table 5: Electrical energy distribution in the cement industry

 Section / Equipment                                          Electrical SEC                 Share
                                                                       [kWh/t]                  [%]
 Mines, crusher and stacking                                               1.5                   2.0
 Re-claimer, raw meal grinding and transport                              18.0                 24.0
 Kiln feed, kiln and cooler                                               22.0                 29.3
 Coal mill                                                                 5.0                   6.7
 Cement grinding and transport                                            23.0                 30.7
 Packing                                                                   1.5                   2.0
 Lighting, pumps and services                                              4.0                   5.3
 Total                                                                    75.0                100.0

Figure 7 shows a photo of a kiln taken at a typical South African cement factory. The
pyroprocess accounts for 93 – 99% of the total thermal energy usage [68] and up to 36% of the
electrical energy usage. DSM initiatives were not implemented at the pyroprocess due to its
inherent sensitivity to change and associated risks. The material feed rate, kiln rotation speed,
preheater temperature, chemical sintering and waste gas are among the various factors that
make the kiln more sensitive to change than the grinding processes [26].

Analysing the effect of DSM projects at South African cement factories                            21
Chapter 2 || Overview of energy management in the cement industry Spangenberg (2015)
Figure 7: Cement factory kiln 3
The grinding mills used in the cement production process have been identified as high
electricity consumers. There are several types of mills available for the cement production
process including ball mills, hammer mills, high-pressure roller presses, horizontal roller mills
and Vertical Roller Mills (VRMs).
The South African cement industry has at least three newer, more efficient VRMs utilised in
the raw milling process. Figure 8 shows an illustration of a typical VRM [57]. Studies have
shown that these mills have a lower electrical SEC than ball mills [44].
The most widely used finishing mill in the South African cement industry is the ball mill. An
illustration of a single compartment ball mill can be seen in Figure 9 [57]. Until recently, VRMs
could not be used effectively in the cement grinding process. The particle size distribution band
in these VRMs was to narrow. However, recent advances improved the operating band of
particle size and at least one VRM is utilised for cement grinding in the South African cement
industry for the purpose of cement milling.
3
Image courtesy of M van Heerden.
Analysing the effect of DSM projects at South African cement factories 22Chapter 2 || Overview of energy management in the cement industry Spangenberg (2015)
Figure 8: Vertical Roller Mill Figure 9: Ball mill
Auxiliary equipment for the pyroprocess use 36% of the total electrical energy. The combined
electrical energy consumption of the grinding circuits account for 55% of the total electricity
consumption [23], [24]. This fact points to substantial demand reduction potential through load
shift initiatives. The distribution is clearly depicted in Figure 10.
Raw grinding Clinker burning Cement grinding Other equipment
36%
24%
31%
9%
Figure 10: The breakdown of electricity consumption by factory process
Analysing the effect of DSM projects at South African cement factories 23Chapter 2 || Overview of energy management in the cement industry Spangenberg (2015)
Figure 11 shows the energy flow diagram for a typical cement factory [69]. Investigating the
energy intensive components yielded that load shift initiatives, through the EMS, are justified
on the raw milling and cement grinding processes [37], [38], [69].
Figure 11: Electrical and thermal energy flow in a typical cement production process4
4
N. Madlool, R. Saidur, M. S. Hossain, and N. Rahim, “A critical review on energy use and
savings in the cement industries,” Renew. Sustain. Energy Rev., vol. 15, no. 4, pp. 2042–2060,
May 2011.
Analysing the effect of DSM projects at South African cement factories 24You can also read