AIN COMMUNICATIONS - Oxford Academic
←
→
Page content transcription
If your browser does not render page correctly, please read the page content below
https://doi.org/10.1093/braincomms/fcac061                                                                       BRAIN COMMUNICATIONS 0000: Page 1 of 12                          | 1

BRAIN
  AIN COMMUNICATIONS

Grey and white matter atrophy 1 year after
stroke aphasia
  Natalia Egorova-Brumley,1,2 Mohamed Salah Khlif,1 Emilio Werden,1                                                                                 Laura J. Bird1

                                                                                                                                                                                           Downloaded from https://academic.oup.com/braincomms/article/4/2/fcac061/6549918 by guest on 05 July 2022
and Amy Brodtmann1

Dynamic whole-brain changes occur following stroke, and not just in association with recovery. We tested the hypothesis that the
presence of a specific behavioural deficit after stroke would be associated with structural decline (atrophy) in the brain regions sup-
porting the affected function, by examining language deficits post-stroke. We quantified whole-brain structural volume changes lon-
gitudinally (3–12 months) in stroke participants with (N = 32) and without aphasia (N = 59) as assessed by the Token Test at 3
months post-stroke, compared with a healthy control group (N = 29). While no significant difference in language decline rates (change
in Token Test scores from 3 to 12 months) was observed between groups and some participants in the aphasic group improved their
scores, stroke participants with aphasia symptoms at 3 months showed significant atrophy (.2%, P = 0.0001) of the left inferior
frontal gyrus not observed in either healthy control or non-aphasic groups over the 3–12 months period. We found significant group
differences in the inferior frontal gyrus volume, accounting for age, sex, stroke severity at baseline, education and total intracranial
volume (Bonferroni-corrected P = 0.0003). In a subset of participants (aphasic N = 14, non-aphasic N = 36, and healthy control N =
25) with available diffusion-weighted imaging data, we found significant atrophy in the corpus callosum and the left superior longi-
tudinal fasciculus in the aphasic compared with the healthy control group. Language deficits at 3 months post-stroke are associated
with accelerated structural decline specific to the left inferior frontal gyrus, highlighting that known functional brain reorganization
underlying behavioural improvement may occur in parallel with atrophy of brain regions supporting the language function.

1 The Florey Institute of Neuroscience and Mental Health, Melbourne, Australia
2 The University of Melbourne, Melbourne, Australia
Correspondence to: Natalia Egorova-Brumley
University of Melbourne, Redmond Barry Building
Parkville, 3010, Australia
E-mail: natalia.egorova@unimelb.edu.au
Keywords: atrophy; corpus collosum; inferior frontal gyrus; post-stroke aphasia; superior longitudinal fasciculus
Abbreviations: CANVAS = Cognition And Neocortical Volume After Stroke; IFG = inferior frontal gyrus; ROI = region of interest;
SLF = superior longitudinal fasciculus

Received September 20, 2021. Revised December 23, 2021. Accepted March 15, 2022. Advance access publication March 17, 2022
© The Author(s) 2022. Published by Oxford University Press on behalf of the Guarantors of Brain.
This is an Open Access article distributed under the terms of the Creative Commons Attribution License (https://creativecommons.org/licenses/by/4.0/), which permits unrestricted reuse,
distribution, and reproduction in any medium, provided the original work is properly cited.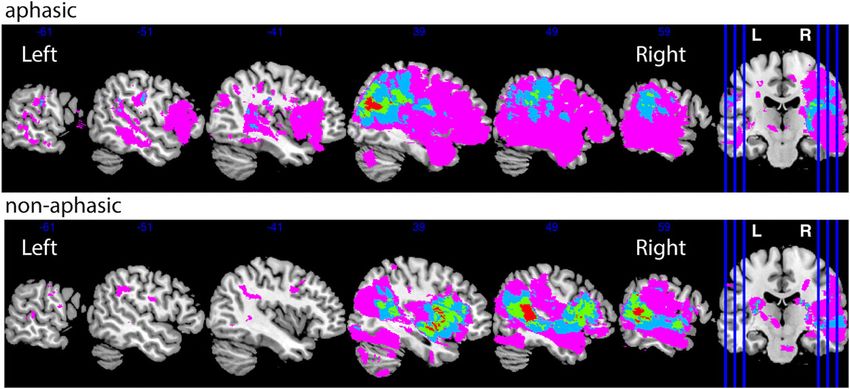
2   | BRAIN COMMUNICATIONS 0000: Page 2 of 12                                                           N. Egorova-Brumley et al.

Graphical Abstract

                                                                                                                                    Downloaded from https://academic.oup.com/braincomms/article/4/2/fcac061/6549918 by guest on 05 July 2022
                                                                    In progressive neurodegenerative diseases, behavioural
Introduction                                                     deficits typically emerge gradually over time, and are often
Network-wide changes after stroke have been well-described,      preceded by the underlying brain atrophy.8 Both cognitive
including neuroinflammation, microglial activation and            decline and atrophy continue over time. In stroke, however,
eventual Wallerian degeneration.1 The concept of post-stroke     specific behavioural deficits tend to emerge at the time of, or
neurodegeneration as a neural network disorder is increasing-    soon after, stroke. They are associated with lesion-related
ly described: the acute infarct triggering a cascade of events   disruption of specific functional and structural connections,
leading to brain atrophy and neurodegeneration.2,3 In other      rather than accumulated brain atrophy. This provides an op-
neurodegenerative disorders, brain atrophy signatures have       portunity to examine the extent of atrophy, which is poten-
been identified along the specific functional and structural       tially caused by the disruption of a particular function early
networks.4–6 For example, in amnestic mild cognitive impair-     after stroke.
ment—often conceptualized as prodromal Alzheimer’s dis-             Aphasia affects 21–38% of acute stroke patients,9 with
ease—memory and attention deficits were associated with           the greatest recovery taking place in the first 3 months post-
distinctive brain atrophy patterns that differed from the        stroke.10 After that time, improvement is less marked and
more global brain atrophy as seen in healthy brain ageing.7      plateaus around 1 year.10 Most researchers using brain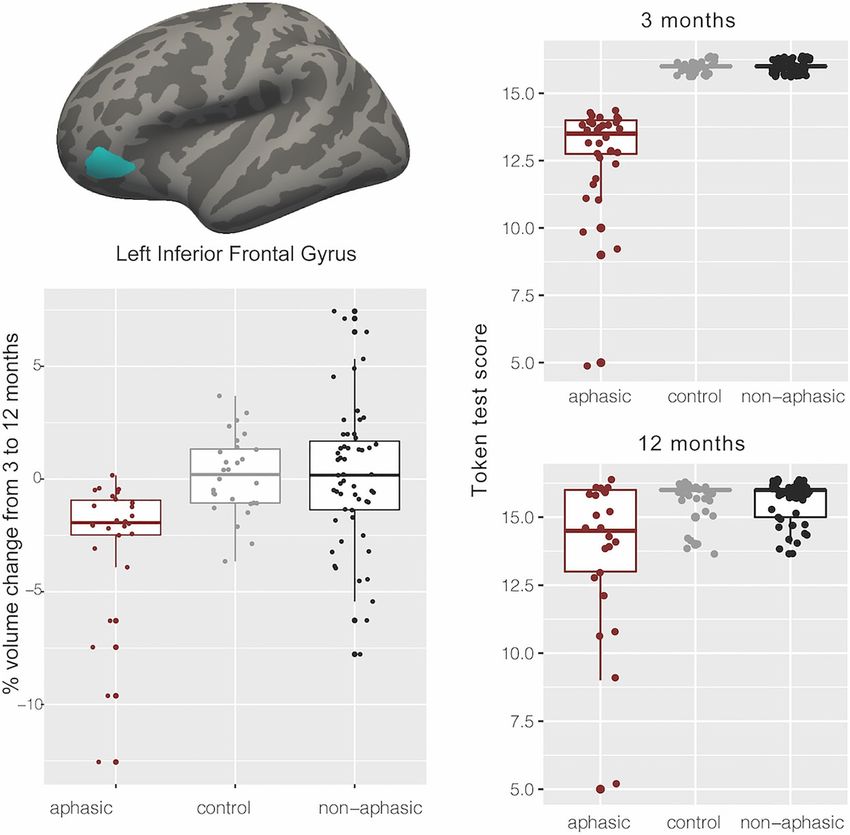
Brain atrophy in post-stroke aphasia                                          BRAIN COMMUNICATIONS 0000: Page 3 of 12      | 3

imaging in aphasia have focused on understanding brain re-        as many exemplars as possible within 1 min. Boston Naming
organization associated with recovery after stroke.11–13          Test17 was used to assess confrontational word retrieval.
However, post-stroke aphasia offers a unique opportunity             In addition, we collected measures of verbal memory,
to test the hypothesis of brain atrophy along functional cir-     working memory and attention with Hopkins Verbal
cuits. We predicted that in stroke patients who presented         Learning Test (HVLT)-delay task18 and Cogstate one-back
with aphasia at 3 months (likely caused by the disruption         and identification tasks (Cogstate Ltd., Melbourne,
of the brain regions supporting the language function), we        Australia), respectively, to control for non-language-specific
would observe brain atrophy in the regions associated with        cognitive impairments. All tests were conducted in English,
language in the first year after stroke and that it would not      and all participants were proficient in English; proficiency
be present in non-aphasic stroke patients or healthy controls.    in other languages was not assessed.

                                                                  Imaging data acquisition

                                                                                                                                  Downloaded from https://academic.oup.com/braincomms/article/4/2/fcac061/6549918 by guest on 05 July 2022
Materials and methods                                             All images were acquired on a Siemens 3 T Tim Trio scanner
                                                                  (Erlangen, Germany) with a 12-channel head coil. As part of
Participants                                                      the ongoing longitudinal CANVAS study, participants were
Participants with ischaemic stroke (first-ever or recurrent)       assessed at 3- and 12-months post-stroke. A high-resolution
were recruited from the Stroke Units at three Melbourne           anatomical magnetization-prepared rapid acquisition with
hospitals: Austin Hospital, Box Hill Hospital and the             gradient echo (MPRAGE) scan was collected [volume of
Royal Melbourne Hospital as a part of the Cognition               160 sagittal slices with 1 mm isotropic voxels, time of repe-
And Neocortical Volume After Stroke (CANVAS) study.14             tition (TR) = 1900 ms, echo time (TE) = 2.55 ms, 9° flip an-
Age- and sex-matched healthy control participants were re-        gle, 100% field of view in the phase direction and 256 × 256
cruited from the general population. Each hospital’s human        acquisition matrix]. A high-resolution 3D Fluid Attenuated
research ethics committee approved the study, and partici-        Inversion Recovery (SPACE-FLAIR) image was acquired
pants provided consent in accordance with the Declaration         (with 160 1 mm thick sagittal slices, TR = 6000, TE =
of Helsinki.                                                      380 ms, 120° flip angle, 100% field of view in the phase dir-
   From the total of 175 participants in the CANVAS study,        ection and 256 × 254 acquisition matrix) to delineate le-
120 (91 stroke and 29 healthy control) were included in the       sions. Sixty diffusion-weighted images (b = 3000 s/mm²),
analysis, based on the availability of the Token Test scores at   and eight volumes without diffusion weighting (b = 0),
3 months and the 3- and 12-month imaging data, 55 were ex-        were obtained with 2.5 mm × 2.5 mm × 2.5 mm isotropic
cluded as described below. Stroke participants scoring 14         voxels.
and below on the Token Test (N = 32) were assigned to
the aphasic stroke group. Stroke participants with a perfect      Lesion analysis
score of 16, demonstrating no language comprehension def-
                                                                  Lesions were manually traced on the high-resolution FLAIR
icit (N = 59), were assigned to the non-aphasic stroke group.
                                                                  image. A stroke neurologist (A.B.) visually inspected and
Healthy control participants scoring 16 (N = 29) were allo-
                                                                  verified the manually traced images. Binary lesion masks
cated to the healthy control group. Stroke participants scor-
                                                                  were created and normalized to the MNI template using
ing 15 (above the threshold for aphasia diagnosis but below
                                                                  the Clinical Toolbox SPM extension.19 Lesion overlap
the perfect 16 score) (N = 27) and healthy control partici-
                                                                  images were prepared using the MRIcron software.20 We
pants with any score below 16 (N = 11), as well as partici-
                                                                  created the lesion overlap maps for stroke participants
pants missing structural imaging data at 3 or 12 months
                                                                  with and without aphasic symptoms (Fig. 1).
(N = 17) were excluded.

                                                                  White matter hyperintensity analysis
Outcome measures                                                  Automated segmentation of white matter (WM) hyperinten-
The severity of participants’ strokes was assessed with the       sities (WMHs) was performed using the Wisconsin WMH
National Institutes of Health Stroke Scale (NIHSS), per-          Segmentation (W2MHS) toolbox using FLAIR and T1
formed during hospital admission. Language ability was as-        images as inputs.21 Manual corrections were performed to
sessed using the 16-item short form of the Token Test, which      remove false positive voxels in the choroid plexus, brainstem
screens for receptive disorders in aphasia.15 The cut-off score   and cerebellum when necessary. WMH load was calculated
of 14 has been shown to be useful for identifying aphasic pa-     as percentage of total brain volume and reported in Table 1.
tients with 84% accuracy, with no distinction regarding the
type of aphasia.15
   Other language assessments included the Controlled Oral
                                                                  Statistical analyses
Word Association Test (COWAT)16, which measures ani-              Grey matter volume statistical analysis
mal category fluency and lexical fluency (letters F, A and S).      We automatically estimated structural volumes using the
In both fluency tests, participants were instructed to produce     longitudinal stream22 in FreeSurfer v.6.0 (http://surfer.nmr.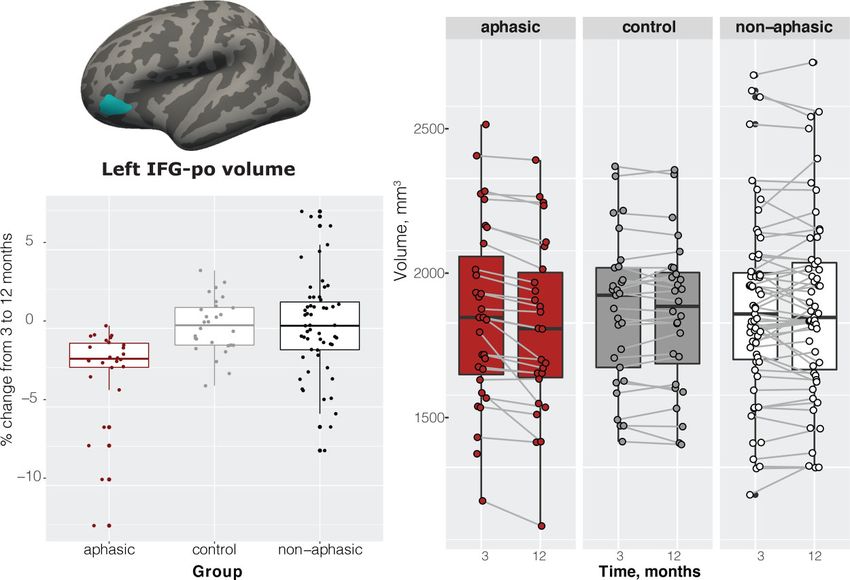
4 | BRAIN COMMUNICATIONS 0000: Page 4 of 12 N. Egorova-Brumley et al.
Downloaded from https://academic.oup.com/braincomms/article/4/2/fcac061/6549918 by guest on 05 July 2022
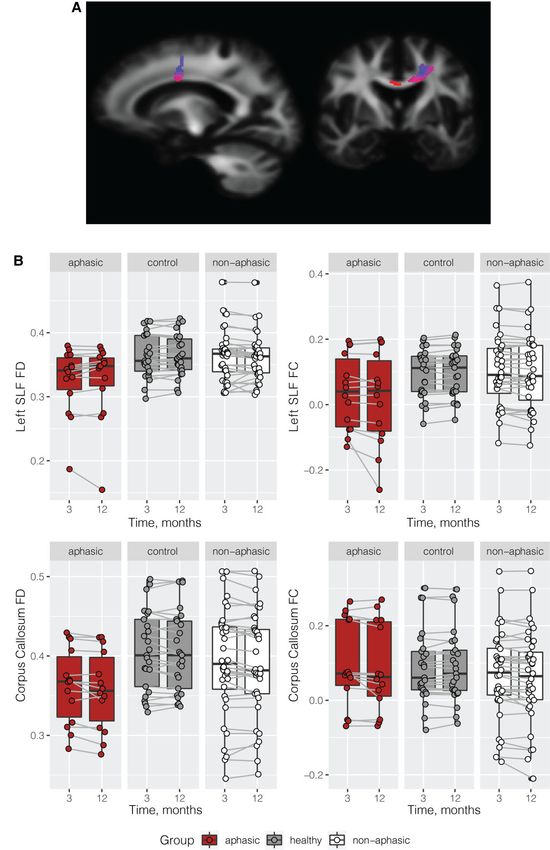
Figure 1 Lesion distribution by group. The number of participants with overlapping lesions ranges between 1 and 4.
Table 1 Demographic variables by group
Aphasic
versus Non-aphasic
healthy versus healthy Aphasic versus
Non-aphasic Healthy control, control, non-aphasic, Test
Variable Aphasic stroke stroke control P-value P-value P-value (two-tailed)
N 32 59 29
Token Test at 3 months 13 (2) 16 (0) 16 (0)
(mean, SD)
Sex (N women, %) 10 (31%) 23 (39%) 10 (34%) 0.79 0.68 0.46 χ2
N left-handed 1 3 3 0.26 0.36 0.66 χ2
NIHSS baseline (median, 3 (0–15) 2 (0–7) n/a n/a n/a 0.02 Mann–
range) Whitney
Wilcoxon test
Years of education 11.37 (3.58) 13.1 (3.38) 14.62 (3.77) ,0.001 0.03 0.07 t-test
(mean, SD)
Age at 3 months (mean, SD) 72.46 (8.78) 65.57 (13.06) 69.51 (5.39) 0.12 0.05 ,0.001 t-test
Total intracranial volume 1505 (170) 1478 (172) 1533 (126) 0.47 0.09 0.47 t-test
(TIV) at 3 months, ml
(mean, SD)
Lesion volume at 3 months, 18 (48) 7 (14) n/a n/a n/a 0.21 t-test
ml (mean, SD)
White matter 0.34 (0.05–5.01) 0.43 (0.01–9.36) 0.42 (0.06–1.56) 0.48 0.18 0.76 t-testa
hyperintensity (WMH)
load at 3 months, %TIV
(median, range)
a
Statistical analysis performed on Log(WMH/TIV) values; WMH data available for 26 aphasic, 46 non-aphasic and 25 control participants.
mgh.harvard.edu/). With this method, an unbiased within- time point. Tissue segmentations for individual participants
subject template space and image23 are created using robust, were visually inspected and corrected. Volume estimates were
inverse consistent registration. Subsequent pre-processing computed for each longitudinal scan in all regions of the
steps are based on the common information from the within- FreeSurfer default cortical and subcortical parcellations based
subject template and include skull stripping, Talairach trans- on the Desikan-Killiany Atlas.24 The specific regions of interest
forms, atlas registration, creating spherical surface maps and (ROIs) used for the analysis are listed in Supplementary
parcellations.22 The unbiased template was created for each Table 1. The selection of ROIs covered most of the brain, so
participant using the T1 MPRAGE scans collected at each our approach can be considered pseudo-whole brain.
Brain atrophy in post-stroke aphasia                                           BRAIN COMMUNICATIONS 0000: Page 5 of 12       | 5

   Group differences were examined using an ANCOVA with            template. Statistical analysis steps were performed using
three groups (aphasia, non-aphasia and healthy control) per-       the MRtrix3.29
formed for each ROI in Supplementary Table 1, controlling             Automated TractSeg tool was used to delineate the tracts
for age, sex, total intracranial volume (TIV) and years of edu-    where significant results were found in the whole-brain ana-
cation. Significance was set at a Bonferroni-corrected level of     lysis, namely the left superior longitudinal fasciculus and the
P , 0.0006, since we conducted 82 tests. For the ROIs showing      corpus callosum tracts to plot FD and FC values by group
significant volume differences (3–12 months) between groups,        (aphasic, non-aphasic healthy control) and by time point (3
we performed pairwise comparisons, which in the two-stroke         and 12 months). We extracted tracts of interest [CC_3 and
groups also controlled for NIHSS scores at baseline.               the superior longitudinal fasciculus (SLF) III tracts in
   Finally, we calculated per cent change within each group        TractSeg] using the default pipeline (https://github.com/
in each significant ROI and used a one-sample t-test (two-          MIC-DKFZ/TractSeg) limiting the number of streamlines
tailed) to determine if the change was significant.                 to 10 000, which proved to be sufficient to delineate each

                                                                                                                                     Downloaded from https://academic.oup.com/braincomms/article/4/2/fcac061/6549918 by guest on 05 July 2022
                                                                   tract well.

WM fixel-based statistical analysis
For the analysis of WM structure, we applied a fixel-based
                                                                   Data availability
approach as in Egorova et al.25 which is sensitive to fibre         The data that support the findings of this study are available
tract-specific differences at a ‘fixel’ (‘fibre population within     on reasonable request from the corresponding author.
a voxel’) level to assess axonal loss across all WM fixels in the   Requests for raw and analyzed data will be reviewed by
brain. The outcome metrics of this analysis are fibre density       the CANVAS investigators to determine whether the request
and fibre bundle cross-section. Fibre density is a metric sen-      is subject to any intellectual property or confidentiality
sitive to the total intra-axonal volume of axons aligning with     obligations.
a specific fibre population in each voxel compartment. Fibre
cross-section is sensitive to individual differences in macro-
scopic fibre bundle cross-sectional size.26                         Results
   Pre-processing of diffusion-weighted images included de-
noizing, removing Gibbs ringing artefacts, eddy-current dis-       Behavioural results 3 months
tortion and motion correction, bias field correction and
spatial upsampling. Following these pre-processing steps,
                                                                   post-stroke
WM fibre orientation distributions (FODs) were computed             The aphasic and non-aphasic stroke groups were not signifi-
with single-shell three-tissue constrained spherical deconvo-      cantly different in sex, handedness or years of education.
lution (SS3T-CSD), with group averaged response functions          They were, however, different on baseline NIHSS scores
for WM, grey matter (GM) and CSF obtained from the data            (more severe stroke in the aphasic group), and age (older par-
themselves,27,28 using the MRtrix3Tissue (https://3Tissue.         ticipants in the aphasic group; see Table 1). Both stroke
github.io), a fork of MRtrix3.29 All pre-processing was per-       groups were not different from controls on sex and handed-
formed in the same way for both healthy control and stroke         ness. Handedness was not considered as covariate in our
patients. Note that the lesions in stroke participants were not    analyses due to very low numbers of left-handers in the sam-
explicitly masked out, but thanks to the SS3T-CSD method,          ple—1 left-handed participant in the aphasic group (0.03%)
they were automatically characterized as a mixture of              and three in the non-aphasic group (0.05%). Healthy con-
WM-like, GM-like and CSF-like signal. The WM FODs ac-              trols were better educated than both stroke groups and
curately quantify the amount of ‘intact’ WM, while contri-         younger than non-aphasic stroke participants (Table 1).
butions of other (pathological) tissues, such as stroke            There was a slightly higher number of participants with
lesions or WMHs, and free water are accommodated in other          right-hemisphere stroke lesions in our sample N = 53
model compartments.30                                              (58%), compared with left-hemisphere N = 36 (39%),
   Longitudinal pre-processed diffusion data were available        and bilateral N = 2 (2%) stroke lesions, as the CANVAS
only for a subset of the original cohort, with N = 14 in the       study did not specifically focus on aphasia. We have con-
aphasic, N = 36 in the non-aphasic and N = 25 in the healthy       firmed that there were no differences between the aphasic
control group. We performed statistical comparisons of fibre        and non-aphasic groups in the proportion of left versus right-
density and fibre cross-section for all WM fixels between            lateralized lesions (X2 = 1.91, P = 0.167), see Fig. 1.
groups (aphasic versus non-aphasic and aphasic versus                 By design aphasic group differed significantly from non-
healthy control), controlling for age, education and intra-        aphasic and healthy control groups on Token Test at 3
cranial volume, using connectivity-based fixel enhance-             months. On other available language tests at 3 months
ment31 for the fibre density (FD) and fibre cross-section            (Boston Naming Test, COWAT animal and lexical fluency),
(FC) metrics separately, using the difference images (12           the stroke aphasic group performed significantly worse than
minus 3 months). Significant fixels (FWE-corrected P ,               the non-aphasic stroke and healthy control groups. The non-
0.05, non-parametric permutation testing over 5000 per-            aphasic group performed worse on the lexical fluency test
mutations) were then visualized on the population                  than healthy controls, but was comparable with healthy
6 | BRAIN COMMUNICATIONS 0000: Page 6 of 12 N. Egorova-Brumley et al.
controls in the Boston Naming Test and the semantic fluency Although the Token Test scores numerically improved be-
test (animals), see Table 2. tween 3 and 12 months in the aphasic group (driven by a few
participants), aphasic stroke participants continued to per-
Language recovery between 3 and 12 form significantly worse than both non-aphasic stroke and
healthy control participants at 12 months [F(2,105) = 4.25,
months post-stroke P = 0.017, aphasic versus non-aphasic (P = 0.04), aphasic
Token Test scores for 12 months were missing from eight versus healthy control (P = 0.02), non-aphasic versus
participants in the aphasic group and six participants in healthy control (P = 0.99)]. Furthermore, they continued to
the healthy control group, reflected in the total degrees of show worse performance compared with healthy controls
freedom for the reported analyses. Note that participants and non-aphasic participants on the Boston Naming Test
with missing Token Test data at 12 months were not ex- and the verbal fluency tests, Table 2.
cluded from the brain analyses. There were significant differ-
Downloaded from https://academic.oup.com/braincomms/article/4/2/fcac061/6549918 by guest on 05 July 2022
ences between the groups on the Token Test changes from 3 GM volume results 3–12 months
to 12 months, Fig. 2. The median increase in Token Test
scores from 3 to 12 months in the aphasic group was +1
post-stroke
point (ranging from −9 to 7), however, given the threshold Of all the ROIs we tested covering virtually the whole
of 14 for the diagnosis of aphasia, for 50% of the partici- brain, the ANCOVA comparing the three groups and con-
pants (12 out of 24), this improvement meant that they trolling for age, sex, education and TIV showed significant
were no longer aphasic. group differences [F(2,108) = 8.84, P = 0.0003, Cohen’s
Table 2 Language variables by group
Aphasic Non-aphasic Aphasic
Aphasic Non-aphasic Healthy versus healthy versus healthy versus Test
Variable stroke stroke control control control non-aphasic (two-tailed)
Boston Naming Test score at 22.81 (5.50) 26.45 (3.97) 27.66 (2.53) ,0.001 0.09 ,0.001 t-test
3 months (mean, SD)
COWAT animals score at 3 months 14.6 (5.23) 19.84 (7.12) 20.62 (5.94) ,0.001 0.59 ,0.001 t-test
(mean, SD)
COWAT FAS score at 3 months 26.1 (13.66) 35.58 (10.71) 42.66 (11.07) ,0.001 0.01 ,0.001 t-test
(mean, SD)
Boston Naming Test score at 24.80 (3.79) 27.22 (2.89) 27.59 (3.08) 0.01 0.60 0.01 t-test
12 months (mean, SD)
COWAT animals score at 12 months 15.50 (4.40) 19.55 (5.35) 20.76 (5.33) ,0.001 0.33 ,0.001 t-test
(mean, SD)
COWAT FAS score at 12 months 27.96 (9.07) 38.09 (11.08) 42.76 (11.44) ,0.001 0.08 ,0.001 t-test
(mean, SD)
Figure 2 Token Test results by group at 3 months, 12 months and the change between 12 and 3 months. ANOVA on Token Test
scores at 12 months F(2,105) = 4.25, P = 0.017, aphasic versus non-aphasic (P = 0.04), aphasic versus the healthy control (P = 0.02), non-aphasic
versus healthy control (P = 0.99).Brain atrophy in post-stroke aphasia BRAIN COMMUNICATIONS 0000: Page 7 of 12 | 7
f = 0.386, constitutes a medium to large effect size] only in remained significant with the inclusion of each of these
the orbital part of the left inferior frontal gyrus (IFG). three covariates (P = 0.001, P = 0.0001 and P = 0.0007, re-
Pairwise comparisons revealed significant differences spectively). Overall, 17% of participants had recurrent
between the aphasic group and healthy controls (−2.76%, stroke (16% within the aphasic group), removing partici-
t = 3.35, P = 0.0033), aphasic and non-aphasic stroke groups pants with recurrent stroke from the analysis did not
(−2.87%, t = 4.04, P = 0.0003), but no difference between change the results in the left IFG.
the healthy control and non-aphasic participants (−0.11%, Only one participant presented with a lesion in the left or-
t = 0.15, P = 0.9866) (Fig. 3). The aphasic group showed sig- bital IFG (lesion overlapping with the significant ROI)
nificant atrophy (2.7%, t = 4.57, P = 0.0001) that was not (Supplementary Fig. 1). This participant showed a 12.55%
observed in either healthy control or non-aphasic stroke volume decrease in the left orbital IFG over 9 months, likely
groups (Fig. 3). Note that while we analyzed the data using due to focal neurodegeneration. All reported results re-
a group approach with specific cut-offs based on the Token mained significant when this participant’s data were re-
Downloaded from https://academic.oup.com/braincomms/article/4/2/fcac061/6549918 by guest on 05 July 2022
Test scores at 3 months, repeating the analysis as a correl- moved from the analyses.
ation between Token Test scores at 3 months and per cent Finally, we divided the aphasic patients into two sub-
volume change in the left IFG, including participants who groups—those who remained aphasic (≤14 Token score)
scored 15 on the Token score, also results in a significant at 12 months and those who improved their score to
association between Token Test performance and IFG volume, .14 (excluding the participant with the lesion in the left
ρ = 0.36, P-value = 0.000148. IFG), N = 12 each. We compared their volume change in
Since the Token Test requires adequate attention and the left IFG using a two-tailed two-sample t-test (we did
memory, as the instructions cannot be repeated, we have not include additional covariates due to a small sample
checked that the inclusion of verbal memory (HVLT-delay), size), and observed a significant difference in brain atro-
working memory (Cogstate one-back task) and attention phy, showing 2.7% and 1.2% volume decrease in the
(Cogstate identification task) as covariates did not affect not-recovered and recovered groups, respectively, t(2,21) =
the interpretation of the results. The group ANOVA 2.13, P = 0.045.
Figure 3 GM imaging results. Location of the left IFG, pars orbitalis (IFG-po); per cent change between 3 and 12 months by group; left IFG-po
volume by time by group. ANOVA on 3–12 months volume change—F(2,108) = 8.84, P = 0.0003, aphasic versus healthy controls (P = 0.0033),
aphasic versus non-aphasic stroke (P = 0.0003), healthy control versus non-aphasic (P = 0.9866).8 | BRAIN COMMUNICATIONS 0000: Page 8 of 12 N. Egorova-Brumley et al.
Downloaded from https://academic.oup.com/braincomms/article/4/2/fcac061/6549918 by guest on 05 July 2022
Figure 4 WM imaging results. Significant decrease in fibre cross-section in the aphasic versus healthy control group in the corpus collosum
and left superior longitudinal fasciculus.Brain atrophy in post-stroke aphasia BRAIN COMMUNICATIONS 0000: Page 9 of 12 | 9
WM results 3–12 months post-stroke show that disrupted functional brain regions might also
undergo a structural decline, in this case in a node of the
Whole-brain fixel-based analysis in a subset of participants functional language network. We report an average of
with available diffusion data revealed a significant WM fibre 2.3% brain volume loss in the area (excluding the participant
cross-section decrease from 3 to 12 months post-stroke in with a lesion in the orbital IFG showing an extremely fast
aphasic participants compared with the healthy control rate of change), compared with negligible 0.1 and 0.2%
group (Fig. 4A). These group differences were localized in change in the non-aphasic and healthy control groups, as
the corpus collosum and the left superior longitudinal fascic- well as established expected regular annual rate of average
ulus. No significant group differences were observed in fibre brain volume loss of about 0.2–0.5% in healthy ageing41–43
density between aphasic and healthy control groups. No sig- or of 0.95% per year in the decline of ipsi-lesional hemisphere
nificant differences were observed between the aphasic and volume after stroke.32 This dramatic decline in the orbital
the non-aphasic groups, although a similar trend was ob- IFG was accompanied by an overall improvement in the
served in the left superior longitudinal fasciculus and the cor-
Downloaded from https://academic.oup.com/braincomms/article/4/2/fcac061/6549918 by guest on 05 July 2022
scores. The differences between the groups at 12 months per-
pus callosum, see Fig. 4B. Note that the results between the sisted, suggesting that, compared with healthy controls and
whole-brain analysis and the tract of interest plots are not non-aphasic stroke patients, on average, participants in the
identical, namely, we could not extract FC and FD from aphasic group were still impaired. However, about half of
the exact mask of significant voxels; and the plots do not the participants were no longer aphasic according to the ‘cut-
take covariates [age, TIV and education] into account, but off’ score we used to classify subjects into aphasic or non-
they do demonstrate that the aphasic group has generally aphasic. Those who recovered showed significantly lower
lower level of FC and FD in these two tracts and a further de- volume loss (1.2% compared with 2.7%); however, it was
cline in FC in the left SLF from 3 to 12 months compared still greater, compared with participants who did not present
with the healthy control group and the non-aphasic group. with aphasic symptoms at 3 months.
The lesions in aphasic and non-aphasic groups had a wide
bilateral distribution (Fig. 1), only one subject had an over-
lapping lesion with the IFG pars orbitalis (Supplementary
Discussion Fig. 1). This suggests that the observed result was an ex-
We compared regional brain volume changes from 3 to 12 ample of remote atrophy, since lesions in the current study
months in aphasic stroke, non-aphasic stroke and healthy were not confined to the areas typically associated with the
control participants across the whole brain. We observed sig- left-lateralized perisylvian language network. We further
nificant brain volume reduction in the aphasic group in the reported a reduction in WM fibre cross-section in the
left IFG, part of the canonical left perisylvian language net- same left frontal brain region (left super longitudinal fascic-
work. No other brain regions showed significant changes. ulus and adjacent corpus collosum). Note that this analysis
In addition, we observed a left-lateralized decrease in WM fi- revealed a spatially localized area of fibre degeneration,
bre cross-section in aphasic compared with healthy control which is not likely to reflect general WM neurodegenera-
participants (a subset with available diffusion data), consist- tion observed in stroke, which tends to be bilateral and ex-
ent with the location of the reported GM atrophy. These tend to both frontal and parietal areas at least at 3 months
findings obtained with two distinct whole-brain analyses post-stroke.25 Changes in fibre cross-section rather than fi-
demonstrate GM and WM atrophy in the brain regions asso- bre density were observed, suggesting that the fibre bundle
ciated with a specific behavioural impairment after stroke. decreased in diameter, possibly following a reduction in fi-
Furthermore, they imply that previously reported functional bre density.44
reorganization associated with recovery (e.g. Saur et al.11) In this study, we had access to only a few language tests
takes place alongside continued atrophy. within the testing battery, but we could ascertain that our
Despite functional recovery and behavioural improve- aphasic group was impaired on Boston Naming task, as
ment after stroke, the brain continues to shrink.32 There is well as semantic and lexical COWAT fluency tests. Our
a wealth of evidence for brain volume loss after stroke but non-aphasic group also showed differences from the
the underlying mechanisms that determine the pattern of healthy controls in lexical fluency. This is consistent with
brain atrophy remain poorly understood. Authors of prior the results of a study showing that a semantic fluency
studies have reported brain atrophy due to the expansion test was sensitive even to mild aphasia, while the lexical
of lesions32; neurodegenerative processes targeting brain fluency task was not correlated with language measures
structures known to become vulnerable after stroke, such and represents a more general executive functioning test.
as the thalamus,33–35 or the hippocampus36,37 or GM loss This is because phonemic or lexical fluency relies more
predicted by the structural (WM) pathway disruption by le- on executive processes and less on the integrity of language
sions.38 We demonstrate remote atrophy along the function- networks.45 Even then, aphasic patients were significantly
al brain regions subtending language ability in both GM and more impaired on phonemic fluency compared with non-
WM. Methods like lesion-network mapping39 suggest that aphasic participants.
lesions overlapping functional networks could disrupt nor- We have interpreted our findings as a disruption to the lan-
mal functioning, for example, in depression.40 We further guage network, yet we only observed brain volume loss in the10 | BRAIN COMMUNICATIONS 0000: Page 10 of 12 N. Egorova-Brumley et al.
left orbital IFG. Historically, aphasia has been characterized warranting further investigation of WM structural changes
by the disruption to the left inferior frontal (Broca) and super- associated with functional reorganization after stroke.
ior temporal (Wernicke) areas and roughly mapped to the While we reported on specific brain regions showing de-
deficits in production and comprehension. It is now accepted cline, we cannot determine the mechanism that caused the de-
that the picture is more nuanced, and the brain regions in- cline. One approach would be to look at whether in the
volved need to be defined more precisely.46 The left IFG participants who showed significant atrophy in the orbital
pars orbitalis is an integral part of a highly distributed neural part of the left IFG, their lesion was structurally or function-
network underpinning semantic cognition.47 It prominently ally connected to this ROI, as opposed to participants who
features as an area observed in semantic studies. In an activa- did not show significant atrophy in this ROI. Furthermore,
tion likelihood estimation (ALE) review, it appears in ‘all ac- in the current study, we used anatomically defined ROIs
tivation’ studies ALE of 1145 foci and in the ‘general based on FreeSurfer parcellation. However, future studies
semantic contrasts’ ALE of 691 foci.48 Pars orbitalis could could use functionally defined ROIs to specifically elucidate
Downloaded from https://academic.oup.com/braincomms/article/4/2/fcac061/6549918 by guest on 05 July 2022
be specifically important for the ventral stream semantic pro- the language network (while participants perform various
cessing, linking sound to meaning,49 as it is connected to the language tasks) and look at volume changes within this func-
temporal pole through the uncinate fasciculus.50 Controlled tionally defined network. Finally, an important extension of
semantic processing and working memory are also known this work would be following up on the changes beyond 1
to share neural system resources that primarily involve pars year after stroke, to fully understand the trajectory of decline.
orbitalis.51 Post-stroke aphasia is characterized not by the
amodal semantic deficit as seen in semantic dementia, but
by semantic control problems.52 Hence, the primary area of Conclusion
vulnerability appears to be the inferior frontal rather than
temporal areas. We, therefore, hypothesize that semantic def- We conclude that language deficits are associated with accel-
icits in our cohort and the related volume loss in the orbital erated structural decline in the functional language network.
part of the left IFG are related to disrupted semantic control These findings highlight the complexity of the recovery pro-
in the brain network underlying this function. However, we cess by demonstrating that functional reorganization in-
also acknowledge that the left IFG may be involved in other cludes not only changes that are associated with functional
functions, such as creativity of ideas,53 and that previous improvement but also atrophy.
studies in post-stroke aphasia found changes in brain struc-
ture and function outside the canonical language network.54
Funding
This work was supported by the National Health and
Limitations Medical Research Council project grant number
APP1020526, the Brain Foundation, Wicking Trust, Collie
In this study, we did not attempt to describe the neural corre- Trust, and Sidney and Fiona Myer Family Foundation.
lates of specific types of aphasia after stroke, as we lacked a N.E.-B. was supported by the Australian Research Council
comprehensive assessment of language function in the cohort. DE180100893.
Rather, our goal was to determine whether language impair-
ment early after stroke (3 months) is associated with atrophy
in the brain regions associated with the language function
that is not observed in stroke participants not presenting
Competing interests
with specifically language deficits. Future studies should inves- The authors report no competing interests.
tigate whether different types of aphasia are associated with
more specific patterns of structural decline. Furthermore, par-
ticipants in our study only had relatively small lesions and mild Supplementary material
stroke severity, including in the aphasic group, which only pre-
sented with a relatively minor language impairment. As the Supplementary material is available at Brain Communications
CANVAS study was not specifically focused on aphasia, parti- online.
cipants did not require/receive any specific language therapy/
rehabilitation over the study period. Future studies should
investigate whether a similar pattern of atrophy would be References
observed in severe aphasia. 1. Sist B, Baskar Jesudasan SJ, Diaschisis RI. Degeneration, and adap-
Only a much-reduced sample was available for the WM tive plasticity after focal ischemic stroke, In. Acute ischemic stroke.
IntechOpen; 2012.
analysis in this study. Yet, a significant result was observed
2. Kooi Ong L, Rohan Walker F, Nilsson M. Is stroke a neurodegen-
at the whole-brain level, consistent in location with the erative condition? A critical review of secondary neurodegeneration
GM findings. This provides initial multi-modal confirmation and amyloid-beta accumulation after stroke. AIMS Med Sci. 2017;
of the link between white and GM structural integrity, 4:1–16.Brain atrophy in post-stroke aphasia BRAIN COMMUNICATIONS 0000: Page 11 of 12 | 11
3. Werden E, Cumming T, Bird L, et al. Structural MRI markers of 25. Egorova N, Dhollander T, Khlif MS, Khan W, Werden E,
brain aging early after ischemic stroke. Neurology. 2017;89: Brodtmann A. Pervasive white matter fibre degeneration in ischae-
116–124. mic stroke. Stroke. 2020;51(5):1507–1513.
4. Seeley WW, Crawford RK, Zhou J, Miller BL, Greicius MD. 26. Raffelt DA, Tournier JD, Smith RE, et al. Investigating white matter
Neurodegenerative diseases target large-scale human brain net- fibre density and morphology using fixel-based analysis.
works. Neuron. 2009;62:42–52. Neuroimage. 2017;144:58–73.
5. Mandelli ML, Vilaplana E, Brown JA, et al. Healthy brain 27. Dhollander T, Connelly A. A novel iterative approach to reap the
connectivity predicts atrophy progression in non-fluent benefits of multi-tissue CSD from just single-shell (+b=0) diffusion
variant of primary progressive aphasia. Brain. 2016;139: MRI data. In: Proceedings International Society of Magnetic
2778–2791. Resonance in Medicine. Singapore; 3010.
6. Veldsman M, Curwood E, Pathak S, Werden E, Brodtmann A. 28. Dhollander T, Mito R, Raffelt D, Connelly A. Improved white mat-
Default mode network neurodegeneration reveals the remote effects ter response function estimation for 3-tissue constrained spherical
of ischaemic stroke. J Neurol Neurosurg Psychiatry. 2018;89: deconvolution. In: Proceedings International Society of Magnetic
318–320. Resonance in Medicine. 2019:555.
7. McDonald CR, Gharapetian L, McEvoy LK, et al. Relationship be- 29. Tournier JD, Smith R, Raffelt D, et al. MRtrix3: A fast, flexible and
Downloaded from https://academic.oup.com/braincomms/article/4/2/fcac061/6549918 by guest on 05 July 2022
tween regional atrophy rates and cognitive decline in mild cognitive open software framework for medical image processing and visual-
impairment. Neurobiol Aging. 2012;33:242–253. isation. Neuroimage. 2019;202:116137.
8. Bakkour A, Morris JC, Dickerson BC. The cortical signature of pro- 30. Dhollander T, Raffelt D, Connelly A. Towards interpretation of
dromal AD. Neurology. 2009;72:1048–1055. 3-tissue constrained spherical deconvolution results in pathology.
9. Berthier ML. Poststroke aphasia: Epidemiology, pathophysiology In. Proceedings International Society of Magnetic Resonance in
and treatment. Drugs Aging. 2005;22:163–182. Medicine. 2017:1815.
10. Pedersen PM, Stig Jørgensen H, Nakayama H, Raaschou HO, Olsen 31. Raffelt DA, Smith RE, Ridgway GR, et al. Connectivity-based fixel
TS. Aphasia in acute stroke: Incidence, determinants, and recovery. enhancement: Whole-brain statistical analysis of diffusion MRI
Ann Neurol. 1995;38:659–666. measures in the presence of crossing fibres. Neuroimage. 2015;
11. Saur D, Lange R, Baumgaertner A, et al. Dynamics of 117:40–55.
language reorganization after stroke. Brain. 2006;129: 32. Seghier ML, Ramsden S, Lim L, Leff AP, Price CJ. Gradual lesion
1371–1384. expansion and brain shrinkage years after stroke. Stroke. 2014;
12. Karbe H, Thiel A, Weber-luxenburger G, Kessler J, Heiss W. Brain 45:877–879.
plasticity in poststroke aphasia : What is the contribution of the 33. Stebbins GT, Nyenhuis DL, Wang C, et al. Gray matter atrophy in
right hemisphere ? PET studies of aphasic stroke patients showed patients with ischemic stroke with cognitive impairment. Stroke.
a significant correlation between the neuropsychological deficit 2008;39:785–793.
and the metabolic impairment of speech-relevant area. Brain 34. Ogawa T, Yoshida Y, Okudera T, Noguchi K, Kado H, Uemura K.
Lang. 1998;230:215–230. Secondary thalamic degeneration after cerebral infarction in the
13. Thomas C, Altenmüller E, Marckmann G, Kahrs J, Dichgans J. middle cerebral artery distribution: Evaluation with MR imaging’.
Language processing in aphasia: Changes in lateralization Radiology. 1997;204:255–262.
patterns during recovery reflect cerebral plasticity in adults. 35. Haque ME, Gabr RE, Hasan KM, et al. Ongoing secondary degen-
Electroencephalogr Clin Neurophysiol. 1997;102:86–97. eration of the limbic system in patients with ischemic stroke: A lon-
14. Brodtmann A, Werden E, Pardoe H, et al. Charting cognitive and gitudinal MRI study. Front Neurol. 2019;10:154.
volumetric trajectories after stroke: Protocol for the Cognition 36. Schaapsmeerders P, Tuladhar AM, Maaijwee NAM, et al.
And Neocortical Volume After Stroke (CANVAS) study. Int Lower ipsilateral hippocampal integrity after ischemic stroke in
J Stroke. 2014;9:824–828. young adults: A long-term follow-up study. PLoS One. 2015;10:
15. Spellacy FJ, Spreen O. A short form of the token test. Cortex. 1969; e0139772.
5:390–397. 37. Khlif MS, Egorova N, Werden E, et al. A comparison of automated
16. Benton AL, Hamsher K. Multilingual aphasia examination manual. segmentation and manual tracing in estimating hippocampal vol-
Iowa City University; 1978. ume in ischemic stroke and healthy control participants.
17. Kaplan E, Goodglass H, Weintraub S. Boston naming test. Lea & NeuroImage Clin. 2019;21:101581.
Febiger; 1983. 38. Kuceyeski A, Kamel H, Navi BB, Raj A, Iadecola C. Predicting fu-
18. Brandt J, Benedict RHB. Hopkins verbal learning test– ture brain tissue loss from white matter connectivity disruption in
revised. Psychological Assessment Resources; 2001. ischemic stroke. Stroke. 2014;45:717–722.
19. Rorden C, Bonilha L, Fridriksson J, Bender B, Karnath H-O. 39. Fox MD. Mapping symptoms to brain networks with the human
Age-specific CT and MRI templates for spatial normalization connectome. N Engl J Med. 2018;379:2237–2245.
Christopher. Neuroimage. 2012;61:957–965. 40. Padmanabhan JL, Cooke D, Joutsa J, et al. A human depression cir-
20. Rorden C, Karnath H-O, Bonilha L. Improving lesion-symptom cuit derived from focal brain lesions. Biol Psychiatry. 2019;86(10):
mapping. J Cogn Neurosci. 2007;19:1081–1088. 749–758.
21. Ithapu V, Singh V, Lindner C, et al. Extracting and summarizing 41. Fotenos AF, Snyder AZ, Girton LE, Morris JC, Buckner RL.
white matter hyperintensities using supervised segmentation meth- Normative estimates of cross-sectional and longitudinal
ods in Alzheimer’s disease risk and aging studies. Hum Brain brain volume decline in aging and AD. Neurology. 2005;64:
Mapp. 2014;35:4219–4235. 1032–1039.
22. Reuter M, Schmansky NJ, Rosas HD, Fischl B. Within-subject tem- 42. Driscoll I, Davatzikos C, An Y, et al. Longitudinal pattern of region-
plate estimation for unbiased longitudinal image analysis. al brain volume change differentiates normal aging from MCI.
Neuroimage. 2012;61:1402–1418. Neurology. 2009;72:1906–1913.
23. Reuter M, Fischl B. Avoiding asymmetry-induced bias in longitu- 43. Schippling S, Ostwaldt AC, Suppa P, et al. Global and regional an-
dinal image processing. Neuroimage. 2011;57:19–21. nual brain volume loss rates in physiological aging. J Neurol. 2017;
24. Desikan RS, Ségonne F, Fischl B, et al. An automated labeling 264:520–528.
system for subdividing the human cerebral cortex on MRI scans 44. Dhollander T, Clemente A, Singh M, et al. Fixel-based analysis of
into gyral based regions of interest. Neuroimage. 2006;31: diffusion MRI: Methods, applications, challenges and opportun-
968–980. ities. Neuroimage. 2021;241:118417.12 | BRAIN COMMUNICATIONS 0000: Page 12 of 12 N. Egorova-Brumley et al.
45. Faroqi-Shah Y, Milman L. Comparison of animal, action and 50. Fridriksson J, Yourganov G, Bonilha L, Basilakos A, Den Ouden
phonemic fluency in aphasia. Int J Lang Commun Disord. 2018;53: D-B, Rorden C. Revealing the dual streams of speech processing.
370–384. Proc Natl Acad Sci U S A. 2016;113:15108–15113.
46. Tremblay P, Dick A. Broca and Wernicke are dead, or moving past 51. Sabb FW, Bilder RM, Chou M, Bookheimer SY. Working memory
the classic model of language neurobiology. Brain Lang. 2016;162: effects on semantic processing: Priming differences in pars orbitalis.
60–71. Neuroimage. 2007;37:311–322.
47. Belyk M, Brown S, Lim J, Kotz SA. Convergence of semantics and 52. Jefferies E, Lambon Ralph MA. Semantic impairment in stroke
emotional expression within the IFG pars orbitalis. Neuroimage. aphasia versus semantic dementia: A case-series comparison.
2017;156:240–248. Brain. 2006;129:2132–2147.
48. Binder JR, Desai RH, Graves WW, Conant LL. Where is the 53. Benedek M, Jauk E, Sommer M, Arendasy M, Neubauer AC.
semantic system? A critical review and meta-analysis of 120 Intelligence, creativity, and cognitive control: The common and dif-
functional neuroimaging studies. Cereb Cortex. 2009;19: ferential involvement of executive functions in intelligence and cre-
2767–2796. ativity. Intelligence. 2014;46:73–83.
49. Hickok G, Poeppel D. The cortical organization of speech process- 54. Yang M, Yang P, Fan YS, et al. Altered structure and intrinsic functional
ing. Nat Rev Neurosci. 2007;8:393–402. connectivity in post-stroke aphasia. Brain Topogr. 2018;31:300–310.
Downloaded from https://academic.oup.com/braincomms/article/4/2/fcac061/6549918 by guest on 05 July 2022You can also read