Africans want open elections - especially if they bring change - By Michael Bratton and Sadhiska Bhoojedhur
←
→
Page content transcription
If your browser does not render page correctly, please read the page content below
Africans want
                open elections –
especially if they bring change
          By Michael Bratton and Sadhiska Bhoojedhur

              Afrobarometer Policy Paper No. 58 | June 2019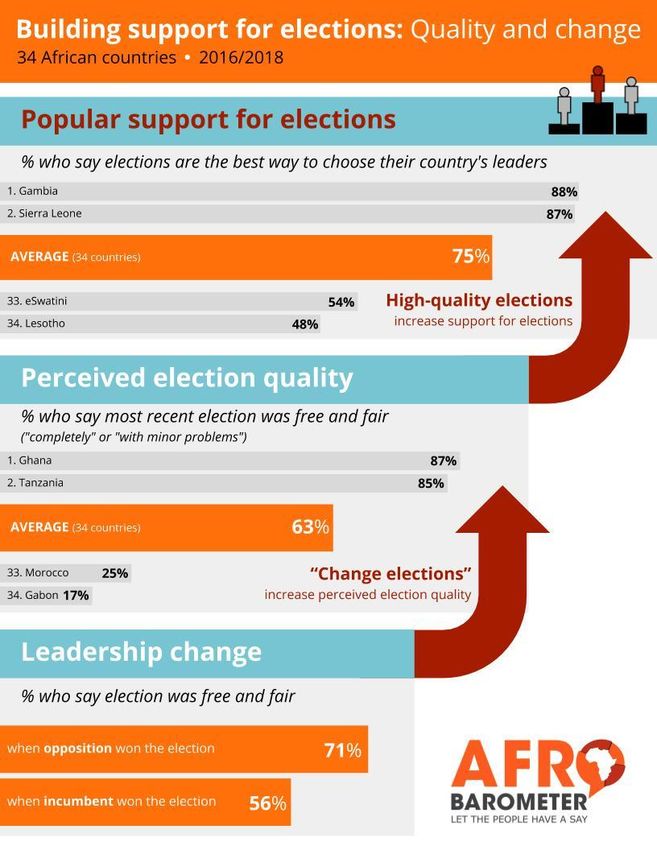
Introduction
Observers now commonly assert that multiparty elections are institutionalized as a standard
feature of African politics (Posner & Young, 2007; Bratton, 2013; Cheeseman, 2018; Bleck &
van de Walle, 2019). By this they mean that competitive electoral contests are the most
commonplace procedure for choosing and changing political leaders across the continent.
As a result of a wave of regime transitions in the 1990s, the vast majority of African countries
                         abandoned one-party systems and military rule in favour of
                         democratic constitutions that guarantee – at least on paper – civil
                         and political rights, civilian control of the military, and legislative and
                         judicial oversight of the executive branch of government. Almost all
                         countries have introduced a regular cycle of elections (usually every
                         five years), and many have placed constitutional limits on the number
                         of terms that African presidents can serve (usually two). Today,
                         encouraged by the African Union’s African Charter on Democracy,
                         Elections and Governance, all political leaders feel compelled to pay
at least token respect to a new set of continent-wide electoral standards.
In short, elections are now embedded in the formal rules that govern politics on the
continent. But the institutionalization of elections requires more than an international
proclamation, an aspirational constitution, and a tightly drafted framework of statutes and
regulations. It also requires political actors at all levels of the political system to grant value to
open elections as the preferred method for selecting leaders and holding them
accountable. In other words, politicians and citizens alike must make sincere commitments
to hold elections dear and to offer vigorous protection if electoral procedures are ever
threatened.
Yet there is already evidence that some African presidents are all too ready to abandon
presidential term limits (Dulani, 2011) – a reversal, for example, that Togo’s Parliament ratified
in May 2019. And political leaders are too often tempted to manipulate election processes
and outcomes in order to retain power (Cheeseman & Klaas, 2018) – as Joseph Kabila
demonstrated in the December 2018 general election in the Democratic Republic of the
Congo (DRC).1 Under these circumstances, much of the burden for protecting open and
competitive elections falls to the ordinary citizens of Africa. The political commitments of the
man and woman in the street represent the last line of defense should leaders take it upon
themselves to violate widely accepted electoral norms.
Accordingly, several key questions arise: Do Africans actually support elections? Do they
regard African elections as free and fair? Do high-quality contests boost the value that
citizens attach to elections?
This Pan-Africa Profile offers affirmative answers to all these questions. Drawing from recent
Afrobarometer survey data covering more than 30 countries across Africa’s main
geographical regions, we find that Africans want open elections and, for the most part, think
they are getting them. Importantly, popular support for elections is driven by the perceived
freedom and fairness of the balloting process. Digging deeper, we find that the quality of
elections – and thus popular support – is seen to hinge on whether elections bring about
leadership alternation, which we define as a change not only of the top ruler but also of the
ruling party. This “change effect” suggests that the political preferences of the general public
are just as essential as formal political rules – if not more so – to the health of democracy in
Africa.

1
 Election observers from the Catholic Church claimed that Kabila colluded to anoint the purported winner,
Felix Tshisekedi, who actually finished far behind the real winner, Martin Fayulu.

Copyright ©Afrobarometer 2019                                                                          1
Afrobarometer survey
Afrobarometer is a pan-African, non-partisan research network that conducts public attitude
surveys on democracy, governance, economic conditions, and related issues in African
countries. Six rounds of surveys were conducted between 1999 and 2015. Findings from
Round 7 surveys, covering 45,823 respondents in 34 countries between September 2016 and
September 2018, are currently being released. Interested readers may follow our releases,
including our Pan-Africa Profiles series of cross-country analyses, at #VoicesAfrica and sign up
for our distribution list at www.afrobarometer.org.
Afrobarometer conducts face-to-face interviews in the language of the respondent’s choice
with nationally representative samples that yield country-level results with margins of error of
+/-2 to +/-3 percentage points at a 95% confidence level.
This policy paper draws mainly on Round 7 data, with over-time comparisons for countries
surveyed in earlier rounds (see the Appendix for a list of countries and survey dates). The
data are weighted to ensure nationally representative samples. Each country is weighted
equally; the Africa-wide data below are thus averages of national data, without adjustment
for the size of the national populations.
Pan-Africa Profiles typically present data and analysis in aggregate form. For example, this
paper reports average proportions of public opinion for African countries. In other words, we
use the country – rather than the individual citizen – as the main unit of analysis. These
summary results complement other Afrobarometer publications that focus on the
disaggregated opinions of various demographic groups within particular countries. A wider-
angle lens enables cross-national comparisons that rank countries on various public opinion
indicators. It also allows consideration of other factors measured at the macro level (in this
instance, the type of electoral system in each country and the total number of elections
conducted). Finally, the bigger-picture approach of Afrobarometer Pan-Africa Profiles
facilitates over-time comparisons of whole countries through several survey rounds as well as
the construction of continent-wide trend lines over time.

Key findings

   ▪   On average, three-quarters (75%) of the Africans interviewed in 2016/2018 say they
       prefer to use regular, open, and honest elections to choose their country’s leaders.
       But popular support for elections was somewhat higher in the recent past, reaching
       83% across 35 countries surveyed in 2011/2013.
   ▪   Almost two-thirds (63%) of all Africans interviewed see the last national election in
       their country as having been free and fair (either “completely” or “with minor
       problems”). About one in four say it had “major problems” (13%) or was “not free and
       fair” (15%). Popular assessments of election quality have remained almost
       unchanged since 2005.
   ▪   Citizens who think their most recent elections were free and fair are more likely to
       support elections as the best way to choose their leaders.
   ▪   Surprisingly, opposition-party supporters are almost as likely as ruling-party supporters
       to see their elections as free and fair. Non-partisans are far less likely to perceive
       electoral integrity.
   ▪   Popular support for elections is higher in countries with two-round presidential
       electoral systems than in systems in which leaders are chosen indirectly by
       parliamentary majorities or that allow winners to take office with less than 50% of the
       votes.
   ▪   Importantly, the perceived quality of elections is closely linked to electoral changes in
       ruling party. Whereas 71% of Africans infer free and fair conduct in the wake of an
       electoral alternation, just 56% see the same for elections that confirm the incumbent
       party in power.

Copyright ©Afrobarometer 2019                                                               2
▪   We conclude that support for elections is a function of both leadership alternation
       and perceived election quality. Indeed, alternation is embedded in popular
       perceptions of electoral quality as the strongest evidence for what constitutes a high-
       quality election. Simply stated, Africans support “change elections.”

Copyright ©Afrobarometer 2019                                                            3
Popular support for elections
To gauge popular support for elections, Afrobarometer presents survey respondents with a
choice: Which of the following statements is closer to your view?
1. We should choose our leaders in this country through regular, open, and honest
elections.
2. Since elections sometimes produce bad results, we should adopt other methods for
choosing this country’s leaders.
On average, a large majority (75%) of the Africans interviewed in 2016/2018 say they prefer
to use open elections to choose their country’s leaders (see Figure 1). More than half (54%)
feel “very strongly” that elections are a more desirable procedure than “some other
method.” We do not know what “other methods” respondents may have had in mind. But
we assume that these include schemes tried previously, such as monarchical or chiefly
inheritance, selection by councils of elders, controlled plebiscites, or seizures of power by
civilian or military insiders. The main point, however, is that for contemporary Africans, open
elections outdo all alternative methods of leadership selection that may have been
employed in Africa in the past.
Figure 1: Popular support for elections | 34 countries | 2016/2018
100%
80% 75%
21%
60%
Support
40%
23% Support very
54% strongly
20% 9%
14%
0%
Elections Other methods
In wording the survey question, we went out of our way to make sure people’s answers
made reference to elections that were “regular” (meaning on time), “open” (meaning free),
and “honest” (meaning fair). Nonetheless, it remains possible that some respondents simply
endorse the sort of less-than-competitive contests that remain a common feature in
dominant-party states. The extreme version of this type of election under single-party
constitutions allowed only one candidate for president and candidates from only one
political party to run for the legislature. So the survey also explicitly asks about popular
support for multiparty competition. The question is again posed as a choice between two
statements:
1. Political parties create division and confusion; it is therefore unnecessary to have
many political parties in [this country].
2. Many political parties are needed to make sure that [the citizens of this country] have
real choices in who governs them.
Copyright ©Afrobarometer 2019 4Whereas, on average across 34 countries, just 33% agree with the first statement, fully 63%
endorse the second statement (42% “very strongly”). Moreover, in the 16 countries for which
we have data since 2002, the proportion that supports multiparty competition has gradually
risen from 55% to 64% (not shown). More importantly, there is a strong cross-country
correlation between the proportion supporting elections and the proportion supporting
multiparty competition.2 This statistically robust linkage helps to allay concern that citizens are
expressing satisfaction with non-competitive elections; instead, they clearly associate the
notion of elections with open contests among two or more political parties.
The level of popular support for open elections is not equally strong everywhere; indeed,
support varies greatly across countries. As shown in Figure 2, support for elections is
particularly high in certain West African countries, including the Gambia (88%), Sierra Leone
(87%), Côte d’Ivoire (84%), and Liberia (84%). But support for elections is far lower in a number
of Southern African countries, such as Mozambique (61%), South Africa (61%), Malawi (57%),
and eSwatini (54%). In Lesotho, fewer than half of all adults (48%) express overt support for
elections.
Perhaps the popularity of elections depends on whether voting choice is a novel
phenomenon. If a given contest is a “founding” election – that is, if it signals a possible
regime transition, usually toward democracy after a long period of autocratic rule – then
people are likely to welcome the unfamiliar opportunity to vote for their leaders. If, however,
the most recent election is just business as usual in a long sequence of routine contests, and
especially if democratization has not brought about observable change in people’s lives,
then people may be lukewarm in their support. In this regard, the institutionalization of
elections may be a mixed blessing, especially if popular familiarity with a string of low-quality
procedures tends to breed apathy, even contempt.
Selected country examples support this proposition about recent electoral experience. In the
Gambia, for example, euphoric levels of citizen enthusiasm for elections probably reflect
what the BBC (2016) called “one of the biggest election upsets West Africa has ever seen.”
The November 2016 victory of challenger Adama Barrow, followed by the January 2017 exile
of incumbent Yahya Jammeh at the hands of an ECOWAS military force, represented the
Gambia’s first change of regime in more than 20 years. By contrast, the June 2017 National
Assembly elections in Lesotho were called more than three years ahead of schedule
because Prime Minister Pakalitha Mosisili had lost the confidence of both Parliament and his
own deputy. Incoming Prime Minister Tom Thabane, an old-guard politician recently returned
from exile, was sworn in while grieving the assassination of his wife and facing infighting in the
armed forces. The voters of Lesotho therefore had reasons to conclude that elections in their
country had allowed squabbling political elites to appropriate power.
Indeed, popular support for elections was somewhat higher in Africa in the recent past, that
is, during a wave of regime transitions. In the 18 countries that Afrobarometer has tracked
consistently since 2005, average support declined from 82% to 74% over the past 13 years
(see Figure 3). A preference for “other methods” of choosing leaders has risen in tandem
from 16% to 24% over the same period. Paradoxically, the downward trend in support for
elections contradicts the previously documented rise in support for multiparty competition.
Perhaps the electorate is gaining a nuanced appreciation for the double-edged sword of
electoral institutionalization. To be sure, citizens welcome the expanded range of political
choice made available by the broadening and deepening of competitive party politics. At
the same time, however, people are recognizing that regular elections alone do not satisfy
the full gamut of popular hopes, not least for consolidated democracy, but also for social
and economic development.
2
Pearson’s correlation coefficient r = .407, sig. =.017
Copyright ©Afrobarometer 2019 5Figure 2: Support for elections | by country | 34 countries | 2016/2018
Gambia 88%
Sierra Leone 87%
Côte d'Ivoire 84%
Liberia 84%
Uganda 83%
Benin 83%
Zambia 82%
Mali 81%
Ghana 81%
Guinea 80%
Senegal 80%
Tanzania 80%
São Tomé and Príncipe 79%
Sudan 78%
Namibia 78%
Botswana 78%
Zimbabwe 78%
Mauritius 77%
Kenya 77%
Burkina Faso 77%
Madagascar 76%
34-country average 75%
Niger 74%
Togo 73%
Nigeria 72%
Cabo Verde 72%
Morocco 70%
Cameroon 70%
Gabon 68%
Tunisia 64%
Mozambique 61%
South Africa 61%
Malawi 57%
eSwatini 54%
Lesotho 48%
0% 20% 40% 60% 80% 100%
Figure shows % of respondents who “agree” or “agree very strongly” that leaders should be chosen
through regular, open, and honest elections.
Copyright ©Afrobarometer 2019 6Figure 3: Support for elections | 18 countries | 2005-2018
100%
82% 83% 82%
77% 74%
80%
60% Support
elections
40% Support
24% other
20% 17%
16% 15% methods
20%
0%
2005/2006 2008/2009 2011/2013 2014/2015 2016/2018
Figure shows % of respondents who “agree” or “agree very strongly” with each statement.
A breakdown by country of changes in popular support for elections reinforces the observed
downward continental trend. Of the 15 countries displayed in Figure 4, all except Namibia
experienced meaningful declines (minus 5 percentage points or more) in aggregate support
over the period 2005-2018. Instances of popular disillusionment with the electoral process are
not hard to find. In Benin in April 2019, voter turnout sank to a record low of 23% in
parliamentary elections held without any opposition; all candidates came from just two
approved parties, both allied with the sitting president, Patrice Talon (France24, 2019). And in
South Africa, about 10 million people eligible to vote, many of them young people, never
cast a ballot in national and provincial elections of May 2019 because they had failed to
register as voters.
Figure 4: Changes in support for elections | by country | 2005-2018
Namibia 8
-5 Madagascar
-5 Mali
-5 Zambia
-6 Malawi
-7 Uganda
-7 Botswana
-8 Senegal
-9 Tanzania
-9 Ghana
-11 Kenya
-11 Benin
-19 Mozambique
-22 South Africa
-29 Lesotho
-40 -30 -20 -10 0 10
Figure shows change, in percentage points, since Round 3 (2005/2006) in % of respondents who
“agree” or “agree very strongly” that leaders should be chosen through regular, open, and honest
elections. Three countries are not shown because they recorded little change (It is therefore unexpected that support for elections is as high as Africans say it is. When
prompted, people reveal that, in practice, they harbor reservations about the efficacy of
these institutions. When last asked (in 2014/2015), respondents were split as to whether
elections ensure that voters’ views are reflected in policy debates and whether elections
enable voters to remove underperforming leaders. On both these indicators of institutional
effectiveness, about four in 10 respondents said that elections perform well – but about five
in 10 said they perform badly (Penar, Aiko, Bentley, & Han, 2016). So, if anything, the public
was doubtful that elections are a reliable instrument of popular will.
In sum, recent Afrobarometer surveys reveal evidence that popular enthusiasm for elections
has waned somewhat since the high-water mark of democratization in Africa at the
beginning of the new century. Perhaps, as a result of hard-won experience with actual
electoral practice, popular jubilation over the once-novel procedure of open voting begins
to wear off with the passage of time. But a balanced conclusion is required. With three-
quarters of all adults expressing overt support for elections and almost two-thirds confirming a
preference for multiparty competition, the metaphorical glass appears much more than half
full. Based on the most recent observations from a long series of over-time data, however,
popular support for open elections is on a downward trajectory. To stretch the metaphor,
there is a leak in the bottom of the glass that does not augur well for sustaining widespread
support for competitive elections over the longer run.
The perceived quality of elections
At minimum, the institutionalization of elections requires that governments convene a
popular vote on a regular cycle. Although eager would-be voters sometimes face delays –
see, for example, the two-year postponement of the 2018 ballot in the DRC – lapses in
election schedules are exceptions to the rule. Every year, presidential and legislative
elections now routinely take place on a timely basis in about a dozen of the continent’s 54
countries.3 In short, few concerns remain today about the quantity of elections in Africa.
Some commentators argue that repetitive elections are sufficient to chart a path toward
democracy. The influential theory of “democratization by elections” posits that an
uninterrupted series of elections has “self-reinforcing power” to gradually precipitate
expanding civil liberties, even regime change (Lindberg, 2006, p. 2). According to this theory,
“the link between elections and democratization is not … tied to the freedom and fairness of
elections” (Lindberg, 2009, p. 328). In essence, it is the frequency of elections that creates
democratic change, or so goes the
argument; the quality of these contests is
Do your own analysis of Afrobarometer data – apparently less important.
on any question, for any country and survey
We disagree. A repetitive cycle of elections
round. It’s easy and free at
may be a necessary condition for
www.afrobarometer.org/online-data-analysis.
democratization, but it is not sufficient.
Attention must be paid not only to the
quantity of elections but also to their quality.
While a sequence of high-quality contests may well contribute to the construction of
democracy, a series of less-than-perfect elections can lend longevity and legitimacy to
illiberal or authoritarian rule. Other theorists note the contribution of low-quality elections to
the worldwide emergence of competitive authoritarianism, a regime in which contestation is
“real but unfair” because it is never played out on “a reasonably level playing field” (Levitsky
& Way, 2010, pp. 5 and 7). The electoral terrain is uneven because incumbents use state
resources to promote their own partisan campaigns and to block political opportunities for
opposition forces.
3
Although national elections adhere to a regular cycle, the convocation of local government elections remains
more intermittent in many countries.
Copyright ©Afrobarometer 2019 8So, do Africans themselves see the elections in their countries as free and fair? Afrobarometer
asks a direct question:
On the whole, how would you rate the freeness and fairness of the last national election,
held in [20XX]?
On average in 34 countries across the continent, only two in five Africans interviewed (42%)
see the last national election in their country as “completely free and fair” (see Figure 5). But
a further one-fifth think this election was free and fair with just “minor problems” (21%). while
13% say it had “major problems.” Importantly, only 15% describe the election as “not free
and fair.” Moreover, when last asked (in Afrobarometer Round 5, 2011/2013) about a key
element of electoral integrity – the secret ballot – almost eight in 10 respondents did not think
that “someone powerful” could discover how they had voted.
Figure 5: Perceived quality of elections | 34 countries | 2016/2018
100%
80%
60%
42%
40%
21%
20% 15% 13%
9%
0%
Not free and fair Free and fair, Free and fair, Completely free Don't
with major with minor and fair know/Refused
problems problems
Respondents were asked: On the whole, how would you rate the freeness and fairness of the last
national election, held in [20XX]?
The distribution of public opinion on election quality has remained remarkably stable over
time. As Figure 6 shows for 18 countries, the proportion seeing high-quality elections (either
“completely free and fair” or “free and fair with minor problems”) is effectively the same in
2017 (68%) as it was in 2005 (66%).4 And the trend lines for this opinion remains largely flat
between these data points. Bleck and van de Walle have noted a “paradoxical disjuncture
between the great changes in African society and the relative stagnation in its politics” and
argue that “the quality of … elections and the democratic institutions that structure them
have not changed dramatically in most countries” (2019, pp. 8 and 20). As we suggest
below, continuity in public viewpoints about election quality is in part an artifact of the
averaging of diverse opinion across countries on divergent political paths. But it also reflects
uncertainty in the public mind born of a persistent lack of transparency of electoral
processes, especially in less democratic countries.
4
The difference falls within the surveys’ margin of sampling error of +/-3 percentage points.
Copyright ©Afrobarometer 2019 9Figure 6: Perceived quality of elections | 18 countries | 2005-2018
100%
80%
70% 68% 68%
66% 64%
60% See high-
quality
election
40%
28% See low-
25% 23% 25%
quality
18%
20% election
0%
2005/2006 2008/2009 2011/2013 2014/2015 2016/2018
Respondents were asked: On the whole, how would you rate the freeness and fairness of the last
national election, held in [20XX]? (“High-quality elections” = “completely free and fair” or “free and fair
with minor problems”; “Low-quality elections” = “free and fair with major problems” or “not free and
fair”)
As usual, continental averages conceal major cross-country differences. According to
popular perceptions, several African countries run high-quality elections. More than eight in
10 adults in places such as Ghana (87%), Tanzania (85%), and Botswana (85%) regard
national elections as completely free and fair or, at worst, as displaying only minor problems
(see Figure 7). But in certain other countries, more than half the adult population label
elections as having major problems or being altogether unfree and unfair. Very low levels of
perceived election quality are reported in Morocco (25%), Sudan (28%), and Malawi (32%),
where fewer than one-third of citizens think their country’s elections meet desired standards.
At the bottom of the list is Gabon, where only 17% see acceptably free and fair elections.
Consider the latest elections in the countries at the extreme ends of this range. In Ghana in
December 2016, the leader of the opposition, Nana Akufo-Addo, was elected president,
displacing incumbent John Mahama in a single round of voting. The former was humble in
victory and the latter conceded gracefully, quickly announcing respect for the will of the
electorate. In the opinion of a seasoned observer, Ghana “continued to uphold the tradition
of peaceful elections. … Indeed, since 2000, Ghanaians have three times voted out of office
an incumbent in highly contested, but fair, peaceful and credible elections” (Mbaku, 2016).
By contrast, the August 2016 presidential election in Gabon was deeply flawed. The
campaign of the incumbent, Ali Bongo Ondimba, was marred by the defection of core
ruling-party allies even as a fragmented opposition began to unify around the challenger,
diplomat Jean Ping. Yet Bongo claimed a razor-thin victory, including returns showing 99%
turnout and 96% approval in his home district. These unlikely results sparked widespread
protests – the Parliament building was set on fire – but could not prevent a Constitutional
Court ruling in the incumbent’s favour and Bongo’s reinstallation for a second term,
extending the Bongo family’s hold on power beyond 47 years.
In sum, the contrast in public reactions between Ghana and Gabon suggests that Africans
are accurate judges of the quality of their own country’s elections. That said, and from the
perspective of overall continental averages, citizen assessments of electoral quality perhaps
appear overly generous. After all, the modal cross-national response is “completely free and
fair,” an assessment that might strike many as implausibly charitable (see Figure 5). Since
ordinary folk probably lack information about the more opaque aspects of the election
process, they may be inclined to give the benefit of the doubt to results announced by
Copyright ©Afrobarometer 2019 10official election management bodies. Or people may be risk-averse; they simply want to
move on after elections, no matter the outcome.
Figure 7: Perceived quality of elections | by country | 34 countries | 2016/2018
Ghana 87% 8% 5%
Tanzania 85% 12% 3%
Botswana 85% 8% 8%
Liberia 84% 15% 1%
Mauritius 83% 9% 8%
Namibia 82% 9% 9%
Burkina Faso 81% 11% 8%
Sierra Leone 81% 13% 7%
Benin 81% 18% 1%
Lesotho 79% 14% 7%
Gambia 76% 15% 8%
Mali 76% 18% 6%
eSwatini 73% 12% 15%
Madagascar 70% 23% 7%
South Africa 69% 23% 9%
Nigeria 67% 31% 1%
São Tomé and Príncipe 67% 24% 9%
Cabo Verde 65% 28% 7%
Côte d'Ivoire 65% 24% 11%
34-country average 63% 28% 9%
Kenya 62% 30% 8%
Guinea 61% 33% 6%
Uganda 60% 34% 6%
Zambia 60% 35% 5%
Niger 60% 32% 8%
Senegal 59% 30% 11%
Mozambique 53% 27% 21%
Zimbabwe 49% 38% 14%
Tunisia 48% 41% 11%
Cameroon 43% 32% 25%
Togo 39% 47% 14%
Malawi 32% 57% 11%
Sudan 28% 57% 15%
Morocco 25% 59% 17%
Gabon 17% 79% 3%
0% 20% 40% 60% 80% 100%
High quality Low quality Don't know
Respondents were asked: On the whole, how would you rate the freeness and fairness of the last
national election, held in [20XX]? (“High quality” = “completely free and fair” or “free and fair with
minor problems”; “Low quality” = “free and fair with major problems” or “not free and fair”)
The reliability of public opinion about election quality can be tested against a common
standard such as the Freedom House (2019) Freedom in the World index. The outcome is
mixed. This index scores 10 of the 34 countries in Afrobarometer Round 7 as “free,” while the
Copyright ©Afrobarometer 2019 11remainder are either “partly free” or “not free.”5 As expected, we find that citizens in free
countries are more likely to perceive good-quality elections than their counterparts in less-
than-free countries (70% vs. 60%). Thus, to some extent, popular opinion mirrors expert
judgments. But two caveats are in order. First, the difference between opinions in the two
types of country is not statistically significant.6 And second, an average of fully six in 10
citizens perceive nothing more than “minor” problems with electoral conduct in the 24
countries that Freedom House rates as less than free. In this regard, competitive authoritarian
regimes habitually receive a clean bill of electoral health from their own citizens.
The uncertainty that some citizens feel about the actual quality of their country’s elections is
evident at the country level. As Figure 8 shows, Tanzanians and Zimbabweans apparently
feel that the quality of their elections is improving, even though the management of these
contests remains tightly controlled. And Kenyans and Senegalese seem to feel that the
quality of their ballots is declining, even though the campaign atmosphere in their countries’
well-run and much more open contests has been marked by growing and shifting pluralism.
The mixed record of citizen judgments about election quality is perhaps best illustrated by
trends in Nigeria and Zambia, which citizens regard as showing the most improvement of all
countries surveyed. Citizens are correct that Nigeria’s March 2015 presidential election
marked a zenith in the quality of electoral administration in that country (up 35 points
between 2005 and 2017). But endorsement by Zambians of August 2016 general elections
(up 30 points between 2005 and 2017) is more puzzling, since it was marred by the muzzling
of the country’s leading independent newspaper, accusations of the incitement of violence
from both sides, and the subsequent jailing of the main opposition leader.
Figure 8: Changes in perceived quality of elections, by country | 2005-2018
Nigeria 35
Zambia 30
Zimbabwe 13
Mali 12
Ghana 10
Cabo Verde 9
Benin 7
Tanzania 6
Namibia 5
-6 South Africa
-7 Uganda
-8 Madagascar
-11 Malawi
-17 Kenya
-19 Senegal
-24 Mozambique
-40 -30 -20 -10 0 10 20 30 40
Figure shows change, in percentage points, since Round 3 (2005/2006) in % of respondents who say
that their most recent national election was “completely free and fair” or “free and fair with minor
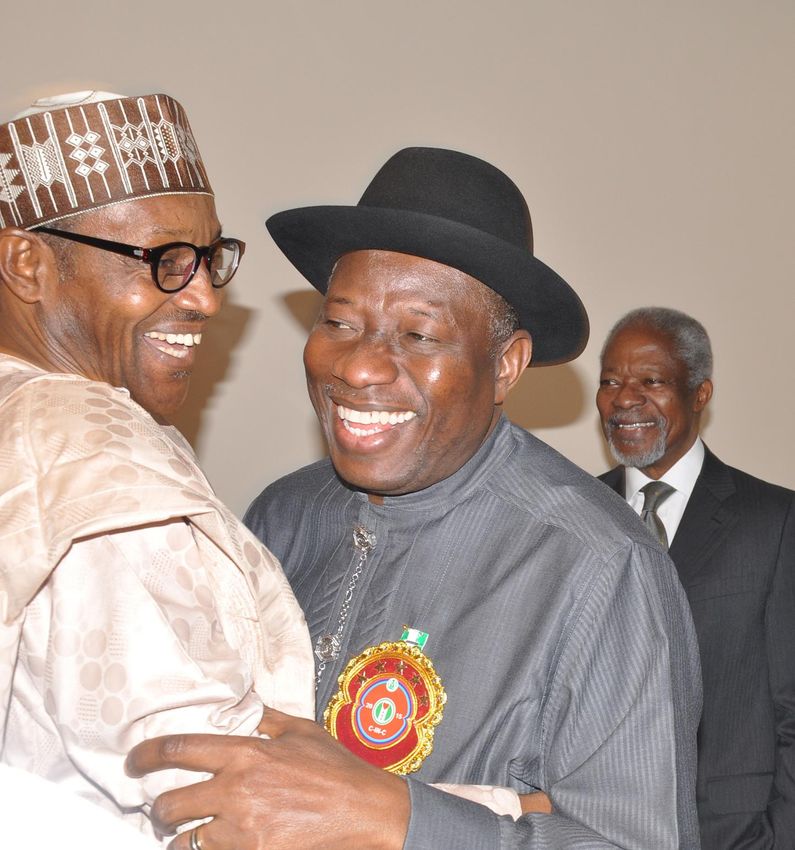
problems.” Two countries are not shown because they recorded little change (An important difference between the Nigerian and Zambian elections is that the former resulted in an alternation of winners and losers, while the latter did not. In Nigeria, the All Progressives Congress of Muhammadu Buhari ousted Goodluck Jonathan’s Peoples Democratic Party from control of the presidency. But in Zambia, the Patriotic Front extended its hold on the presidency for Edgar Lungu and enhanced its majority in Parliament. Intriguingly, this contrast suggests that popular perceptions of electoral quality may be shaped by the alternation of leaders, a theme we will return to later. Does perceived election quality affect popular support for elections? For the moment we analyze whether the perceived quality of elections – correct or not – has an observable effect on popular support for elections. We would certainly expect it to do so. Indeed, Norris (2014, 2015, 2017) has argued that the integrity of elections enhances political legitimacy, whereas failed elections undermine the claims of leaders that they have a right to rule. The legitimacy of a regime derives in part from political recognition by other countries and bodies in the international arena. But the bulk of the essential resource of legitimacy is granted (or not granted) by the citizenry itself. So it stands to reason that mass perceptions of whether voting processes are free and fair ought to inform the level of popular support for elections. The data provide affirmative evidence. Figure 9 plots aggregate scores for 34 countries to show a positive relationship (an upward-sloping fit line) between the perceived quality of elections (X-axis) and the level of citizen support for elections (Y-axis). The associated correlation coefficient (r =.315, sig =.070) suggests that each variable accounts for a meaningful amount of variance in the other. While correlation is not causation, we find it likely that citizens use assessments of election quality as a benchmark for deciding whether they support elections. In other words, they defend elections if they are cleanly run but not if they think electoral procedures are manipulated. This logic is more plausible than the reverse, that is, that citizens use some sort of innate or automatic support for elections (come hell or high water) to drive their judgments about election quality. In some countries – such as Tunisia and Mali in Figure 9 – citizen assessments of election quality are precise predictors of mass support for elections. In Tunisia, for example, low levels of perceived quality (just 48% think elections are free and fair) are associated with relatively low levels of popular support for elections (65%, as compared with a pan-African average of 75%). By contrast, Malians express an above-average opinion of the quality of elections in their country (76% consider that these are largely free and fair) and, consequently, also extend popular support to the whole idea of using electoral mechanisms to choose national leaders (81%, with 57% “very strongly”). It is noteworthy that the link between election quality and support for elections is most robust at the high end. In Figure 9, the country cases cluster more closely around the fit line in the upper-right part of the scatterplot than in the lower-left. This pattern suggests that the quality of elections is an increasingly reliable source of popular support for elections in places where citizens think elections are freer and fairer. According to the latest Afrobarometer data, these places include countries that have undergone recent transitions from autocratic to democratic rule – such as the Gambia, Sierra Leone, and Liberia – as well as countries whose democracies have developed deeper roots – such as Ghana, Botswana, and Namibia. It must also be remembered that any observed relationship between election quality and support for elections is probabilistic rather than perfect. In an unruly political world, there will always be outlying cases that do not fit the general mold. Many of these cases cluster at the bottom of the spectrum where either popular support or perceived quality is low. Figure 9 indicates that citizens in countries such as Lesotho, eSwatini, and South Africa fail to strongly endorse electoral methods even though they think elections are conducted cleanly in their countries. In eSwatini and Lesotho, at least part of this anomaly may be due to conservative backers of the monarchy who prefer to see leaders selected by heredity rather than election. In South Africa, survey respondents may be lamenting the fact that even as a Copyright ©Afrobarometer 2019 13
professional electoral commission routinely conducts honest elections, other institutions of
government have become deeply tainted by corruption.
A contrasting set of outlying cases can be found in Sudan, Morocco, and Gabon. In these
places, citizens harbor a high level of attachment to elections but are much less likely than
the average African to think that elections are conducted cleanly in their own country.
Many here can be described as “dissatisfied democrats,” that is, individuals who feel that
they are being supplied with less democracy than they persistently demand (Mattes, 2019).
One important implication is that citizens who support elections as an ideal but rue the low
quality of elections in practice may well provide a constituency for electoral and
democratic reform. This prospect came to pass in the dramatic events of April 2019 in Sudan,
when an idealistic popular movement used street protests to oust an entrenched military
strongman and demand a civilian successor government.

Figure 9: Support for elections by perceived quality | 34 countries | 2016/2018
 Support elections

                                        See free and fair elections

The underlying connection between election quality and support for elections is highlighted
in sharp relief once outlying cases are excluded. Rather than covering all 34 country cases,
we re-ran the analysis after dropping the six outliers in Figure 9 – Lesotho, eSwatini, South
Africa, Sudan, Morocco, and Gabon (see previous paragraph). A correlation test on the
remaining 28 cases boosts the covariance from less than one-third (r = .315) to almost two-
thirds (r = .660). From this perspective, it seems safe to assume that the perceived quality of
elections is a major component of popular support for elections in Africa. Moreover, a
virtuous cycle – with better elections reinforcing popular support – appears to take hold as
the quality of elections improves.

Institutional factors?
If competitive elections are becoming institutionalized, then perhaps the formal
characteristics of these emerging institutions are helping to shape public opinion. Most
observers would probably agree that elections are the most routinized of all democratic

Copyright ©Afrobarometer 2019                                                             14
institutions in Africa; they are more reliably embedded than other essential practices such as
civilian control of the military or legislative and judicial checks on the executive branch.
This section examines several institutional characteristics that may be relevant to the
formation of public opinion about elections:
• The electoral system mandated by a country’s constitution
• The total number of consecutive elections held in a country
• Whether presidential and legislative elections are held concurrently
• The time elapsed between the last election and the latest Afrobarometer survey
Let’s discuss each issue in turn. First, most African countries possess presidential rather than
parliamentary constitutions, including former British colonies that chose not to follow the
Westminster model. Even where presidents are elected indirectly by the legislature – as in
Botswana and South Africa – they still enjoy extensive executive powers. The most common
system for electing African presidents requires an absolute majority; if no candidate attains
more than 50% of the vote on a first round, then the election must go to a second round
between the top two vote-getters. Out of the 34 countries covered in Afrobarometer Round
7, 20 employ this system.7 The remaining countries select their political chief executive
(usually a president but sometimes a prime minister) either by indirect means (six countries) or
via a plurality system such as first-past–the-post (eight countries).
Second, we have already noted that almost all African countries now hold regular elections
at intervals required by national constitutions. Counting from 1990 –the latest transition to
multiparty politics – the median African country had held five rounds of national elections by
the end of 2017.8 Some 15 out of 34 countries in the latest Afrobarometer survey round had
reached this milestone. Some had progressed even further: 10 countries had held six
consecutive presidential and/or parliamentary elections. But Sudan – where elections were
repeatedly delayed – held only three national contests between 1990 and 2017. In Côte
d’Ivoire – where elections were resumed after a protracted civil war – only two national
voting contests were held after a regular electoral sequence was restored. Finally, open
elections have never been held in eSwatini, where political parties are banned, the upper
house is indirectly elected, and the monarch appoints some legislators.
Of the most recent elections in the remaining 33 countries (excluding eSwatini), the majority
(19, or 58%) were concurrent or general elections, meaning that presidential and legislative
contests were held on the same day. All remaining contests were for president only (nine) –
as in Senegal in 2012 – or Parliament only (five) – as in Mauritius in 2014. The time elapsed
between these elections and the survey averaged 28 months, with a range from four months
in Sierra Leone to 79 months in Cameroon. In other words, the survey occurred soon after the
last competitive election in Sierra Leone but almost seven years after a similar contest in
Cameroon.
It seems reasonable to expect that institutional factors would be related to public opinion.
But, according to Figure 10, correlation tests reveal only two statistically significant results.
First, popular support for elections is higher in countries with two-round presidential electoral
systems. Perhaps people appreciate a constitutional arrangement in which electoral winners
are required to amass an absolute majority of votes and thus a clear political mandate. Or
perhaps opposition supporters value a second chance to rally around a challenger in
situations where an incumbent fails to break the 50% threshold in the first round. Either way,
fewer citizens offer support to electoral systems in which leaders are chosen indirectly by
parliamentary majorities or – as with first-past-the-post systems – that allow winners to attain
office with less than 50% of the votes.
7
For example, Zambia reformed its constitution by adopting a two-round system in 2015.
8
Aggregate data for the 34 surveyed countries are drawn and updated from an existing source. We thank
Nicolas van de Walle and Jamie Bleck for sharing their data set of African elections, 1990-2015.
Copyright ©Afrobarometer 2019 15Second, the perceived integrity of elections is related to the previous number of elections
conducted in any given country. The longer the sequence of regular competitive contests,
the more likely that citizens will grant a clean bill of health to the authorities responsible for
conducting elections. In some cases, this outcome may be the results of genuine
improvements in the technical aspects of election administration, as has occurred in many
countries. In other cases, mass acceptance of election legitimacy may reflect weary
popular skepticism about often-unfounded claims of election rigging trotted out by
defeated opposition parties. Either way, this finding about the cumulative benefits of
repeated elections lends a measure of credence to the proponents of “democratization by
elections.”
Otherwise, the institutional characteristics of elections have little observable effect. As Table
1 shows, the type of election and the temporal proximity of the vote and the survey are
largely unrelated to either popular support for elections or citizen perceptions of the quality
of elections. None of these factors attains statistical significance, admittedly in part because
of the small size of the sample of countries. Nonetheless, by focusing only on the signs on the
coefficients, trace evidence can be found that citizens grant more legitimacy to concurrent
rather than separate presidential and legislative contests. Perhaps they find comprehensive
rather than piecemeal contests more salient to national needs and thus more deserving of
legitimacy. By contrast, citizen confidence in the electoral mechanism tends to erode as
time elapses since the last election was convened. People are especially likely to lose faith if
the period between the last election and the opinion survey violates an accepted electoral
schedule.
Table 1: Institutional factors and public opinion about elections | 33 countries
| 2016/2018
Popular support for Perceived quality of
elections elections
Type of electoral systema .385 (*) .048 (ns)
Total number of elections, 1990-2018 -.127 (ns) .365 (*)
Type of last electionb .086 (ns) .276 (ns)
Time lapse, election to AB survey -.199 (ns) -.219 (ns)
Cell entries are Pearson’s correlation coefficients; *significance =Party identification. First, what role partisanship? Afrobarometer’s standard questions ask:
Do you feel close to any particular political party? (If yes:) Which party is that?
We find that, on average, political partisanship is not widespread within African electorates.
Figure 10 shows that fewer than half (46%) of all respondents across 33 countries identify as
feeling close to a political party. In many countries, political parties are organizationally weak
and party systems are often inchoate and fluid, meaning barely institutionalized (Kuenzi &
Lambright, 2005; Elischer, 2013). Accordingly, it is hardly surprising that most people in Africa
do not express a deeply felt party ID; majorities remain independent, non-partisan, or
disengaged from politics.
Figure 10: Proportion of the electorate who identify with a political party | by country
| 33 countries | 2016/2018
Sierra Leone 75%
Uganda 67%
Tanzania 66%
Malawi 62%
Lesotho 61%
Guinea 60%
Namibia 60%
Botswana 59%
Kenya 59%
Niger 58%
Zimbabwe 58%
Ghana 57%
Gambia 55%
Mozambique 53%
Zambia 53%
Nigeria 48%
Liberia 48%
Senegal 46%
33-country average 46%
South Africa 45%
Mali 44%
Cameroon 40%
Côte d'Ivoire 40%
São Tomé and Príncipe 40%
Cabo Verde 37%
Burkina Faso 31%
Madagascar 29%
Benin 29%
Togo 29%
Sudan 29%
Gabon 28%
Tunisia 18%
Morocco 13%
Mauritius 12%
0% 20% 40% 60% 80% 100%
Respondents were asked: Do you feel close to any particular political party? (% who say “yes”)
(Note: Question was not asked in eSwatini, where political parties are banned.)
Copyright ©Afrobarometer 2019 17Nonetheless, levels of self-reported participation in partisan campaign activities are
remarkably robust. In the latest survey, some 38% of respondents say they attended an
election rally during the campaign for the last national election, and 21% say they worked for
a candidate or party. It is of course possible that non-partisans attend campaign rallies out of
political curiosity or in search of social contact or token rewards. And it is unclear how
respondents conceive of “working” for a candidate or party; a broad definition could
include simply urging acquaintances to vote a certain way.
Again, a partial resolution of inconsistent results can be found in cross-country differences.
Countries with dominant parties tend to register higher proportions of self-professed partisans,
as in Uganda (67%) and Tanzania (66%). And countries with a limited history of political-party
formation are prone to score low on the proportion of partisans, as is the case in Tunisia (18%)
and Morocco (13%). That said, there is also evidence that some supposedly dominant parties
have a shaky political base (see South Africa at 45%) and that countries with unstable party
systems can nonetheless attract an above-average proportion of adherents (see Malawi at
62% and Kenya at 59%).
For our purposes, however, the main issue is whether political partisanship is connected to
public opinion about elections. As Table 2 shows, popular support for elections is largely
unaffected by the proportions of a country’s population that are partisans of the ruling party,
partisans of an opposition party, or non-partisans. The signs on the correlation coefficients
reveal a slight tendency for partisans (of any political stripe) to be more supportive of
elections than non-partisans, but the link is not statistically significant.
Table 2: Political partisanship and public opinion about elections | 33 countries
| 2016/2018
Partisans of Partisans of
Non-partisans
ruling party opposition parties
Support elections .124 (ns) .111 (ns) -.146 (ns)
See free and fair elections .349 (**) .294 (*) -.402 (**)
Cell entries are Pearson’s correlation coefficients; *significance =for decades, elections hold promise as a method of dismissing incumbents who have
overstayed the electorate’s welcome.
In this paper we define leadership alternation (sometimes also called political turnover) as a
change in ruling party as the result of an election. We distinguish alternation from a change
of leadership within a ruling party as the result, say, of a president’s death in office,
resignation due to ill health, or other trigger to replacement by a co-partisan (such as a vice
president). In short, for alternation to occur, a ruling party must lose an election and its leader
must be replaced by the head of a former opposition party or alliance.
In the national elections conducted in 33 African countries immediately prior to the latest
Afrobarometer survey, 15 resulted in leadership alternation and 18 did not. This unexpectedly
high number of turnovers was due either to successful campaigns mounted by organized
opposition forces against incumbents (see Nigeria 2015 or Ghana 2016) or open-seat
elections at the end of term-limited presidencies (see Benin 2016, Liberia 2017, and Mali
2013).
What role, if any, does alternation of ruling parties play in the formation of public opinion?
According to Table 3, there is no apparent linkage between electoral alternation and
popular support for elections. Regardless of whether elections lead to turnover at the top,
identical proportions of citizens (75%) say they prefer to use elections to install leaders. Thus
we can reconfirm that sometimes elections are effective devices for extending legitimacy to
entrenched leaders.
Table 3: Alternation of ruling parties and public opinion about elections | 33 elections
| 2016/2018
Alternation No alternation t-test* Significance
Support elections 75% 75% -.145 .886
See free and fair elections 71% 56% -2.414 .022
* Equal variances not assumed
Importantly, however, alternation is closely linked to the perceived quality of elections.
Whereas 71% of Africans see free and fair conduct in the wake of an electoral alternation,
just 56% see the same for elections that confirm incumbents in power, a statistically significant
difference. This result suggests that the legitimating effect of elections is greater for installing
new leaders than it is for reconfirming the incumbency of old ones. It also suggests that
citizens recognize that incumbency endows rulers with more resources than their opponents
to manipulate electoral outcomes, thus calling the quality of “no-change” elections into
question.
To summarize, larger majorities of citizens are likely to endorse the quality of competitive
elections when these contests result in political change at the leadership level. In Africa’s
personalized politics, a change of leaders instills popular hope that improvement in
government performance will follow. Alternation also seems to signal that the rules of
electoral competition are sufficiently robust to overcome any untoward incumbency
advantage. Moreover, since we test for alternation events that occur prior to the
measurement of perceived election quality (in a subsequent Afrobarometer survey), we may
infer a causal connection from alternation to public opinion. In short, as illustrated in Figure
11, Africans have most confidence in the integrity of “change” elections.
Copyright ©Afrobarometer 2019 19Figure 11: Perceived quality of election by alternation in last election | 33 countries
| 2016/2018
No Alternation Alternation
Alternation
No alternation
See free and fair elections
Alternation of ruling party (in last election), recoded
Ae free and fair elections
Pulling the argument together
This concluding section proposes a comprehensive account of key factors shaping public
opinion about elections in Africa. Table 4 presents results of three regression analyses 9 that
weigh the influence of institutional, political, and attitudinal factors on election quality and
popular support for elections. In pulling the strands of this paper together, we make a case
that support for elections depends on the perceived quality of elections, which in turn is
driven by leadership alternation. In short, “change elections” foster mass support for
elections.
The perceived quality of elections. As a first step, we review the factors underpinning citizen
views of election quality (or integrity). In Table 4, Model 1 confirms that this attribute is a
function of both institutional and political factors. On the institutional front, the total number
of elections since 1990 is a strong and significant predictor of perceived election quality, a
result that lends credence to the idea that mere repetition of the balloting process is a
source of democratization. But, judging by the size and significance of the relevant
coefficients, political factors are even more important. These include the extent to which the
electorate is partisan (i.e. identifies with political parties) and, especially, whether the
9
In lay terms, regression analysis can be thought of as a statistical method for weighing the relative influence
of several possible “causes” on a particular “effect.” In the ordinary least squares (OLS) version of this test
employed here, the regression produces coefficients with two characteristics: strength, which measures the
degree of association between predictor and target variables, and significance, which indicates the probability
that the observed link is due to chance. A large numerical coefficient (on a scale of 0-1) indicates a strong
association and is usually accompanied by a small likelihood of a chance relationship. Since the reported
coefficients are standardized (sometimes called “beta” coefficients), their magnitudes can be compared as an
indication of relative explanatory power, with each predictor taking the influence of all others into account.
The OLS procedure also produces an estimate of the overall explanatory power of the model (r square), again
on a 0-1 scale.
Copyright ©Afrobarometer 2019 20previous election led to an alternation of top political leaders. Indeed, the most important
influence on whether citizens see a good-quality election is whether the vote precipitates a
turnover of ruling party.
Table 4: Factors shaping public opinion about elections | 33 countries | 2016/2018
Perceived quality Popular support
of elections for elections
Model 1 Model 2 Model 3
Institutional factors
Type of electoral systema .108 (ns) .382 (**) .323 (**)
Total number of elections 1990-2018 .329 (**) -.113 (ns) -.293 (*)
Political factors
Proportion identifying with a party .332 (**) .115 (ns) -.067
Leadership alternation in previous election .410 (***) .088 (ns) -.137
Attitudes toward elections
Perceived quality of elections .547 (***)
Explained variance (r square) .402 .178 .357
Cell entries are standardized OLS regression coefficients (beta); *significance =popular support for elections. It essentially determines whether African citizens extend
political legitimacy to the electoral mode of selecting leaders, and therefore to elected
leaders themselves.
By way of conclusion, we summarize our argument: Support for elections is a function of both
leadership alternation and perceived election quality. A proposed causal path among these
factors is represented graphically in Figure 12.
Figure 12: Proposed causal path to support for elections
Beta = Beta =
Leadership .410*** Perceived election .547*** Popular support
alternation quality for elections
Africans support elections if they judge that these contests have been well conducted. They
judge that these contests have been well conducted if the election leads to a change of
top political leadership. But the relationship between leadership alternation and support for
elections is indirect. In other words, alternation is embedded in popular perceptions of
electoral quality as the strongest possible evidence – a “gold standard,” if you will – for what
constitutes a high-quality election. Simply stated, Africans support elections to the extent that
these contests are seen to bring about desired political change.
Copyright ©Afrobarometer 2019 22You can also read