Aerosol transport pathways and source attribution in China during the COVID-19 outbreak
←
→
Page content transcription
If your browser does not render page correctly, please read the page content below

Atmos. Chem. Phys., 21, 15431–15445, 2021
https://doi.org/10.5194/acp-21-15431-2021
© Author(s) 2021. This work is distributed under
the Creative Commons Attribution 4.0 License.

Aerosol transport pathways and source attribution in China
during the COVID-19 outbreak
Lili Ren1 , Yang Yang1 , Hailong Wang2 , Pinya Wang1 , Lei Chen1 , Jia Zhu1 , and Hong Liao1
1 JiangsuKey Laboratory of Atmospheric Environment Monitoring and Pollution Control, Jiangsu Collaborative
Innovation Center of Atmospheric Environment and Equipment Technology, School of Environmental Science
and Engineering, Nanjing University of Information Science and Technology, Nanjing, Jiangsu, China
2 Atmospheric Sciences and Global Change Division, Pacific Northwest National Laboratory, Richland, Washington, USA

Correspondence: Yang Yang (yang.yang@nuist.edu.cn)

Received: 16 April 2021 – Discussion started: 3 May 2021
Revised: 3 August 2021 – Accepted: 26 September 2021 – Published: 15 October 2021

Abstract. Due to the coronavirus disease 2019 (COVID-19)          gional air quality and need to be taken into account in clean-
pandemic, human activities and industrial productions were        air plans.
strictly restricted during January–March 2020 in China. De-
spite the fact that anthropogenic aerosol emissions largely
decreased, haze events still occurred. Characterization of
aerosol transport pathways and attribution of aerosol sources     1   Introduction
from specific regions are beneficial to air quality and pan-
demic control strategies. This study establishes source–          The coronavirus disease 2019 (COVID-19) has spread
receptor relationships in various regions covering all of         worldwide since December 2019 and resulted in more than a
China during the COVID-19 outbreak based on the Com-              million cases within the first 4 months (Sharma et al., 2020;
munity Atmosphere Model version 5 with Explicit Aerosol           Dong et al., 2020). In order to curb the virus’s spread among
Source Tagging (CAM5-EAST). Our analysis shows that               humans, measures were taken by the Chinese government
PM2.5 burden over the North China Plain between 30 Jan-           on 23 January 2020 to minimize the interaction among peo-
uary and 19 February is mostly contributed by local emis-         ple, including strict isolation, prohibition of large-scale pri-
sions (40 %–66 %). For other regions in China, PM2.5 bur-         vate and public gatherings, restriction of private and pub-
den is largely contributed from nonlocal sources. During the      lic transportation, and even lockdown of cities (Tian et al.,
most polluted days of the COVID-19 outbreak, local emis-          2020; Wang et al., 2020). The estimated NOx emissions in
sions within the North China Plain and eastern China con-         eastern China were reduced by 60 %–70 %, of which 70 %–
tributed 66 % and 87 % to the increase in surface PM2.5 con-      80 % were related to the reduced road traffic and 20 %–25 %
centrations, respectively. This is associated with the anoma-     from industrial enterprises shutdown during the COVID-19
lous mid-tropospheric high pressure at the location of the cli-   lockdown period. However, severe air pollution events still
matological East Asia trough and the consequently weakened        occurred in eastern China during the COVID-19 lockdown,
winds in the lower troposphere, leading to the local aerosol      even though the anthropogenic emissions were greatly re-
accumulation. The emissions outside China, especially those       duced (Huang et al., 2020). The unprecedented large-scale
from South Asia and Southeast Asia, contribute over 50 % to       restrictions resulting from the COVID-19 epidemic provide
the increase in PM2.5 concentration in southwestern China         an opportunity to research the relationship between dramatic
through transboundary transport during the most polluted          anthropogenic emission reductions and air quality changes
day. As the reduction in emissions in the near future is de-      (e.g., Bao et al., 2020; Li et al., 2020; Wang et al., 2020).
sirable, aerosols from long-range transport and unfavorable       Bao et al. (2020) reported that during the COVID-19 lock-
meteorological conditions are increasingly important to re-       down period the air quality index and the PM2.5 (particulate
                                                                  matter less than 2.5 µm in diameter) concentration were de-

Published by Copernicus Publications on behalf of the European Geosciences Union.
15432                                                                                L. Ren et al.: Aerosol transport pathways

creased by 7.8 % and 5.9 % on average, respectively, in 44          transport pathways and source attribution covering all of
cities in northern China, mainly due to travel restrictions.        China during the COVID-19 pandemic. In this study, the
By applying the WRF-CAMx model together with air qual-              global aerosol–climate model CAM5 (Community Atmo-
ity monitoring data, Li et al. (2020) revealed that although        sphere Model, version 5) equipped with explicit aerosol
primary particle emissions were reduced by 15 %–61 % dur-           source tagging (CAM5-EAST) is employed to quantify
ing the COVID-19 lockdown over the Yangtze River Delta              source–receptor relationships and transport pathways of
region, the daily mean concentration of PM2.5 was still rel-        aerosols during the COVID-19 outbreak in China. We also
atively high, reaching up to 79 µg m−3 . Wang et al. (2020)         provide model evaluations of PM2.5 concentrations against
found that the relative reduction in PM2.5 precursors was           observations made during the COVID-19 outbreak. With the
twice as much as the reduction in PM2.5 concentration, in           aerosol source tagging technique, source region contributions
part due to the unfavorable meteorological conditions during        to PM2.5 column burden over various receptor regions and
the COVID-19 outbreak in China that led to the formation            transport pathways in China are analyzed. The source con-
of the heavy haze. Huang et al. (2020) and Le et al. (2020)         tributions to the changes in near-surface PM2.5 in the most
reported that stagnant air conditions, high atmospheric hu-         polluted days compared to the monthly means during Febru-
midity and enhanced atmospheric oxidizing capacity led to           ary 2020 are also quantified. Our study provides source ap-
a severe haze event in northern China during the COVID-19           portionment of aerosols covering all of China and quantifies
pandemic.                                                           the contribution from foreign transport for the first time in
   Aerosols are main air pollutants that play important roles       the case of COVID-19 emission reductions, which is benefi-
in the atmosphere due to their adverse effects on air quality,      cial to the investigation of policy implications for future air
visibility (Vautard et al., 2009; Watson, 2002), human health       pollution control.
(Lelieveld et al., 2019; Heft-Neal et al., 2018), the Earth’s en-
ergy balance, and regional and global climate (Ramanathan
et al., 2001; Anderson et al., 2003; Yang et al., 2019a; Wang       2     Methods
et al., 2020; Smith et al., 2020). With its rapid development
in recent decades, China has experienced severe air pollu-          2.1    Model description and experimental setup
tion that damages human health and causes regional climate
change (Chai et al., 2014; Liao et al., 2015; Fan et al., 2020).    The CAM5 model is applied to estimate the PM2.5 changes
In order to control air pollution, the Chinese government is-       during the COVID-19 period, which is the atmospheric com-
sued and implemented the Air Pollution Prevention and Con-          ponent of the Earth system model CESM (Community Earth
trol Action Plan in 2013 (China State Council, 2013). Al-           System Model, Hurrell et al., 2013). In this study, ma-
though emissions in China have decreased significantly in           jor aerosol species including sulfate, BC, primary organic
recent years (Zheng et al., 2018), aerosols transported from        matter (POM), secondary organic aerosol (SOA), sea salt
other source regions could add on top of local emissions            and mineral dust, are represented by three lognormal size
(Yang et al., 2017a, 2018a; Ren et al., 2020). Therefore, it        modes (i.e., Aitken, accumulation and coarse modes) of the
is important to understand the relative effects of local emis-      modal aerosol module (MAM3) (Liu et al., 2012). The de-
sions and regional transport on aerosols in China.                  tailed aerosol representation in CAM5 was provided in Liu
   Source tagging and apportionment is an effective way to          et al. (2012) and Wang et al. (2013). The aerosol mixing
establish aerosol source–receptor relationships, which is con-      states consider both internal (within a same mode) and exter-
ducive to both scientific research and emission control strate-     nal mixing (between modes). On top of the default CAM5,
gies (Yu et al., 2012). By applying particulate source appor-       additional modifications that improve the representation of
tionment technology in the CAMx model, Xue et al. (2014)            aerosol wet scavenging and convective transport (Wang et
found that the contributions of regional transport to annual        al., 2013) are also included in the model version used for this
average PM2.5 concentrations in Hainan, Shanghai, Jiangsu,          study.
Zhejiang, Jilin and Jiangxi provinces of China are more than           In this study, simulations were conducted with a hori-
45 %. By adding a chemical tracer into the WRF model,               zontal resolution of 1.9◦ × 2.5◦ and 30 vertical layers up to
Wang et al. (2016) studied the sources of black carbon              3.6 hPa in the year 2020. The anthropogenic emissions used
(BC) aerosol in Beijing and reported that about half of BC          in the baseline simulation are derived from the MEIC (Multi-
in Beijing came from the central North China Plain. Liu             resolution Emission Inventory of China) inventory (Zheng et
et al. (2017) applied the WRF-Chem model and showed                 al., 2018), referred to here as the baseline experiment, while
that Foshan, Guangzhou and Dongguan, with relatively high           emissions for the other countries use the SSP (Shared So-
emissions, contributed 14 %, 13 % and 10 %, respectively,           cioeconomic Pathways) 2–4.5 scenario data set under CMIP6
to the regional mean PM2.5 concentration in the Pearl River         (the Coupled Model Intercomparison Project Phase 6). Emis-
Delta.                                                              sions in year 2017 are used as the baseline during the simu-
   Previous studies only focused on regional transport of           lation period considering the time limit of MEIC inventory.
aerosols, and very few studies have explored the aerosol            To better estimate the impact of restricted human activities

Atmos. Chem. Phys., 21, 15431–15445, 2021                                           https://doi.org/10.5194/acp-21-15431-2021

L. Ren et al.: Aerosol transport pathways                                                                                     15433

on emission reductions owing to the COVID-19 lockdown
(referred to as the Covid experiment), we updated China’s
emission inventory from January to March 2020 based on
the provincial total emission reduction ratio in Huang et
al. (2020). Emissions from the transportation sector are de-
creased by 70 %. The remaining emission reduction, by ex-
cluding transport reduction from the total emission reduc-
tion, are evenly distributed to other sectors, including in-
dustry, power plants, residential, international shipping and
waste treatment from January to March 2020 compared to
the baseline emission in 2017. Unless otherwise specified,
all the results in this study are derived from the Covid exper-
iment.
   The sea surface temperature, sea ice concentrations, so-
lar radiation and greenhouse gas concentrations are fixed at
present-day climatological levels. To capture the large-scale
atmospheric circulations during COVID-19, we nudge the
model wind fields toward the MERRA-2 (Modern-Era Ret-
rospective Analysis for Research and Applications, version
2) reanalysis (Gelaro et al., 2017) from April 2019 to March
2020 repeatedly for 6 years. Only model results from the last
year are used to represent year 2020, with the first 5 years as
model spin-up. In this study, we analyze the transport path-
ways and source attribution of aerosols during the 3 weeks
that had the largest number of newly diagnosed COVID-19
cases (Fig. S1 in the Supplement, hereafter referred to as
“week 1”, 30 January–5 February; “week 2”, 6 February–12
February, and “week 3”, 13 February–19 February), when
unexpected hazardous air pollution events also occurred dur-      Figure 1. (a) Tagged source regions (NEC: northeastern China;
ing this time period (Huang et al., 2020; Le et al., 2020).       NCP: North China Plain; ESC: eastern China; STC: southern China;
                                                                  CWC: central western China; SWC: southwestern China; NWC:
2.2   Explicit aerosol source tagging and source regions          northwestern China; HTP: Himalayas and Tibetan Plateau; ROW:
                                                                  rest of the world) and (b) mean wind field (units: m s−1 , vectors)
                                                                  at 850 hPa during the 3 weeks of the study from 30 January to
To examine the source apportionment of aerosols in China,         19 February, which had the largest number of newly diagnosed
the Explicit Aerosol Source Tagging (EAST) technique was          COVID-19 cases. Lines in (a) mark the cross sections (CS) defined
implemented in CAM5, which has been utilized in many              to study the transport of aerosols to and from China.
aerosol source attribution studies (e.g., Wang et al., 2014;
Yang et al., 2017a, b, 2018a, b, c, 2019b, 2020; Ren et al.,
2020). Different from the emission sensitivity method that        (ESC), southern China (STC), central western China (CWC),
assumes a linear response to emission perturbation and the        southwestern China (SWC), northwestern China (NWC), the
traditional backward trajectory method, aerosols from each        Himalayas and Tibetan Plateau (HTP), and the rest of the
tagged region or sector are calculated independently in EAST      world (ROW), are tagged separately.
within one single simulation. Without relying on a set of
model simulations with emission perturbations or assuming
constant decaying rate, EAST is more accurate and time sav-       3   Model evaluation
ing than the source apportionment method mentioned above.
In addition to the sulfate, BC and POM species that were          Many previous studies have assessed the spatial distribution
tagged in previous studies (e.g., Yang et al., 2020), SOA and     and seasonal to decadal variations in aerosol concentrations
precursor gas are now also tagged in the EAST. These types        in China and worldwide simulated by CAM5 with the obser-
of aerosols from independent source regions and sectors can       vations (e.g., Wang et al., 2013; Yang et al., 2017a, b, 2018b,
be explicitly tagged and tracked simultaneously. In this study,   c, 2020). In order to evaluate the model’s performance when
focusing on the aerosols in China during the COVID-19 out-        simulating aerosols during the COVID-19 outbreak period
break period, the domestic aerosol and precursor emissions        in China, the surface concentrations of PM2.5 , estimated as
from eight geographical source regions (Fig. 1), northeastern     the sum of sulfate, BC, POM and SOA for model results,
China (NEC), the North China Plain (NCP), eastern China           during the analyzed time periods are compared with mea-

https://doi.org/10.5194/acp-21-15431-2021                                        Atmos. Chem. Phys., 21, 15431–15445, 2021
15434                                                                               L. Ren et al.: Aerosol transport pathways

surements from the China National Environmental Monitor-           characteristics of aerosol species. Aerosols from northeast-
ing Center (CNEMC), as shown in Fig. 2a. The model rea-            ern China are transported southeastward by the northwesterly
sonably reproduces the overall spatial distribution of near-       winds (Fig. 1b). From the North China Plain, aerosols can be
surface PM2.5 concentrations during the three time periods,        transported either southward reaching eastern, southern and
with high values over the North China Plain and low val-           southwestern China during week 1 or across eastern coast
ues in western China. However, as reported in many CAM5            of China to the oceanic region during weeks 2–3. Aerosols
model studies (e.g., Yang et al., 2017a, b), the model under-      originating from eastern China move straight to southwest-
estimates the PM2.5 concentrations with normalized mean            ern and southern China during weeks 1–2, while they also
biases (NMBs) of −55 % ∼ −49 % compared to the avail-              entered the North China Plain during weeks 2–3. Aerosols
able site observations (Fig. S2). The discrepancies are re-        emitted from southern China and central western China have
lated to coarse-resolution model sampling bias relative to the     no obvious transport due to their relatively weak emissions.
observational sites, uncertainties in aerosol emissions, wet       In addition to the local impact, emissions from southwest-
removal and gas–particle exchange. In addition, the model          ern China mostly affect southern China and eastern China.
version used in this study is not able to simulate nitrate and     Air parcels with high levels of PM2.5 from South Asia and
ammonium aerosols, which are also the main components of           Southeast Asia moved into southwestern, southern, and east-
PM2.5 (Kong et al., 2020; Xu et al., 2019).                        ern China and even the North China Plain during the three
   The long-distance transport of aerosols mainly occurs in        time periods.
the upper troposphere rather than near the surface (Hadley et         The vertical distributions of PM2.5 emitted from the six
al., 2007; Zhang et al., 2015). Aerosols are lifted from the at-   major tagged source regions are shown in Figs. S3 and
mospheric boundary layer of the emission source regions to         S4. PM2.5 has much higher concentrations in the lower
the free troposphere and then undergo the transboundary and        troposphere and decreases with increasing height. During
intercontinental transport effectively driven by the upper tro-    weeks 1–2, owing to the presence of high PM2.5 loadings,
pospheric circulations. Therefore, it is helpful to analyze the    a stronger vertical mixing and transport brought more PM2.5
relative contributions of local and nonlocal sources by focus-     to the upper troposphere compared to that during Week 3.
ing on the column burden of aerosols. Figure 2b presents spa-      High concentrations of PM2.5 originating from the North
tial distributions of simulated mean column burden of PM2.5        China Plain extended southeastward by strong northwesterly
during the three time periods (week 1, 30 January–5 Febru-         winds. Weak winds over eastern China led to accumulations
ary; week 2, 6–12 February; and week 3, 13–19 February)            of PM2.5 within this region, which is consistent with the find-
that had the largest number of newly diagnosed COVID-19            ings in Yang et al. (2017a). Strong southwesterly winds in
cases. The contrast in column burden does not differ signif-       the south of southwestern China and weak winds in the north
icantly from that of near-surface concentrations. Compared         of this region produced convergences and updrafts that lifted
to week 3, week 1 and week 2 have higher PM2.5 loading,            aerosols up to 700 hPa.
with values in the range of 20–40 and 20–30 mg m−2 , re-              Considering that emissions outside China contribute
spectively, over the North China Plain and in eastern China        greatly to PM2.5 concentrations in southwestern China
and southern China, while the PM2.5 loading in week 3 is           through transboundary transport (Yang et al., 2017a) and that
relatively low compared to week 1 and week 2, with values          aerosols from East Asia can be transported to the North Pa-
mostly ranging from 10 to 20 mg m−2 . Note that the column         cific and even North America (Yu et al., 2008; Yang et al.,
burden of PM2.5 in South Asia and Southeast Asia is higher         2018c), it is of great importance to study the inflow and out-
than 20 mg m−2 in the three time periods and reaches up to         flow of PM2.5 across the boundaries of China. Figures 4 and
50 mg m−2 in week 2, which potentially influences aerosol          5 show the vertical distribution of PM2.5 concentrations re-
concentrations in China through transboundary transport.           sulting from emissions within and outside China over 29◦ N,
                                                                   88◦ E and 21◦ N around the south boundaries (cross sections
                                                                   (CSs) 1–3 in Fig. 1a) and 123◦ N around the east bound-
4   Transport pathways                                             ary (CS 4 in Fig. 1a) of mainland China. Over the southern
                                                                   border, PM2.5 concentrations are more influenced by trans-
The explicit aerosol tagging technique can clearly identify        boundary transport of aerosols from the ROW than those
the transport pathways of aerosols moving from their source        originating from domestic emissions. The high concentra-
regions to their destination. Figure 3 shows the spatial dis-      tions of PM2.5 from South Asia and Southeast Asia are lifted
tribution of mean column burden of simulated PM2.5 origi-          into the free atmosphere of the Tibetan Plateau and Yunnan-
nating from the six tagged source regions in central and east-     Guizhou Plateau and then transported to southern and south-
ern China and outside of China during the three time peri-         western China by southwesterly winds. Over the North China
ods. Aerosols and/or precursor gases emitted from the vari-        Plain and eastern China, northwesterly winds at 35–45◦ N
ous regions follow quite different transport pathways deter-       and southwesterly winds at 25–35◦ N cause aerosols to ac-
mined by their source locations, meteorological conditions,        cumulate in the lower atmosphere and then export across the
emission injection height, and the physical and chemical           eastern border of China below 700 hPa.

Atmos. Chem. Phys., 21, 15431–15445, 2021                                          https://doi.org/10.5194/acp-21-15431-2021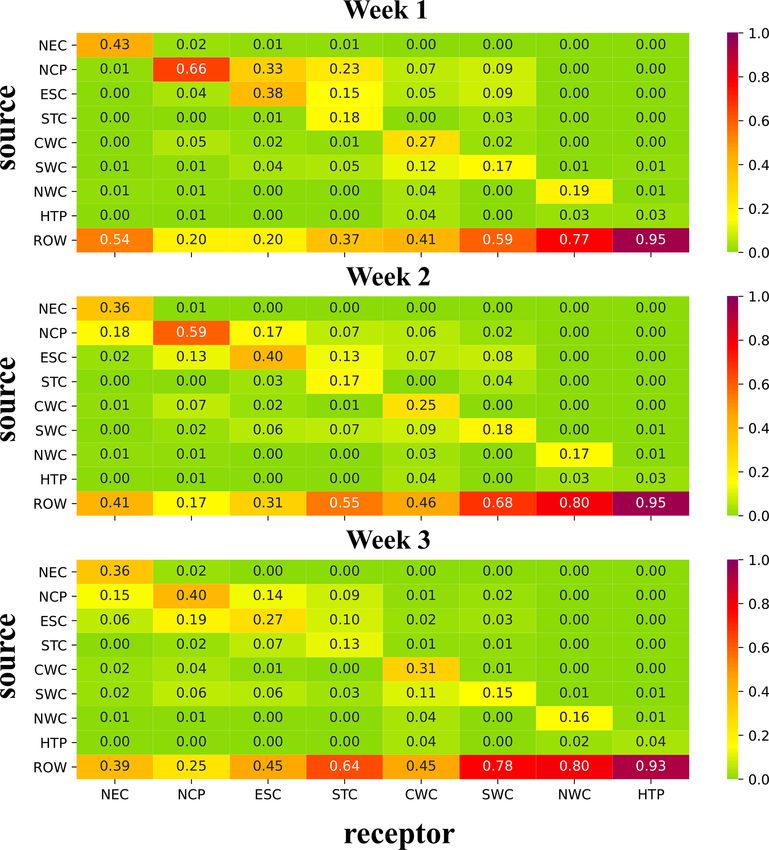
L. Ren et al.: Aerosol transport pathways                                                                                      15435

Figure 2. Spatial distribution of (a) the simulated and observed mean near-surface PM2.5 concentrations (µg m−3 ) and (b) PM2.5 column
burden (mg m−2 ) during 30 January–5 February (week 1), 6–12 February (week 2) and 13–19 February (week 3).

5     Source apportionment of PM2.5 in China during the              ROW during the three time periods. The impacts of nonlo-
      COVID-19 outbreak                                              cal sources within China on PM2.5 burden are relatively low
                                                                     in northeastern China during week 1, with a contribution of
5.1    Source contributions to PM2.5 burden                          less than 5 %, while RCN is responsible for 23 % and 25 %
                                                                     during week 2 and week 3, respectively.
Figure 6 shows the simulated relative contributions in per-             Over the North China Plain, the majority of the PM2.5 bur-
centage to PM2.5 column burden from local-source emis-               den is attributed to local emissions in all cases, with local
sions, regional transport from the untagged regions of China         contributions ranging from 40 % to 66 %. Emissions from
(rest of China, RCN) and rest of the world (ROW). Over               the North China Plain also produce a widespread impact on
the North China Plain, where emissions are relatively high,          PM2.5 over neighboring regions. The sources from the North
PM2.5 column burden is dominated by local emissions dur-             China Plain account for 14 %–33 % of the PM2.5 burden in
ing the three time periods. In contrast, regions with relative       eastern China and 7 %–23% in southern China during the
low emissions are mainly affected by nonlocal sources, es-           three time periods.
pecially by foreign contributions. Emissions from the ROW               In eastern China, local emissions account for 27 %–40 %
contribute a large amount to PM2.5 burden over northeast-            of PM2.5 column burden, while the ROW contributes 20 %–
ern, southern, central western, southwestern, and northwest-         45 %. Southern China and central western China have 13 %–
ern China and the Tibetan Plateau. PM2.5 burden in eastern           18 % and 25 %–31 % of local-source contributions, respec-
China is greatly contributed by the sources from RCN, espe-          tively, whereas 37 %–64 % are due to emissions from outside
cially in Week 1 when regional transport of PM2.5 from the           China in these two regions. In southwestern China, 15 %–
North China Plain is relatively strong (Fig. S4).                    18 % of the PM2.5 burden originates from local emissions
   Table 1 summarizes the contributions of tagged source re-         and 7 %–24 % is from RCN. ROW emissions play important
gions to the PM2.5 burden over different receptor regions            roles in affecting PM2.5 burden over this region, with relative
in China. In northeastern China, 36 %–43 % of the PM2.5              contributions in a range of 59 %–78 % during the three time
column burden comes from local emissions, while a larger             periods, which is associated with the transboundary transport
portion (39 %–54 %) is contributed by emissions from the

https://doi.org/10.5194/acp-21-15431-2021                                           Atmos. Chem. Phys., 21, 15431–15445, 2021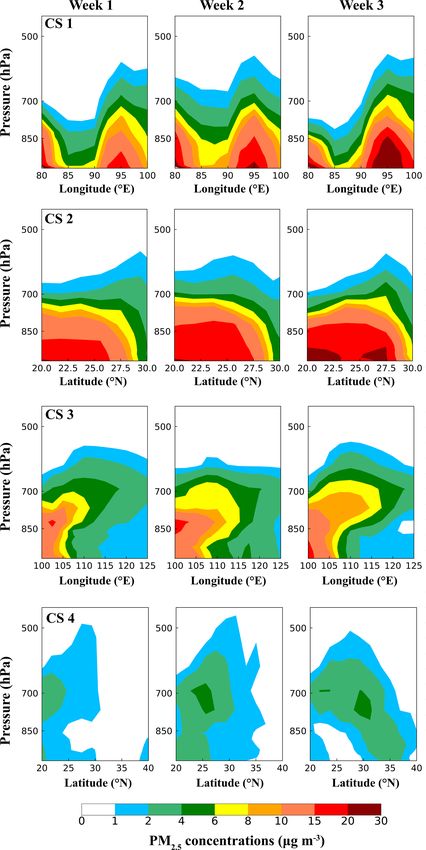
15436                                                                                  L. Ren et al.: Aerosol transport pathways

Figure 3. Spatial distribution of PM2.5 column burden (mg m−2 ) originating from the six major source regions in China (NEC, NCP, ESC,
STC, CWC and SWC) and sources outside China (ROW) during the three time periods.

Atmos. Chem. Phys., 21, 15431–15445, 2021                                             https://doi.org/10.5194/acp-21-15431-2021

L. Ren et al.: Aerosol transport pathways                                                                                          15437

Figure 4. Vertical distributions of PM2.5 concentrations (µg m−3 ) originating from emissions outside China (i.e., ROW sources) across the
latitudinal and/or longitudinal extents marked in Fig. 1, respectively, during the three time periods.

https://doi.org/10.5194/acp-21-15431-2021                                             Atmos. Chem. Phys., 21, 15431–15445, 2021

15438                                                                                      L. Ren et al.: Aerosol transport pathways

Figure 5. Vertical distributions of PM2.5 concentrations (µg m−3 ) originating from domestic emissions in China across the latitudinal and/or
longitudinal extents marked in Fig. 1, respectively, during the three time periods. The values along CS 1 and CS 2 are negligibly small.

by southwesterly winds. PM2.5 burden over northwestern                   tor region. The local- and nonlocal-source contributions to
China and the Himalayas and Tibetan Plateau, where there                 the PM2.5 differences are summarized in Fig. 8.
are relatively low local emissions, is strongly influenced by               Unexpectedly, near-surface PM2.5 concentrations over the
nonlocal sources, and more than 70 % of the PM2.5 burden                 North China Plain and in eastern China experienced remark-
originates from emissions outside China.                                 able increases during the most polluted day of COVID-19
                                                                         lockdown. The simulated PM2.5 concentrations increased,
5.2   Aerosol source attribution during polluted days                    with the largest increases being a more than 20 µg m−3 over
                                                                         the North China Plain and in eastern China; a 10 µg m−3
In spite of the large reductions in emissions, severe air pol-           maximum increase in southwestern China; and a 5 µg m−3
lution events still occurred in China during the COVID-19                increase in northeastern, southern, and central western China
lockdown. Source attribution of PM2.5 during polluted days               during the most polluted days compared to the normal days.
in China has policy implications for future air pollution con-              The increase in near-surface PM2.5 concentrations during
trol. In Beijing, the capital of China, located on the North             the most polluted day over northeastern China is largely in-
China Plain, a serious haze event happened from 11 to 13                 fluenced by the local emissions, which contribute to a re-
February 2020 during the COVID-19 outbreak period ac-                    gional averaged concentration increase of 1.1 µg m−3 . This
cording to observations released by CNEMC. CAM5-EAST                     is mainly due to the accumulation of local aerosols under the
reproduced the polluted day on 11 February over the North                weakened prevailing northwesterly winds over this region.
China Plain. In this study, the most polluted day is defined as             When the PM2.5 pollution occurred over the North China
the day with the highest daily PM2.5 concentration in Febru-             Plain on 11 February 2020, which was also reported as the
ary 2020 for each receptor region in China. Figure 7 presents            polluted day in observations (Huang et al., 2020), the con-
the composite differences in near-surface PM2.5 concentra-               centration of PM2.5 was 16.1 µg m−3 higher than that of nor-
tions and 850 hPa wind fields between the most polluted day              mal days. The contribution from local emissions accounts
and normal days (all days in February 2020) for each recep-

Atmos. Chem. Phys., 21, 15431–15445, 2021                                                 https://doi.org/10.5194/acp-21-15431-2021
L. Ren et al.: Aerosol transport pathways 15439 Figure 6. Relative contributions (%) of (a) local emissions, (b) the emissions from the rest of China (RCN) and (c) all sources outside China (rest of the world, ROW) to PM2.5 column burden during the three time periods. for 66 % of the averaged increase, which was related to southerly winds brought more aerosols from southern China the stagnant air condition (i.e., weakened lower tropospheric and the ROW into eastern China, contributing to 4 % and winds) resulting from the anomalous mid-tropospheric high- 10 % aerosol increase, respectively. pressure system located at the climatological location of the Owing to the enhanced northerly winds during the most East Asia trough (Fig. S5). Sources from eastern China also polluted days, emissions from the North China Plain and explain 4.3 µg m−3 (27 %) of the total increase over the North eastern China contribute 33 % and 39 % of the increase in China Plain. PM2.5 concentration over Southern China, respectively. The During the most polluted day in eastern China (the same most polluted day in central western China is mostly caused day as the most polluted day over North China Plain), the by local emissions (65 % of the total increase). concentration of PM2.5 was 16 µg m−3 higher than that of When southwestern China was under polluted conditions, normal days, which is primarily contributed by the local PM2.5 concentration increased by 2.1 µg m−3 . Emissions emissions. While the contribution from the North China from the ROW, especially those from South Asia and South- Plain decreased on the most polluted day, the anomalous east Asia, are of great significance to the increase in PM2.5 https://doi.org/10.5194/acp-21-15431-2021 Atmos. Chem. Phys., 21, 15431–15445, 2021
15440                                                                                     L. Ren et al.: Aerosol transport pathways

Table 1. Fractional contributions of emissions from nine tagged source regions (vertical axis) to mean PM2.5 column burden in eight receptor
regions (horizontal axis) during the three time periods (week 1, 30 January–5 February; week 2, 6–12 February; and week 3, 13–19 February).

concentrations due to the enhanced southwesterly winds over             pandemic. We pay attention to not only local emissions but
this region. The relative contribution from ROW emissions               also to the impacts from regional and foreign transport of
is more than 50 % over southwestern China during the most               aerosols. An explicit aerosol source tagging is implemented
polluted day. This highlights that the important role of trans-         in the Community Atmosphere Model version 5 (CAM5-
boundary transport needs to be considered when controlling              EAST) to examine the aerosol transport pathways and source
local emissions to improve air quality in the near future.              attribution of PM2.5 in China during the first few weeks of
                                                                        the COVID-19 outbreak (week 1, 30 January–5 February;
                                                                        week 2, 6–12 February; and week 3, 13–19 February). The
6   Conclusion and discussions                                          contributions of emissions to PM2.5 originating from eight
                                                                        source regions in mainland China, i.e., northeastern China,
The COVID-19 pandemic disrupted human activities and led                the North China Plain, eastern China, southern China, cen-
to abrupt reductions in anthropogenic emissions. This study             tral western China, southwestern China, northwestern China,
first investigated the source contributions to PM2.5 over var-          and the Himalayas and Tibetan Plateau, and sources outside
ious regions covering all of China during the COVID-19

Atmos. Chem. Phys., 21, 15431–15445, 2021                                                 https://doi.org/10.5194/acp-21-15431-2021
L. Ren et al.: Aerosol transport pathways 15441
Figure 7. Composite differences in winds at 850 hPa (m s−1 ) and near-surface PM2.5 concentrations (µm−3 ) between the most polluted and
normal days in February 2020. The most polluted day is defined as the day with the highest daily PM2.5 concentration in February 2020 in
each receptor region in China.
Across the southern boundary of mainland China, high
concentrations of PM2.5 from South Asia and Southeast Asia
are lifted into the free atmosphere and then transported to
southern and southwestern China. In addition, PM2.5 from
the North China Plain and eastern China can also be brought
out of China via westerly winds, mostly below 700 hPa.
PM2.5 in China is affected by not only local emissions but
also long-range transport of pollutants from distant source re-
gions. Over the North China Plain, 40 %–66 % of the PM2.5
burden is attributed to local emissions during the COVID-19
outbreak. They also impact PM2.5 in neighboring regions, ac-
counting for 14 %–33 % of the PM2.5 burden in eastern China
and 7 %–23 % in southern China during the three time peri-
ods. Northeastern China has 36 %–43 % local-source contri-
butions to its PM2.5 column burden, while 39 %–54 % is con-
Figure 8. Composite differences in near-surface PM2.5 concentra- tributed by emissions from the ROW during the three time
tions (µm−3 ) averaged over receptor regions (marked on the hori-
periods. In eastern China, local emissions explain 27 %–40 %
zontal axis) in China between the most polluted and normal days
of the PM2.5 burden, while the ROW contributes 20 %–45 %.
in February 2020 originating from individual source regions (corre-
sponding color bars in each column). In southwestern China, 59 %–78 % of the PM2.5 burden is
contributed by emissions from the ROW. Over northwestern
China and the Himalayas and Tibetan Plateau, ROW emis-
China (ROW) to near-surface concentrations, column bur- sions have a great contribution of more than 70 % to the
dens, transport pathways of PM2.5 and haze formation in dif- PM2.5 column burden.
ferent receptor regions in China are quantified in this study. In this study, the most polluted day is defined as the day
Aerosols emitted from the North China Plain, where the air with the highest daily PM2.5 concentration in February 2020
quality is often poor, was transported through eastern China for each receptor region in China. The transport from out-
and reach southwestern China during the three time peri- side of China only has a great impact on some specific re-
ods. Similarly, aerosols from eastern China moved straight gions in China. In southwestern China, the relative contribu-
to southern China and Southwestern China during week 1 tion from ROW emissions, especially those from South Asia
and week 2, and a significant portion also entered the North and Southeast Asia, to the increment of PM2.5 concentration
China Plain during week 2 and week 3. during the most polluted days compared with normal days is
https://doi.org/10.5194/acp-21-15431-2021 Atmos. Chem. Phys., 21, 15431–15445, 202115442 L. Ren et al.: Aerosol transport pathways more than 50 %. It is consistent with previous studies where lution (Le et al., 2020; Sulaymon et al., 2021; Shen et al., emissions from South Asia and Southeast Asia have an im- 2021). Through model simulations, Le et al. (2020) found portant impact on air quality in southwestern China (Yang that abnormally high humidity promotes the heterogeneous et al., 2017a; Zhu et al., 2016, 2017). For other receptor re- chemistry of aerosols, which contributed to the increase in gions in China (northeastern China, the North China Plain, PM2.5 by 12 % in northern China during the city lockdown eastern China, southern China and central western China), period. Sulaymon et al. (2021) found a significant increase PM2.5 concentrations are largely contributed by local emis- in PM2.5 concentrations caused by unfavorable meteorolog- sions during the most polluted days compared with normal ical conditions in the Beijing–Tianjin–Hebei region during days. In the future with emissions reductions for better air the lockdown period based on Community Multiscale Air quality in China, decreasing air pollution should consider Quality (CMAQ) model simulations. By analyzing the ob- aerosols from both Chinese local emissions and pollutant servational data and model simulations, Shen et al. (2021) re- transport from outside of China. ported that 50 % of the pollution episodes during the COVID- Despite the large reductions in emissions, near-surface 19 lockdown in Hubei were due to the stagnant meteorolog- PM2.5 concentrations over the North China Plain and in east- ical conditions. Huang et al. (2020) found that the stagnant ern China increased a lot during the most polluted days of air conditions and enhanced atmospheric oxidizing capacity the COVID-19 lockdown (with the highest daily PM2.5 con- caused a severe haze event during the same time period. In centration in February 2020), with the largest increases of line with previous studies, we also revealed the stagnant air more than 20 µg m−3 . In addition to local emissions, regional conditions under the anomalous high-pressure system during transport of pollutants is also an important factor that causes the most polluted day over the North China Plain. In addition haze events in China. The increases in PM2.5 concentrations to the meteorological conditions, the effect of foreign trans- during the most polluted days over the North China Plain port was also raised in this study as causing aerosol pollution and eastern China are largely influenced by the stagnant air in southwestern China during COVID-19 outbreak. conditions resulting from the anomalous high-pressure sys- There are a few uncertainties in this study. The CAM5 tem and weakening of winds, which led to reduced ventila- model has low biases when reproducing the near-surface tion and aerosol accumulation over the North China Plain, to- PM2.5 concentrations in China compared to observations, in gether with an increase in aerosol inflow from regional trans- part due to its incapability of simulating some aerosol com- port. During the most polluted day in southwestern China, ponents of PM2.5 (e.g., ammonium and nitrate), excessive ROW contributed over 50 % of the PM2.5 concentration in- aerosol wet removal during long-range transport (Wang et crease, with enhanced southwesterly winds that drive pollu- al., 2013) and uncertainties in observations. In the majority tion transport from South Asia and Southeast Asia. This in- of the climate models, the simulation of nitrate and ammo- dicates that regional transport and unfavorable meteorology nium aerosols is not included in the aerosol schemes, partly need to be taken into consideration when controlling local due to the complexity of calculation efficiency. For exam- emissions to improve air quality in the near future. ple, of the many CMIP6 models, only two of them provide To highlight the roles of regional and foreign transport, nitrate and ammonium mass mixing ratios. Many previous the differences between the Covid and baseline simulations studies have evaluated the global climate model performance in relative contributions to PM2.5 burden from local, regional in reproducing aerosol concentrations (e.g., Fan et al., 2018; (RCN) and foreign (ROW) emissions are given in Fig. S6. Shindell et al., 2013; Yang et al., 2017a, b). In general, the During the COVID-19 period, the local and RCN emission models can simulate aerosols in North America and Europe contributions to PM2.5 were 1 %–4 % lower than those in well but significantly underestimate aerosols in East Asia by baseline experiment over the North China Plain and north- about −36 % to −58 % compared with observations. This eastern China. In eastern China, the contribution from the can lead to an underestimation of aerosols contributed by local emissions decreased by 3 %–4 % compared with the Chinese local emissions in magnitudes but might not change baseline experiment, while the contribution from the ROW the main conclusions of this study. Uncertainties in the esti- increased by more than 5 %. In southern China, 50 %–70% mate of emission reductions in different source regions dur- of the PM2.5 burden is contributed by emissions from the ing the COVID-19 pandemic can also introduce uncertain- ROW in the baseline experiment. During the COVID-19 pe- ties to our results. During the COVID-19 lockdown, green- riod with low emission levels, the contribution from ROW to house gas emissions also decreased (Le Quéré et al., 2020), PM2.5 burden in southern China had an increase of more than but the effect of greenhouse gas reduction on meteorology 5 %. This indicates that the important role of transboundary that potentially influences aerosol distributions was not taken transport needs to be considered when controlling local emis- into consideration. Nevertheless, this study is the first attempt sions to improve air quality in the near future. to provide source apportionment of aerosols covering all of Many studies have examined the importance of meteorol- China during the COVID-19 outbreak, which is beneficial to ogy in regional air quality during the COVID-19 lockdown the investigation of policy implications for future air pollu- period and emphasized that when meteorology is unfavor- tion control. able, abrupt emissions reductions cannot avoid severe air pol- Atmos. Chem. Phys., 21, 15431–15445, 2021 https://doi.org/10.5194/acp-21-15431-2021
L. Ren et al.: Aerosol transport pathways                                                                                            15443

Code and data availability. The CAM5 model is available at            China State Council: Action Plan on Prevention and Con-
http://www.cesm.ucar.edu/models/cesm1.2/ (UCAR, 2021). The              trol of Air Pollution, China State Council, Beijing, China,
CAM5-EAST model code and results can be made avail-                     available at: http://www.gov.cn/zwgk/2013-09/12/content/
able upon request. The surface PM2.5 observations are from              textunderscore2486773.htm (last access: 27 September 2020),
the China National Environmental Monitoring Center (CNEMC,              2013.
https://doi.org/10.5281/zenodo.5564726, Yang, 2021).                  Dong, E., Du, H., and Gardner, L.: An interactive web-based dash-
                                                                        board to track COVID-19 in real time, Lancet Infect. Dis.,
                                                                        20, 533–534, https://doi.org/10.1016/S1473-3099(20)30120-1,
Supplement. The supplement related to this article is available on-     2020.
line at: https://doi.org/10.5194/acp-21-15431-2021-supplement.        Fan, H., Zhao, C., and Yang, Y.: A comprehensive analy-
                                                                        sis of the spatio-temporal variation of urban air pollution
                                                                        in China during 2014–2018, Atmos. Environ., 220, 117066,
Author contributions. YY and LR designed the research. YY per-          https://doi.org/10.1016/j.atmosenv.2019.117066, 2020.
formed the model simulations. LR analyzed the data. All authors       Fan, T., Liu, X., Ma, P.-L., Zhang, Q., Li, Z., Jiang, Y.,
discussed the results and wrote the paper.                              Zhang, F., Zhao, C., Yang, X., Wu, F., and Wang, Y.: Emis-
                                                                        sion or atmospheric processes? An attempt to attribute the
                                                                        source of large bias of aerosols in eastern China simulated by
                                                                        global climate models, Atmos. Chem. Phys., 18, 1395–1417,
Competing interests. The contact author has declared that neither
                                                                        https://doi.org/10.5194/acp-18-1395-2018, 2018.
they nor their co-authors have any competing interests.
                                                                      Gelaro, R., McCarty, W., Suárez, M. J., Todling, R., Molod, A.,
                                                                        Takacs, L., Randles, C. A., Darmenov, A., Bosilovich, M. G., Re-
                                                                        ichle, R., Wargan, K., Coy, L., Cullather, R., Draper, C., Akella,
Disclaimer. Publisher’s note: Copernicus Publications remains           S., Buchard, V., Conaty, A., da Silva, A. M., Gu, W., Kim, G.,
neutral with regard to jurisdictional claims in published maps and      Koster, R., Lucchesi, R., Merkova, D., Nielsen, J. E., Partyka,
institutional affiliations.                                             G., Pawson, S., Putman, W., Rienecker, M., Schubert, S. D.,
                                                                        Sienkiewicz, M., and Zhao, B.: The Modern-Era Retrospective
                                                                        Analysis for Research and Applications, Version 2 (MERRA-2),
Acknowledgements. Hailong Wang acknowledges support from the            J. Climate, 30, 5419–5454, https://doi.org/10.1175/JCLI-D-16-
U.S. Department of Energy (DOE), Office of Science, Office of Bio-      0758.1, 2017.
logical and Environmental Research (BER). The Pacific Northwest       Hadley, O. L., Ramanathan, V., Carmichael, G. R., Tang,
National Laboratory (PNNL) is operated for DOE by the Battelle          Y., Corrigan, C. E., Roberts, G. C., and Mauger, G. S.:
Memorial Institute under contract no. DE-AC05-76RLO1830.                Trans-Pacific transport of black carbon and fine aerosol
                                                                        (D < 2.5 µm) into North America, J.-Geophys. Res., 112,
                                                                        D05309, https://doi.org/10.1029/2006JD007632, 2007.
Financial support. This research has been supported by the Na-        Heft-Neal, S., Burney, J., Bendavid, E., and Burke, M.: Robust
tional Key Research and Development Program of China (grant nos.        relationship between air quality and infant mortality in Africa,
2020YFA0607803 and 2019YFA0606800) and the National Natu-               Nature, 559, 254, https://doi.org/10.1038/s41586-018-0263-3,
ral Science Foundation of China (grant no. 41975159).                   2018.
                                                                      Huang, X., Ding, A., Gao, J., Zheng, B., Zhou, D., Qi, X., Tang, R.,
                                                                        Ren, C., Nie, W., Chi, X., Wang, J., Xu, Z., Chen, L., Li, Y., Che,
Review statement. This paper was edited by Kostas Tsigaridis and        F., Pang, N., Wang, H., Tong, D., Qin, W., Cheng, W., Liu, W.,
reviewed by two anonymous referees.                                     Fu, Q., Chai, F., Davis, S. J., Zhang, Q., and He, K.: Enhanced
                                                                        secondary pollution offset reduction of primary emissions dur-
                                                                        ing COVID-19 lockdown in China, Natl. Sci. Rev., 8, nwaa137,
                                                                        https://doi.org/10.1093/nsr/nwaa137, 2020.
                                                                      Hurrell, J. W., Holland, M. M., Gent, P. R., Ghan, S., Kay, J. E.,
References                                                              Kushner, P. J., Lamarque, J. F., Large, W. G., Lawrence, D.,
                                                                        Lindsay, K., Lipscomb, W. H., Long, M. C., Mahowald, N.,
Anderson, T. L., Charlson, R. J., Schwartz, S. E., Knutti, R.,          Marsh, D. R., Neale, R. B., Rasch, P., Vavrus, S., Vertenstein,
  Boucher, O., Rodhe, H., and Heintzenberg, J.: Climate forc-           M., Bader, D., Collins, W. D., Hack, J. J., Kiehl, J., and Marshall,
  ing by aerosol – a hazy picture, Science, 300, 1103–1104,             S.: The Community Earth System Model A Framework for Col-
  https://doi.org/10.1126/science.1084777, 2003.                        laborative Research, Bull. Am. Meteorol. Soc., 94, 1339–1360,
Bao, R. and Zhang, A.: Does lockdown reduce air pollution? Evi-         https://doi.org/10.1175/BAMS-D-12-00121.1, 2013.
  dence from 44 cities in northern China, Sci. Total Environ., 731,   Kong, L., Feng, M., Liu, Y., Zhang, Y., Zhang, C., Li, C., Qu, Y.,
  139052, https://doi.org/10.1016/j.scitotenv.2020.139052, 2020.        An, J., Liu, X., Tan, Q., Cheng, N., Deng, Y., Zhai, R., and Wang,
Chai, F., Gao, J., Chen, Z., Wang, S., Zhang, Y., Zhang, J., Zhang,     Z.: Elucidating the pollution characteristics of nitrate, sulfate and
  H., Yun, Y., and Ren, C.: Spatial and temporal variation of par-      ammonium in PM2.5 in Chengdu, southwest China, based on
  ticulate matter and gaseous pollutants in 26 cities in China,         3-year measurements, Atmos. Chem. Phys., 20, 11181–11199,
  J. Environ. Sci., 26, 75–82, https://doi.org/10.1016/S1001-           https://doi.org/10.5194/acp-20-11181-2020, 2020.
  0742(13)60383-6, 2014.

https://doi.org/10.5194/acp-21-15431-2021                                             Atmos. Chem. Phys., 21, 15431–15445, 2021
15444 L. Ren et al.: Aerosol transport pathways Le, T., Wang, Y., Liu, L., Yang, J., Yung, Y. L., Li, G., and Seinfeld, Myhre, G., Nagashima, T., Naik, V., Rumbold, S. T., Skeie, R., J. H.: Unexpected air pollution with marked emission reductions Sudo, K., Szopa, S., Takemura, T., Voulgarakis, A., Yoon, J.-H., during the COVID-19 outbreak in China, Science, 369, 702–706, and Lo, F.: Radiative forcing in the ACCMIP historical and fu- https://doi.org/10.1126/science.abb7431, 2020. ture climate simulations, Atmos. Chem. Phys., 13, 2939–2974, Le Quéré , C., Jackson, R. B., Jones, M. W., Smith, A. J. P., Aber- https://doi.org/10.5194/acp-13-2939-2013, 2013. nethy, S., Andrew, R. M., De-Gol, A. J., Willis, D. R., Shan, Y. Smith, C. J., Kramer, R. J., Myhre, G., Alterskjær, K., Collins, L., Canadell, J. G., Friedlingstein, P., Felix Creutzig, F., and Pe- W., Sima, A., Boucher, O., Dufresne, J.-L., Nabat, P., Mi- ters, G. P.: Temporary reduction in daily global CO2 emissions chou, M., Yukimoto, S., Cole, J., Paynter, D., Shiogama, H., during the COVID-19 forced confinement, Nat. Clim. Chang., O’Connor, F. M., Robertson, E., Wiltshire, A., Andrews, T., 10, 647–653, https://doi.org/10.1038/s41558-020-0797-x, 2020. Hannay, C., Miller, R., Nazarenko, L., Kirkevåg, A., Olivié, Lelieveld, J., Klingmüller, K., Pozzer, A., Burnett, R. T., D., Fiedler, S., Lewinschal, A., Mackallah, C., Dix, M., Pin- Haines, A., and Ramanathan, V.: Effects of fossil fuel cus, R., and Forster, P. M.: Effective radiative forcing and adjust- and total anthropogenic emission removal on public ments in CMIP6 models, Atmos. Chem. Phys., 20, 9591–9618, health and climate, P. Natl. Acad. Sci., 116, 7192–7197, https://doi.org/10.5194/acp-20-9591-2020, 2020. https://doi.org/10.1073/pnas.1819989116, 2019. Sulaymon, I. D., Zhang, Y., Hopke, P. K., Hu, J., Zhang, Y., Li, Liao, H., Chang, W., and Yang, Y.: Climatic effects of air pol- L., Mei, X., Gong, K., Shi, Z., Zhao, B., and Zhao, F.: Per- lutants over China: A review, Adv. Atmos. Sci., 32, 115–139, sistent high PM2.5 pollution driven by unfavorable meteoro- https://doi.org/10.1007/s00376-014-0013-x, 2015. logical conditions during the COVID-19 lockdown period in Li, L., Li, Q., Huang, L., Wang, Q., Zhu, A., Xu, J., Liu, the Beijing-Tianjin-Hebei region, China, Environ. Res., 198, Z., Li, H., Shi, L., Li, R., Azari, M., Wang, Y., Zhang, 111186, https://doi.org/10.1016/j.envres.2021.111186, 2021. X., Liu, Z., Zhu, Y., Zhang, K., Xue, S., Ooi, M. C. G., Tian, H., Liu, Y., Li, Y., Wu, C., Chen, B., Kraemer, M. U. G., Zhang, D., and Chan, A.: Air quality changes during the Li, B., Cai, J., Xu, B., Yang, Q., Wang, B., Yang, P., Cui, COVID-19 lockdown over the Yangtze River Delta Region: Y., Song, Y., Zheng, P., Wang, Q., Bjornstad, O. N., Yang, An insight into the impact of human activity pattern changes R., Grenfell, B. T., Pybus, O. G., and Dye, C.: An investiga- on air pollution variation, Sci. Total Environ., 732, 139282, tion of transmission control measures during the first 50 days https://doi.org/10.1016/j.scitotenv.2020.139282, 2020. of the COVID-19 epidemic in China, Science, 368, 638–642, Liu, X., Easter, R. C., Ghan, S. J., Zaveri, R., Rasch, P., Shi, X., https://doi.org/10.1126/science.abb6105, 2020. Lamarque, J.-F., Gettelman, A., Morrison, H., Vitt, F., Conley, UCAR: CAM5 model, UCAR [code], available at: http://www. A., Park, S., Neale, R., Hannay, C., Ekman, A. M. L., Hess, P., cesm.ucar.edu/models/cesm1.2/, last access: 14 October 2021. Mahowald, N., Collins, W., Iacono, M. J., Bretherton, C. S., Flan- Vautard, R., Yiou, P., and Oldenborgh, G.: Decline of fog, mist and ner, M. G., and Mitchell, D.: Toward a minimal representation haze in Europe over the past 30 years, Nat. Geosci., 2, 115–119, of aerosols in climate models: description and evaluation in the https://doi.org/10.1038/ngeo414, 2009. Community Atmosphere Model CAM5, Geosci. Model Dev., 5, Wang, H., Easter, R. C., Rasch, P. J., Wang, M., Liu, X., Ghan, S. 709–739, https://doi.org/10.5194/gmd-5-709-2012, 2012. J., Qian, Y., Yoon, J.-H., Ma, P.-L., and Vinoj, V.: Sensitivity of Liu, Y., Hong, Y., Fan, Q., Wang, X., Chan, P., Chen, X., Lai, remote aerosol distributions to representation of cloud–aerosol A., Wang, M., and Chen, X.: Source-receptor relationships for interactions in a global climate model, Geosci. Model Dev., 6, PM2.5 during typical pollution episodes in the Pearl River 765–782, https://doi.org/10.5194/gmd-6-765-2013, 2013. Delta city cluster, China, Sci. Total Environ., 596, 194–206, Wang, H., Rasch, P. J., Easter, R. C., Singh, B., Zhang, R., Ma, https://doi.org/10.1016/j.scitotenv.2017.03.255, 2017. P. L., Qian, Y., Ghan, S. J., and Beagley, N.: Using an explicit Ramanathan, V., Crutzen, P. J., Kiehl, J. T., and Rosenfeld, D.: emission tagging method in global modeling of source-receptor Aerosols, climate, and the hydrological cycle, Science, 294, relationships for black carbon in the Arctic: Variations, sources, 2119–2124, https://doi.org/10.1126/science.1064034, 2001. and transport pathways, J.-Geophys. Res., 119, 12888–12909, Ren, L., Yang, Y., Wang, H., Zhang, R., Wang, P., and Liao, H.: https://doi.org/10.1002/2014JD022297, 2014. Source attribution of Arctic aerosols and associated Arctic warm- Wang, H., Easter, R. C., Zhang, R., Ma, P., Singh, B., Zhang, K., ing trend during 1980–2018, Atmos. Chem. Phys., 20, 9067– Ganguly, D., Rasch, P. J., Burrows, S. M., Ghan, S. J., Lou, S., 9085, https://doi.org/10.5194/acp-2020-3,2020. Qian, Y., Yang, Y., Feng, Y., Flanner, M., Leung, L. R., Liu, Sharma, S., Zhang, M., Anshika, Gao, J., and Kota, S. X., Shrivastava, M., Sun, J., Tang, Q., Xie, S., and Yoon, J.: H.: Effect of restricted emissions during Covid-19 on Aerosols in the E3SM Version 1: New Developments and Their air quality in india, Sci. Total Environ., 728, 138878, Impacts on Radiative Forcing, J. Adv. Model. Earth Sy., 12, 293, https://doi.org/10.1016/j.scitotenv.2020.138878, 2020. https://doi.org/10.1029/2019MS001851, 2020. Shen, L., Zhao, T., Wang, H., Liu, J., Bai, Y., Kong, S., Zheng, Wang, P., Chen, K., Zhu, S., Wang, P., and Zhang, H.: Severe air H., Zhu, Y., and Shu, Z.: Importance of meteorology in air pollution events not avoided by reduced anthropogenic activi- pollution events during the city lockdown for COVID-19 in ties during COVID-19 outbreak, Resour. Conserv. Recycl., 158, Hubei Province, Central China, Sci. Total Environ., 754, 142227, 104814, https://doi.org/10.1016/j.resconrec.2020.104814, 2020. https://doi.org/10.1016/j.scitotenv.2020.142227, 2021. Wang, Q., Huang, R. J., Cao, J., Tie, X., Shen, Z., Zhao, S., Han, Y., Shindell, D. T., Lamarque, J.-F., Schulz, M., Flanner, M., Jiao, C., Li, G., Li, Z., Ni, H., Zhou, Y., Wang, M., Chen, Y., and Zhou, Chin, M., Young, P. J., Lee, Y. H., Rotstayn, L., Mahowald, N., Y.: Contribution of regional transport to the black carbon aerosol Milly, G., Faluvegi, G., Balkanski, Y., Collins, W. J., Conley, during winter haze period in Beijing, Atmos. Environ., 132, 11– A. J., Dalsoren, S., Easter, R., Ghan, S., Horowitz, L., Liu, X., 28, https://doi.org/10.1016/j.atmosenv.2016.02.031, 2016. Atmos. Chem. Phys., 21, 15431–15445, 2021 https://doi.org/10.5194/acp-21-15431-2021
L. Ren et al.: Aerosol transport pathways                                                                                              15445

Watson, J. G.: Visibility: Science and regulation,                        Yang, Y., Lou, S., Wang, H., Wang, P., and Liao, H.:
  J.    Air      Waste     Manage.      Assoc.,      52,    628–713,        Trends and source apportionment of aerosols in Europe
  https://doi.org/10.1080/10473289.2002.10470813, 2002.                     during 1980–2018, Atmos. Chem. Phys., 20, 2579–2590,
Xu, Q., Wang, S., Jiang, J., Bhattarai, N., Li, X., Chang,                  https://doi.org/10.5194/acp-20-2579-2020, 2020.
  X., Qiu, X., Zheng, M., Hua, Y., and Hao, J.: Nitrate                   Yang, Y.: Data for Aerosol transport pathways and source attribu-
  dominates the chemical composition of PM2.5 during haze                   tion in China during the COVID-19 outbreak, Zenodo [data set],
  event in Beijing, China, Sci. Total Environ., 689, 1293–1303,             https://doi.org/10.5281/zenodo.5564726, 2021.
  https://doi.org/10.1016/j.scitotenv.2019.06.294, 2019.                  Yu, H., Remer, L. A., Chin, M., Bian, H., Kleidman, R. G.,
Xue, W. B., Fu, F., Wang, J. N., Tang, G. Q., Lei, Y., Yang, J. T., and     and Diehl, T.: A satellite-based assessment of transpacific
  Wang, Y. S.: Numerical study on the characteristics of regional           transport of pollution aerosol, J.-Geophys. Res., 113, D14S12,
  transport of PM2.5 in China, J. Environ. Sci., 34, 1361–1368,             https://doi.org/10.1029/2007JD009349, 2008.
  2014.                                                                   Yu, H. B., Remer, L. A., Chin, M., Bian, H. S., Tan, Q., Yuan,
Yang, Y., Wang, H., Smith, S. J., Ma, P. L., and Rasch, P.                  T. L., and Zhang, Y.: Aerosols from overseas rival domes-
  J.: Source attribution of black carbon and its direct radia-              tic emissions over North America, Science, 337, 566–569,
  tive forcing in China, Atmos. Chem. Phys., 17, 4319–4336,                 https://doi.org/10.1126/science.1217576, 2012.
  https://doi.org/10.5194/acp-17-4319-2017, 2017a.                        Zhang, R., Wang, H., Hegg, D. A., Qian, Y., Doherty, S. J., Dang,
Yang, Y., Wang, H., Smith, S. J., Easter, R., Ma, P. L., Qian, Y.,          C., Ma, P.-L., Rasch, P. J., and Fu, Q.: Quantifying sources of
  Yu, H., Li, C., and Rasch, P. J.: Global source attribution of sul-       black carbon in western North America using observationally
  fate concentration and direct and indirect radiative forcing, At-         based analysis and an emission tagging technique in the Commu-
  mos. Chem. Phys., 17, 8903–8922, https://doi.org/10.5194/acp-             nity Atmosphere Model, Atmos. Chem. Phys., 15, 12805–12822,
  17-8903-2017, 2017b.                                                      https://doi.org/10.5194/acp-15-12805-2015, 2015.
Yang, Y., Wang, H., Smith, S. J., Zhang, R., Lou, S., Qian, Y., Ma,       Zheng, B., Tong, D., Li, M., Liu, F., Hong, C., Geng, G., Li, H., Li,
  P.-L., and Rasch, P. J.: Recent intensification of winter haze in         X., Peng, L., Qi, J., Yan, L., Zhang, Y., Zhao, H., Zheng, Y., He,
  China linked to foreign emissions and meteorology, Sci. Rep., 8,          K., and Zhang, Q.: Trends in China’s anthropogenic emissions
  2107, https://doi.org/10.1038/s41598-018-20437-7, 2018a.                  since 2010 as the consequence of clean air actions, Atmos. Chem.
Yang, Y., Wang, H., Smith, S. J., Easter, R. C., and Rasch,                 Phys., 18, 14095–14111, https://doi.org/10.5194/acp-18-14095-
  P. J.: Sulfate aerosol in the Arctic: Source attribution                  2018, 2018.
  and radiative forcing, J.-Geophys. Res., 123, 1899–1918,                Zhu, J., Xia, X., Che, H., Wang, J., Zhang, J., and Duan,
  https://doi.org/10.1002/2017JD027298, 2018b.                              Y.: Study of aerosol optical properties at Kunming in south-
Yang, Y., Wang, H., Smith, S. J., Zhang, R., Lou, S., Yu,                   west China and longrange transport of biomass burning
  H., Li, C., and Rasch, P. J.: Source apportionments of                    aerosols from North Burma, Atmos. Res., 169, 237–247,
  aerosols and their direct radiative forcing and long-term trends          https://doi.org/10.1016/j.atmosres.2015.10.012, 2016.
  over continental United States, Earth’s Future, 6, 793–808,             Zhu, J., Xia, X., Wang, J., Zhang, J., Wiedinmyer, C.,
  https://doi.org/10.1029/2018EF000859, 2018c.                              Fisher, J. A., and Keller, C. A.: Impact of Southeast
Yang, Y., Smith, S. J., Wang, H., Mills, C. M., and Rasch, P. J.:           Asian smoke on aerosol properties in Southwest China:
  Variability, timescales, and nonlinearity in climate responses to         First comparison of model simulations with satellite and
  black carbon emissions, Atmos. Chem. Phys., 19, 2405–2420,                ground observations, J. Geophys. Res.-Atmos., 122, 3904–3919,
  https://doi.org/10.5194/acp-19-2405-2019, 2019a.                          https://doi.org/10.1002/2016JD025793, 2017.
Yang, Y., Smith, S. J., Wang, H., Lou, S., and Rasch, P. J.: Impact
  of anthropogenic emission injection height uncertainty on global
  sulfur dioxide and aerosol distribution, J.-Geophys. Res., 124,
  4812–4826, https://doi.org/10.1029/2018JD030001, 2019b.

https://doi.org/10.5194/acp-21-15431-2021                                                Atmos. Chem. Phys., 21, 15431–15445, 2021
You can also read