ACCELERATING CASH RETURNS TO SHAREHOLDERS - CORPORATE PRESENTATION / OCTOBER 2021
←
→
Page content transcription
If your browser does not render page correctly, please read the page content below

CORPORATE PRESENTATION / OCTOBER 2021

  ACCELERATING CASH RETURNS TO SHAREHOLDERS
Whitecap Profile – TSX: WCP

         • Shares Outstanding (MM)
                   – Basic                               632.0
                   – Fully diluted                       640.8

         • Enterprise Value ($B)                         $5.8

         • 2022 Guidance
                   – Production (boe/d)         121,000 – 123,000
                   – Capital ($MM)                 $470 - $490

                                               Previous          New
         • Dividend per share (annual)          $0.195           $0.27

                   – Per share (monthly)       $0.01625      $0.0225

Refer to slide Notes and Advisories.

                                           2
Generating Significant Free Funds Flow

                                               2021      2022     % Change
    Production (boe/d)                        111,500   122,000     9%
               per million shares              185       190        3%
    ($MM)
    Funds Flow                                $1,064    $1,389      31%
               per share                       $1.77     $2.17      23%
    Capital Expenditures                       $430      $480       12%

               Free Funds Flow                 $634      $909       43%
    Dividends                                  $126      $171       36%

               Discretionary Funds Flow        $508      $738       45%

    Total Payout Ratio                         52%       47%        -10%

    Debt to EBITDA                             0.9x      0.3x       -67%
Refer to slide Notes and Advisories.

                                          3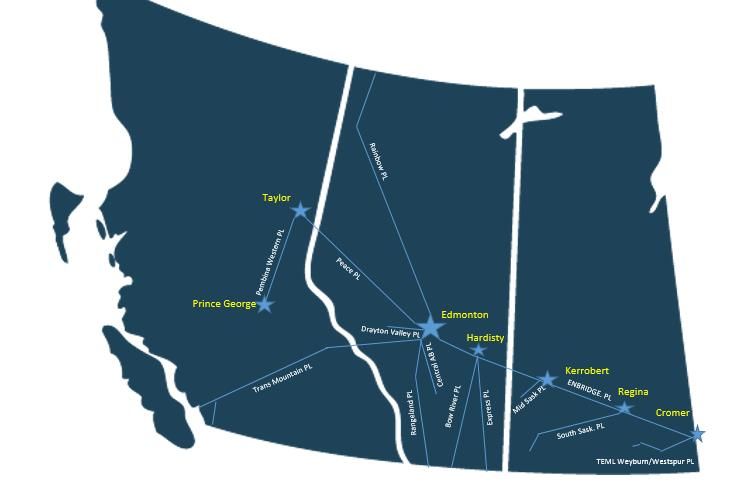
2022 Funds Flow Sensitivity

                                                           2022 Funds Flow Breakdown
                          $ million
                           $1,600       Discretionary Funds Flow
                                        Dividends ($0.27/share)
                           $1,400       Capital Spending

                           $1,200
                                                                                          $921
                           $1,000                                          $738
                                               $503
                              $800
US$40/B WTI
Break-Even                    $600             $171                        $171           $171

                              $400

                                               $480                        $480           $480
                              $200

                                 $0
                                           US$60/B WTI                  US$70/B WTI    US$80/B WTI

 Refer to slide Notes and Advisories.

                                                                    4
Focused on Cash Returns to Shareholders

   After recent Dividend increase to $0.27/share ($171 million annually)
                2022 Discretionary Funds Flow Allocation:

✓ 50% to Balance Sheet                             ✓ 50% Returned to Shareholders

   •   Maintain Financial Optionality                  •   Further Base Dividend Increases
         •   Disciplined & Targeted Acquisitions       •   Targeted Buybacks through NCIB
         •   New Energy Initiatives                    •   Special Dividend Consideration

                                                   5
Debt Management

    Financial Parameters
    ✓ Total Credit Capacity = $2 Billion                              ✓ 4-year committed facility with annual 1 year
                                                                        extensions
    ✓ Average cost of debt = 3.3%                                     ✓ Bank Covenant (D/EBITDA < 4.0x)

    Credit Facility Details
                                                    2021e                 2022e
                              Net Debt             $1.0 B                 $0.3 B
                           Total Credit            $2.0 B                 $2.0 B
                     Unutilized Capacity           $1.0 B                 $1.7 B
                         Debt / EBITDA              0.9x                   0.3x

    Maturities
                           Amount                 Type                  Rate          Maturity
                          $340 MM          Bank Debt – Variable         2.5%            2025
                          $400 MM           Bank Debt – Fixed           3.4%            2025
                          $595 MM           Sr. Notes – Fixed           3.6%       2022/2024/2026

Refer to slide Notes and Advisories.

                                                                  6
Risk Management
      Objectives:
              • Fully fund capital program and annual dividend payments
              • Downside price protection with upside participation
      Outcome:
              ✓ Based on current hedges in place, Whitecap can fully fund the 2022 capital
                  program and annual dividend of $0.27/share at US$45/bbl WTI

                        Oil hedges                                  Q4/2021             2022              2023
                        Percent of production hedged                     38%            17%               4%
                        Swaps hedged (bbls/d)                        21,250            5,591             1,000
                                Average swap price (C$/bbl)          $65.66            $66.53            $81.02
                        Collars hedged (bbls/d)                       5,500            6,748             1,992
                                  Average collar price (C$/bbl)   $54.82 x $73.6   $63.04 x $81.94   $66.24 x $99.62

                       Natural gas hedges                           Q4/2021             2022              2023
                       Percent of production hedged                   37%               15%                 -
                       Swaps hedged (GJ/d)                           66,717            28,945               -
                                  Average swap price (C$/GJ)          $2.17            $2.08                -
Refer to slide Notes and Advisories.

                                                                     7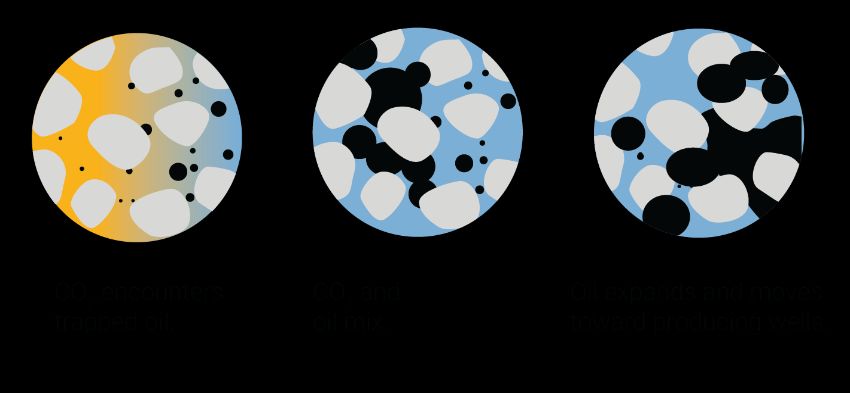
Base 3-Year Plan

               3-5% Production Per Share Growth
                                                                                     Disciplined Capital Program &
                                                               129,400
                                               125,700                           Targeted Acquisitions Enhance Growth
                              122,000

         111,500

           2021                 2022            2023               2024          Cumulative Free Funds Flow of $2.8 B
                                                                                    or $4.37/share at US$70/B WTI
                    Cumulative Free Funds Flow
                        US$60/B         US$70/B          US$80/B

                                                                    $3,500
                                                                    $2,800       Significant optionality for increasing
                                                                    $2,000                 return of capital

               2022                     2023                 2024

Refer to slide Notes and Advisories.

                                                                             8
Strong Track Record of Cash Returns to Shareholders

     58%                              $0.0225                     $113 million                      $1.2 billion
                                                                                                    Total dividends paid
   2021 dividend                     Current Monthly          Share repurchases completed                ($4.04/share)
     increases                          dividend                (as at October 13, 2021)         (est. to December 31, 2021)

                                          Cumulative Dividends
                      1,400                                                                             $4.50
                                          Cumulative NCIB                                               $4.00
                      1,200
                                          Cumilative Dividend & NCIB                                    $3.50
                      1,000
                                                                                                        $3.00

                                                                                                                $/share
         $ Millions

                       800                                                                              $2.50

                       600                                                                              $2.00

                                                                                                        $1.50
                       400
                                                                                                        $1.00
                       200
                                                                                                        $0.50

                         -                                                                              $0.00
                              2013      2014    2015     2016     2017     2018   2019   2020   2021e

                                                                       9
Sector Analysis: Dividend & Free Cash Flow Yield
Whitecap vs. S&P/TSX Composite Index

                                         20.0%

                                                                                                           Whitecap’s FCF yield exceeds all S&P/TSX Composite sectors
                                                  3.6%
                                                              2.4%                                              Driven by a strong asset portfolio and a corporate focus on return of capital
Average 2022E Dividend & FCF Yield (%)

                                                                                                                                                                                            Avg. Dividend Yield
                                         15.0%
                                                                                                                                                                                            Avg. Free Cash Flow Yield
                                                                          2.8%

                                                                                        3.9%
                                         10.0%

                                                 15.7%       15.7%                                               1.3%
                                                                                                    4.0%                       1.2%
                                                                         12.6%
                                                                                                                                              1.6%
                                         5.0%                                                                                                              1.7%
                                                                                        9.1%
                                                                                                                                                                                     1.3%            0.2%
                                                                                                                 7.0%          6.6%                                    3.3%
                                                                                                    5.4%                                      4.8%         4.3%                                      4.0%
                                                                                                                                                                                     3.4%
                                                                                                                                                                       1.8%
                                         0.0%
                                                 Whitecap    Canadian    Canadian   Communication   Utilities   Materials    Consumer       Industrials   Consumer   Real Estate   Health Care    Information
                                                            Integrated    Energy      Services                              Discretionary                  Staples                                Technology

                                                             Canadian
                                                                                                                            S&P / TSX Composite Sectors
                                                            Integrated

                                Refer to slide Notes and Advisories.

                                                                                                                      10
Leading Canada and the World in CO2 Sequestration
✓ Weyburn represents 42% of all sequestered volumes in Canada over the past year
✓ EOR projects represent 74% of all sequestered volumes in Canada over the past year
✓ Weyburn is the World’s Largest Anthropogenic CO2 Storage Project
MT CO2 Annual
MT CO2
40
36 2.00 42% 45%
35 1.75 40%
30 1.50 35%
28%
30%
25 1.25 24%
Alberta 25%
20 19 1.00
Saskatchewan 20%
15 0.75
15%
10 0.50 10%
7 6 5 0.25 4% 5%
5 2% 1% 0%
0.00 0%
0
Weyburn Sleipner Snøhvit Quest* Bell Creek*
Unit Storage Storage
Refer to slide Notes and Advisories.
11CCUS Capabilities
Weyburn CCUS Project – SE SK Whitecap CCUS Total
MT CO2 MT CO2
125 115 300
250
250
100
86
200
75
150
50
36 100 88
25 37
50
0 0
Sequestered To-Date Current Capacity Potential Capacity Sequestered To-Date Current Capacity Potential Capacity
• Sequester 2 MT CO2 per year (gross operated), • Significant potential within our existing land base
potential for 4 MT per year and across multiple zones
• 115 MT CO2 (gross operated) potential capacity • Whitecap has the technical expertise to safely
providing long remaining project life expand and enhance the use of CCUS across
Western Canada
Whitecap is well positioned to accelerate new energy opportunities
Refer to slide Notes and Advisories.
12Whitecap Competitive Advantages
✓ Top Tier Balance Sheet: Low leverage with ample liquidity. Secured
covenant-based credit facility not subject to annual redeterminations.
✓ Significant free funds flow profile: Premium assets characterized
by high netbacks, low base production declines and strong capital
efficiencies.
✓ Sustainable cash dividends: Dividend is 5x covered by free funds
flow and represent only 12% of funds flow.
✓ Robust drilling inventory: 5,927 locations for organic growth and
value creation.
✓ Leader in Sustainability: Sequesters 2MT CO2 annually
Refer to slide Notes and Advisories.
13Our Principles
✓ Balancing return of capital with ✓ Strong credit metrics
Strong Return on and ample liquidity
Capital Investing Debt/EBITDA 1 – 1.5x
✓ Leaders in ESG performance ✓ Fully Internally Funded
Sequesters 2MT CO2 annually income and growth model
Refer to slide Notes and Advisories.
14Disciplined Management Team
• Capital investment requires an acceptable Return on Capital
• Return of Capital is important but must be supported by funds flow
• Mitigate Risk through balance sheet and hedging
• Track record of Investing Within Funds Flow
Total Payout Ratio
$98
120% $93 $100
100% $80
$67 $70
$65
Total payout ratio
$57
80%
WTI (US$/bbl)
$49 $51 $60
60% $43 $39
$40
40%
20% $20
0% $0
2013 2014 2015 2016 2017 2018 2019 2020 2021e 2022e
Capex Dividends WTI (US$/bbl)
Refer to slide Notes and Advisories.
15Track Record of Per Share Growth
Funds Flow Production
$1,600 140,000 12% CAGR per share
$1,400
16% CAGR per share
120,000
$1,200 100,000
$1,000
80,000
Boe/d
$ million
$800
60,000
$600
$400 40,000
$200 20,000
$0 -
2010
2011
2012
2013
2014
2015
2016
2017
2018
2019
2020
2010
2011
2012
2013
2014
2015
2016
2017
2018
2019
2020
2021e
2022e
2021e
2022e
TPP Reserves
600,000
500,000
15% CAGR per share
400,000
Mboe
300,000
200,000
100,000
- 2018
2009
2010
2011
2012
2013
2014
2015
2016
2017
2019
Refer to slide Notes and Advisories.
2020
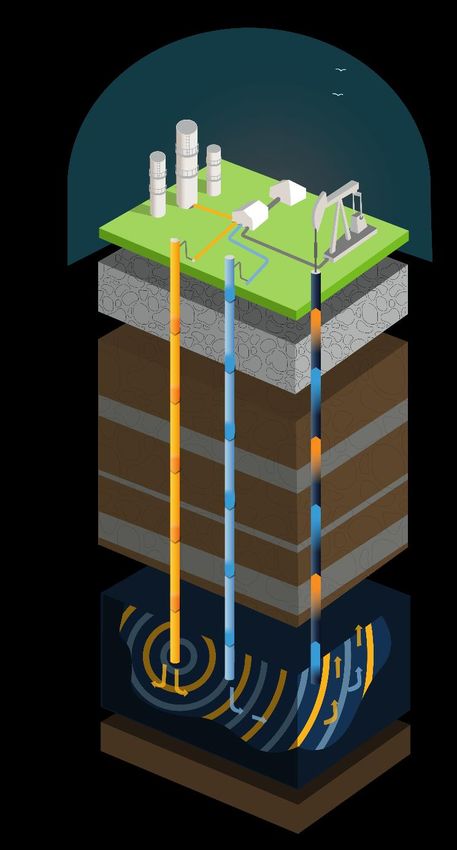
16How CO2 Capture and Sequestration Works
1. Collecting Waste Emissions
1 CO2 captured
We purchase CO2 from coal plants in Saskatchewan and North
Dakota. Without the Weyburn Unit, the majority of CO2 would oil to market 4
otherwise be released to the atmosphere. 2
liquified CO2 injected
CO2 captured is equivalent to
taking 8 million combustion water
injected
engine vehicles off the road
per year 1,500m
2. Safe Injection of CO2 impermeable
caprock
We inject CO2 in liquid form at high pressure into the producing
formation 1,500 meters underground. Injecting CO2 deep
underground safely stores carbon.
3 cross-section
of CO2 flood
3X 1,500 meters is equivalent to
three times the height of the
CN Tower in Toronto.
Refer to slide Notes and Advisories.
17How CO2 Capture and Sequestration Works
3. Sustainable Oil Production
1 CO2 captured
The CO2 acts likes a solvent to flush otherwise unrecoverable oil
from pores in the rock. This results in incremental oil production oil to market 4
that could not be achieved with conventional means. 2
liquified CO2 injected
water
injected
1,500m
4. Extracting Valuable Products impermeable
caprock
At the surface, oil and natural gas liquids are extracted for sale.
The CO2 produced during oil recovery is returned to the reservoir
so that all injected CO2 is permanently stored deep underground.
3 cross-section
of CO2 flood
Refer to slide Notes and Advisories.
182021 ESG Report Highlights
Emission Reductions Drive Net
GHG Emissions Further Negative
✓E: Emission Intensity Reduction
Target Increased to 30%
✓S: Best Ever Total Recordable
Injury Frequency of 0.26
✓G: Climate-Related Performance
Criteria Added to Short-Term
Incentive Plan
(797,329) T CO2e 693,224 T CO2e 502,383 T CO2e (1,992,936) T CO2e
Refer to slide Notes and Advisories.
19Core Areas of Operations
5,927 drilling locations
provides > 10 years growth
BRITISH COLUMBIA
2022 Avg. Locations ALBERTA
(boe/d) (#) SASKATCHEWAN
Northern AB & BC 36,500 1,226
Northern Alberta & BC
Central AB 29,000 1,312
Western SK 21,000 1,678
Central Alberta
Eastern SK 35,500 1,711
Western Saskatchewan
Total 122,000 5,927
Eastern Saskatchewan
Refer to slide Notes and Advisories.
20Crude Oil Marketing
• Active seller and shipper on 7 oil
feeder pipelines connected to
Enbridge mainline
• ~60% of production is protected
from Enbridge apportionment –
rail and direct sales to refineries
• Price diversification is a natural
6% hedge
16%
35%
43%
Condensate Medium Oil Sour Oil Sweet Oil
21TSX:WCP
www.wcap.ca
InvestorRelations@wcap.ca
October 14, 2021
22Slide Notes
Slide 2
1. Current shares outstanding as at October 13, 2021 and 8.8 million share awards outstanding.
2. Enterprise value is a non-GAAP measure. See Non-GAAP Financial Measures in the Advisories.
3. Enterprise value calculated based on fully diluted common shares outstanding as at October 13, 2021, a share price of $7.50 and year end 2021 net debt of approximately $1.0
billion.
4. See Oil and Gas Advisory in the Advisories for additional information on production.
Slide 3
1. See Oil and Gas Advisory in the Advisories for additional information on production.
2. Free funds flow is a non-GAAP measure. See Non-GAAP Financial Measures in the Advisories.
3. Discretionary funds flow is a non-GAAP measure. See Non-GAAP Financial Measures in the Advisories.
4. Total payout ratio is a non-GAAP measure. See Non-GAAP Financial Measures in the Advisories.
5. The debt used in the Debt to EBITDA calculation includes bank indebtedness, letters of credit, and dividends declared in accordance with the Company’s credit agreements.
6. The EBITDA used in the Debt to EBITDA calculation is adjusted for non-cash items, transaction costs and extraordinary and non-recurring items such as material acquisitions
or dispositions in accordance with the Company’s credit agreements.
7. Copies of the Company’s credit agreements may be accessed through the SEDAR website (www.sedar.com).
Slide 4
1. Discretionary funds flow is a non-GAAP measure. See Non-GAAP Financial Measures in the Advisories.
Slide 4 Price Assumptions
Oil (US$WTI) $60 $70 $80
FX (C$/US$) $0.78 $0.79 $0.80
Oil (C$/bbl) $76.92 $88.61 $100.00
AECO (C$/GJ) $3.75 $3.75 $3.75
Slide 6
1. The debt used in the Debt to EBITDA calculation includes bank indebtedness, letters of credit, and dividends declared in accordance with the Company’s credit agreements.
2. The EBITDA used in the Debt to EBITDA calculation is adjusted for non-cash items, transaction costs and extraordinary and non-recurring items such as material acquisitions
or dispositions in accordance with the Company’s credit agreements.
3. Copies of the Company’s credit agreements may be accessed through the SEDAR website (www.sedar.com).
4. Fixed bank debt of 3.40% is based on the weighted average fixed 5-year CDOR rate of 1.39% plus the Company’s current credit charge of 2.05%.
5. Variable bank debt of 2.50% is based on the current CDOR rate of 0.41% plus the Company’s current credit charge of 2.05%.
6. Whitecap EBITDA and interest expense used in the debt to EBITDA and EBITDA to interest calculations is based on the assumptions used for the 2021 and 2022 forecast funds
flow netback ($/boe) used on slide 3 of this presentation as referenced in Non-GAAP Financial Measure in the Advisories.
23Slide Notes (cont’d)
Slide 7
1. Hedge positions current to October 13, 2021. Full hedge positions by product are:
Volume Bought Put Price Sold Call Price Swap Price
WTI Crude Oil Term (bbls/d) (C$/bbl) (i) (C$/bbl) (i) (C$/bbl) (i)
Collar 2021 Oct – Dec 5,500 54.82 73.68
Collar 2022 Jan – Jun 7,000 63.21 81.17
Collar 2022 Jul - Dec 6,500 62.85 82.76
Collar 2023 Jan – Jun 2,000 67.50 98.58
Collar 2023 Jan - Dec 1,000 65.00 100.65
Swap 2021 Oct – Dec 21,250 65.66
Swap (iv) 2022 Jan – Jun 9,750 67.11
Swap 2022 Jul – Dec 1,500 62.83
Swap 2023 Jan – Jun 1,000 80.00
Swap 2023 Jul – Dec 1,000 82.02
MSW(ii) Volume Swap Price
Differential Term (bbls/d) ($/bbl) (i)
Swap 2021 Oct – Dec 9,000 C$6.16
24Slide Notes (cont’d)
Slide 7
1. Hedge positions current to October 13, 2021. Full hedge positions by product are:
WCS(iii) Volume Swap Price
Differential Term (bbls/d) ($/bbl) (i)
Swap 2021 Oct – Dec 4,000 C$16.74
Swap 2022 Jan – Dec 3,000 C$15.32
Volume Swap Price
Natural Gas Term (GJ/d) (C$/GJ) (i)
Swap 2021 Oct 26,000 2.39
Swap 2021 Oct – Dec 50,000 2.02
Swap 2021 Nov – 2022 Mar 12,000 2.89
Swap 2022 Jan - Mar 4,000 2.91
Swap 2022 Jan – Dec 25,000 1.95
25Slide Notes (cont’d)
Slide 7 (cont’d)
1. Hedge positions current to October 13, 2021. Full hedge positions by product are (cont’d):
Notes
(i) Prices reported are the weighted average prices for the period.
(ii) Mixed Sweet Blend (“MSW”)
(iii)Western Canadian Select (“WCS”)
(iv) 2,000 bbls/d are extendable through the first half of 2022, as a swap, with a price of C$68.00/bbl at the option of the counterparty through the exercise of a one-time
option on December 31, 2021.
2. Percent of net royalty volumes hedged are based on base Whitecap production of 118,000 boe/d for Q4/21, 122,000 boe/d for 2022 and 125,700 boe/d for 2023.
Slide 8
1. See Oil and Gas Advisory in the Advisories for additional information on production.
2. Free funds flow is a non-GAAP measure. See Non-GAAP Financial Measures in the Advisories.
Slide 10
1. Source: National Bank
2. Utilizing FactSet consensus estimates for free cash flow and dividends where available
3. Free cash flow (“FCF”) yield is calculated using 2022E consensus free cash flow estimates (post dividend) divided by market capitalization as at October 12, 2021
4. Canadian Integrated group includes CNQ, CVE, IMO, OVV, and SU
5. Analysis excludes Financials sector
Slide 11
1. Global storage data compiled from publicly available information with (*) denoting an estimate was incorporated.
2. Shell Quest values derived from publicly released data (2020) including estimated storage.
3. Denbury Bell Creek values derived from publicly available data (2017) plus estimated storage.
4. Canadian data compiled from geoSCOUT.
5. Whitecap has a 65.3% operated working interest in the Weyburn unit and 100% working interest in the Joffre project.
Slide 12
1. CO2 emissions and storage are based on gross operated numbers. Whitecap has a 65.3% operated working interest in the Weyburn Unit.
2. Currently have the supply and pipeline capacity to increase annual carbon sequestered to 4 MT.
3. Current capacity at Weyburn includes carbon sequestration capacity within current unit boundaries. Potential capacity includes unit extensions that may or may not be
currently owned.
4. Whitecap potential capacity includes gross CO2 sequestration capacity on lands and/or units that Whitecap has a working interest in.
26Slide Notes
Slide 13
1. See Oil and Gas Advisory in the Advisories for additional information on drilling locations.
2. Free funds flow is a non-GAAP measure. See Non-GAAP Financial Measures in the Advisories.
3. Dividend is 5x covered by free funds flow and represent only 12% of funds flow at US $70/bbl WTI.
Slide 14
1. The debt used in the Debt to EBITDA calculation includes bank indebtedness, letters of credit, and dividends declared in accordance with the Company’s credit agreements.
2. The EBITDA used in the Debt to EBITDA calculation is adjusted for non-cash items, transaction costs and extraordinary and non-recurring items such as material acquisitions
or dispositions in accordance with the Company’s credit agreements.
3. Copies of the Company’s credit agreements may be accessed through the SEDAR website (www.sedar.com).
Slide 15
1. Total payout ratio is a non-GAAP measure. See Non-GAAP Financial Measures in the Advisories.
Slide 16
1. Reserves for 2010-2020 are based on McDaniel & Associates Consultants Ltd.’s (“McDaniel”) reserves evaluation reports effective December 31 of the respective year in
accordance with NI 51-101 and the COGE Handbook.
2. For production and TPP reserves, the constituent product types and their respective quantities may be found in the Annual Information Form for the respective year, copies of
which may be accessed through the SEDAR website (www.sedar.com).
3. CAGR is the compound annual growth rate representing the measure of annual growth over multiple time periods.
Slide 17
1. CO2 emissions and storage are based on gross operated numbers. Whitecap has a 65.3% operated working interest in the Weyburn Unit.
Slide 18
1. CO2 emissions and storage are based on gross operated numbers. Whitecap has a 65.3% operated working interest in the Weyburn Unit.
2. A copy of the Canadian Council of Forest Ministers fact sheet may be accessed through the Sustainable Forest Management in Canada website (www.sfmcanada.org).
Slide 19
1. CO2 emissions and storage are based on gross operated numbers. Whitecap has a 65.3% operated working interest in the Weyburn Unit.
Slide 20
1. See Oil and Gas Advisory in the Advisories for additional information on drilling locations.
27Advisories
Special Note Regarding Forward-Looking Statements and Forward-Looking Information
This presentation contains forward-looking statements and forward-looking information within the meaning of applicable securities laws. Such forward looking statements or
information are provided for the purpose of providing information about management's current expectations and plans relating to the future. The use of any of the words
"expect", "anticipate", "continue", "estimate", "objective", "ongoing", "may", "will", "project", "should", "believe", "plans", "intends" and similar expressions are intended to
identify forward-looking information or statements. More particularly and without limitation, this presentation includes forward-looking information and statements about our
strategy, plans, objective, focus and priorities; 2021 and 2022 production and capital guidance and the allocation thereof; funds flow and discretionary funds flow allocation;
2022 discretionary funds flow break even; 2021 and 2022 funds flow, free funds flow, dividends, discretionary funds flow, total payout ratio and debt to EBITDA; 2021 and 2022
year-end liquidity and debt to EBITDA ratios; 2023-2024 production and free funds flow and the allocation thereof; and hedging objectives and the benefits to be derived from
our hedging program. Statements relating to "reserves" are also deemed to be forward-looking statements, as they involve the implied assessment, based on certain estimates
and assumptions, that the reserves described exist in the quantities predicted or estimated and that the reserves can be profitably produced in the future.
The forward-looking statements and information are based on certain key expectations and assumptions which have been used to develop such statements and information
but which may prove to be incorrect. Although Whitecap believes that the expectations reflected in such forward-looking statements or information are reasonable, undue
reliance should not be placed on forward looking statements because Whitecap can give no assurance that such expectations will prove to be correct. In addition to other
factors and assumptions which may be identified in this presentation, assumptions have been made regarding, among other things: general economic conditions in Canada,
the United States and elsewhere; prevailing commodity prices, exchange rates, interest rates, applicable royalty rates and tax laws; the impact (and the duration thereof) that
the COVID-19 pandemic will have on (i) the demand for crude oil, NGLs and natural gas, (ii) our supply chain, including our ability to obtain the equipment and services we
require, and (iii) our ability to produce, transport and/or sell our crude oil, NGLs and natural gas; the ability of OPEC+ nations and other major producers of crude oil to reduce
crude oil production and thereby arrest and reverse the steep decline in world crude oil prices; future production rates and estimates of operating costs; performance of
existing and future wells; reserve volumes; anticipated timing and results of capital expenditures; the success obtained in drilling new wells; the sufficiency of budgeted capital
expenditures in carrying out planned activities; the timing, location and extent of future drilling operations; the state of the economy and the exploration and production
business; results of operations; performance; business prospects and opportunities; the availability and cost of financing, labour and services; the impact of increasing
competition; ability to efficiently integrate assets and employees acquired through acquisitions, ability to market oil and natural gas successfully; and our ability to access
capital.
28Advisories (cont’d)
Since forward-looking statements and information address future events and conditions, by their very nature they involve inherent risks and uncertainties. These include, but
are not limited to: the risks associated with the oil and gas industry in general such as operational risks in development, exploration and production; delays or changes in plans
with respect to exploration or development projects or capital expenditures; the uncertainty of estimates and projections relating to reserves, production, costs and expenses;
health, safety and environmental risks; commodity price and exchange rate fluctuations; interest rate fluctuations; marketing and transportation; loss of markets;
environmental risks; competition; incorrect assessment of the value of acquisitions; failure to complete or realize the anticipated benefits of acquisitions or dispositions; ability
to access sufficient capital from internal and external sources; failure to obtain required regulatory and other approvals; reliance on third parties and pipeline systems; and
changes in legislation, including but not limited to tax laws, production curtailment, royalties and environmental regulations. Our actual results, performance or achievement
could differ materially from those expressed in, or implied by, the forward-looking information and, accordingly, no assurance can be given that any of the events anticipated
by the forward-looking information will transpire or occur, or if any of them do so, what benefits that we will derive therefrom. Management has included the above summary of
assumptions and risks related to forward-looking information provided in this press release in order to provide security holders with a more complete perspective on our future
operations and such information may not be appropriate for other purposes.
Readers are cautioned that the foregoing list of factors is not exhaustive. Additional information on these and other factors that could affect our operations or financial results
are included in reports on file with applicable securities regulatory authorities and may be accessed through the SEDAR website (www.sedar.com). The forward-looking
statements and information contained in this presentation are made as of the date hereof and Whitecap undertakes no obligation to update publicly or revise any forward-
looking statements or information, whether as a result of new information, future events or otherwise, unless so required by applicable securities laws.
In addition, this presentation contains certain forward-looking information relating to economics for drilling opportunities in the areas that Whitecap has an interest. Such
information includes, but is not limited to, anticipated payout rates, rates of return, profit to investment ratios and recycle ratios which are based on additional various forward
looking information such as production rates, anticipated well performance and type curves, the estimated net present value of the anticipated future net revenue associated
with the wells, anticipated reserves, anticipated capital costs, anticipated finding and development costs, anticipated ultimate reserves recoverable, anticipated future realized
hedging gains and losses, anticipated future royalties, operating expenses, and transportation expenses.
This corporate presentation contains future-oriented financial information and financial outlook information (collectively, "FOFI") about Whitecap’s 2021 and 2022 capital
expenditures, funds flow, free funds flow, dividends, discretionary funds flow, total payout ratio and debt to EBITDA; and, 2023 and 2024 free funds flow all of which are subject
to the same assumptions, risk factors, limitations, and qualifications as set forth in the above paragraphs. The actual results of operations of Whitecap and the resulting
financial results will likely vary from the amounts set forth in this presentation and such variation may be material. Whitecap and its management believe that the FOFI has
been prepared on a reasonably basis, reflecting management's best estimates and judgments. However, because this information is subjective and subject to numerous risks,
it should not be relied on as necessarily indicative of future results. Except as required by applicable securities laws, Whitecap undertakes no obligation to update such FOFI.
FOFI contained in this presentation was made as of the date of this presentation and was provided for the purpose of providing further information about Whitecap's
anticipated future business operations. Readers are cautioned that the FOFI contained in this presentation should not be used for purposes other than for which it is disclosed
herein.
Additionally, readers are advised that historical results, growth and acquisitions described in this presentation may not be reflective of future results, growth and acquisitions
with respect to Whitecap.
29Advisories (cont’d)
The assumptions used for the 2021/22 forecast funds flow netbacks ($/boe) used on slide 3 of this presentation are as follows:
2021 2022
Petroleum and natural gas revenues $61.21 $62.45
Tariffs ($0.40) ($0.50)
Processing income $0.65 $0.50
Realized hedging losses ($5.90) ($1.76)
Royalties ($10.01) ($11.07)
Operating expenses ($14.00) ($13.75)
Transportation expenses ($2.25) ($2.12)
General and administrative expenses ($1.00) ($1.00)
Interest and financing expenses ($1.20) ($0.85)
Cash settled share awards ($0.40) ($0.30)
Transaction costs ($0.30) --
Decommissioning liabilities ($0.25) ($0.40)
30Advisories (cont’d)
The assumptions used for the sensitivities on slide 4 in this presentation are as follows:
2022 WTI (US$/bbl) $60 $70 $80
Petroleum and natural gas revenues $54.15 $62.45 $70.00
Tariffs ($0.50) ($0.50) ($0.50)
Processing income $0.50 $0.50 $0.50
Realized hedging gains (losses) ($0.85) ($1.76) ($2.90)
Royalties ($8.97) ($11.07) ($13.38)
Operating expenses ($13.75) ($13.75) ($13.75)
Transportation expenses ($2.12) ($2.12) ($2.12)
General and administrative expenses ($1.00) ($1.00) ($1.00)
Interest and financing expenses ($0.85) ($0.85) ($0.85)
Cash settled share awards ($0.30) ($0.30) ($0.30)
Decommissioning liabilities ($0.40) ($0.40) ($0.40)
31Advisories (cont’d)
Oil and Gas Advisory
Barrel of Oil Equivalency
"Boe" means barrel of oil equivalent on the basis of 6 mcf of natural gas to 1 bbl of oil. Boe's may be misleading, particularly if used in isolation. A boe conversion
ratio of 6 mcf to 1 bbl is based on an energy equivalency conversion method primarily applicable at the burner tip and does not represent a value equivalency at the
wellhead. In addition, given that the value ratio based on the current price of crude oil as compared to natural gas is significantly different from the energy
equivalency of 6 to 1, utilizing a conversion on a 6 to 1 basis may be misleading as an indication of value.
Drilling Locations
This presentation also discloses drilling inventory in three categories: (i) proved locations; (ii) probable locations and (iii) unbooked locations. Proved locations and probable
locations are derived from the reserves evaluations of McDaniel of our oil and natural gas assets effective December 31, 2020, McDaniel of NAL’s oil and natural gas assets effective
December 31, 2020, Sproule of TORC’s oil and natural gas assets effective December 31, 2020 and Whitecap’s internal evaluation of Kicking Horse’s oil and natural gas assets at
April 1, 2021 and account for drilling locations that have associated proved and/or probable reserves, as applicable. Unbooked locations are internal estimates based on our
prospective acreage and an assumption as to the number of wells that can be drilled based on industry practice and internal review. Unbooked locations do not have attributed
reserves or resources. There is no certainty that we will drill all unbooked drilling locations and if drilled there is no certainty that such locations will result in additional oil and gas
reserves, resources or production. The drilling locations on which we actually drill wells will ultimately depend upon the availability of capital, regulatory approvals, seasonal
restrictions, oil and natural gas prices, costs, actual drilling results, additional reservoir information that is obtained and other factors. While some of the unbooked drilling locations
have been de-risked by drilling in relative close proximity to such unbooked drilling locations, other unbooked drilling locations are farther away from existing wells where
management has less information about the characteristics of the reservoir and therefore there is more uncertainty whether wells will be drilled in such locations and if drilled there
is more uncertainty that such wells will result in additional oil and gas reserves, resources or production.
The following table provides a detailed breakdown of the current Whitecap gross drilling locations included in this presentation:
Proved Probable Unbooked
Total Drilling Inventory
Locations Locations Locations
Northern Alberta & BC 1,226 253 75 898
Central Alberta 1,312 333 86 893
Western Saskatchewan 1,678 831 50 797
Eastern Saskatchewan 1,711 420 125 1,166
Total 5,927 1,837 336 3,754
32Advisories (cont’d)
Production
References to crude oil or natural gas production in the following table and elsewhere in this presentation refer to the light and medium crude oil and conventional natural
gas, respectively, product types as defined in National Instrument 51-101 – Standards of Disclosure for Oil and Gas Activities (“NI 51-101”).
Disclosure of production on a per boe basis in this presentation consists of the constituent product types and their respective quantities disclosed in the following table.
Crude Oil/Condensate NGLs Total
Natural Gas (Mcf/d)
(bbls/d) (bbls/d) (boe/d)
2021 Revised Guidance 74,600 - 75,200 10,100 - 10,400 157,800 - 158,400 111,000 - 112,000
2022 Budget 78,000 - 79,200 10,300 - 10,600 196,200 - 199,200 121,000 - 123,000
2022 Guidance - Northern AB & BC 16,000 3,150 104,100 36,500
2022 Guidance - Central AB 10,800 5,650 75,300 29,000
2022 Guidance - Western SK 19,100 200 10,200 21,000
2022 Guidance - Eastern SK 32,700 1,450 8,100 35,500
2023 3% Growth 81,300 10,500 203,400 125,700
2024 3% Growth 83,700 10,800 209,400 129,400
33Advisories (cont’d)
Initial Production Rates
Any references in this presentation to initial production rates (IP(365)) are useful in confirming the presence of hydrocarbons, however, such rates are not determinative of
the rates at which such wells will continue production and decline thereafter. While encouraging, readers are cautioned not to place reliance on such rates in calculating the
aggregate production for Whitecap.
Non-GAAP Measures
This presentation includes discretionary funds flow, enterprise value, free funds flow, market capitalization and total payout ratio which are non-GAAP measures. Non-
GAAP measures do not have a standardized meaning prescribed by International Financial Reporting Standards (“IFRS” or, alternatively, “GAAP”) and, therefore, may not
be comparable with the calculation of similar measures by other companies.
“Discretionary funds flow” represents funds flow less expenditures on property, plant and equipment (“PP&E”) and dividends. Management believes that discretionary
funds flow provides a useful measure of Whitecap's ability to increase returns to shareholders and to grow the Company’s business.
“Enterprise value” is calculated as market capitalization plus net debt. Management believes that enterprise value provides a useful measure of the market value of
Whitecap's debt and equity.
“Free funds flow” represents funds flow less expenditures on PP&E. Management believes that free funds flow provides a useful measure of Whitecap's ability to increase
returns to shareholders and to grow the Company’s business. Previously, Whitecap also deducted dividends paid or declared in the calculation of free funds flow. The
Company believes the change in presentation better allows comparison with both dividend paying and non-dividend paying peers.
“Market capitalization” is calculated as period end share price multiplied by the number of shares outstanding at the end of the period. Management believes that market
capitalization provides a useful measure of the market value of Whitecap's equity.
“Total payout ratio” is calculated as dividends paid or declared plus expenditures on PP&E, divided by funds flow. Management believes that total payout ratio provides a
useful measure of Whitecap’s capital reinvestment and dividend policy, as a percentage of the amount of funds flow.
34Research Coverage
• ATB Capital Markets • National Bank Financial
• BMO Capital Markets • Peters & Co.
• Canaccord Genuity • Raymond James
• CIBC World Markets • RBC Capital Markets
• Cormark Securities • Scotiabank Global
• Desjardins Capital Markets • STIFEL | FirstEnergy
• Haywood Securities • TD Securities
• Industrial Alliance Securities • Tudor Pickering Holt & Co.
35You can also read